
Abstract
Thematic analysis, often called Qualitative Content Analysis (QCA) in Europe, is one of the most commonly used methods for analyzing qualitative data. This paper presents the basics of this systematic method of qualitative data analysis, highlights its key characteristics, and describes a typical workflow. The aim is to present the main characteristics and to give a simple example of the process so that readers can assess whether this method might be useful for their own research. Special attention is paid to the formation of categories, since all scholars agree that categories are at the heart of the method.
You have full access to this open access chapter, Download chapter PDF
Keywords
- Qualitative data analysis
- Text analysis
- Qualitative methods
- Qualitative content analysis
- MAXQDA software
1 Introduction: Qualitative and Quantitative Data
Thematic analysis, often called Qualitative Content Analysis (QCA) in Europe, is one of the most commonly used methods for analyzing qualitative data (Guest et al. 2012; Kuckartz 2014; Mayring 2014, 2015; Schreier 2012). This chapter presents the basics of this systematic method of qualitative data analysis, highlights its key characteristics, and describes a typical workflow.
Working with codes and categories is a proven method in qualitative research. QCA is a method that is reliable, easy to learn, transparent, and it is a method that is easily understood by other researchers. In short, it is a method that enjoys a high level of recognition and is to be highly recommended, especially in the context of dissertations.
The aim of this paper is to present the main characteristics and to give a simple example of the process so that readers can assess whether this method might be useful for their own research. Special attention is paid to the formation of categories, since all scholars agree that categories are at the heart of the method.
Let’s start with some of the basics of data analysis in empirical research: What does ‘qualitative data’ mean, and what do we mean by ‘quantitative data’? Quantitative data entail numerical information that results, for example, from the collection of data from a standardized interview. In a quantitative data matrix, each row corresponds to a case, namely, an interview with a respondent. The columns of the matrix are formed by the variables. Table 8.1 therefore shows the data of four cases, here the respondents 1–4. Six variables were collected for these individuals, on a scale of 1–6, concerning how often they perform certain household activities (laundry, small repairs etc.). Typically, these kinds of data sets are available in social research in the form of a rectangular matrix, for instance as shown in Table 8.1.
A matrix like this that consists of numbers can be analyzed using statistical methods. For example, you can calculate univariate statistics such as mean values, variance, and standard deviations. You can also generate graphical displays such as box plots or bar charts. In addition, variables can be related to each other, for example by using methods of correlation and regression statistics. Another form of analysis tests groups for differences. In the above study, for example, the questions ‘Are women more frequently engaged in laundry than men in the household?’ and ‘Are men more frequently engaged in minor repairs than women in the household?’ can be calculated using an analysis of variance.
Qualitative data are far more diverse and complex than quantitative data. These data may comprise transcripts of face-to-face interviews or focus group discussions, documents, Twitter tweets, YouTube comments, or videos of the teacher-student interactions in the classroom.
In this chapter, I restrict the presentation of the QCA method to a specific type of data, namely qualitative interviews. This collective term can be used to describe very different forms of interviews, such as guideline-assisted interviews or narrative interviews on critical life events conducted in the context of biographical research. The latter can last several hours and comprise more than 30 pages as a transcription. A qualitative interview may also consist of a short online survey, like the one I conducted in preparation for my workshop at the International Congress on Mathematical Education (ICME-13).
Obviously, the different types of qualitative data are not as easy to analyze as the numbers in a quantitative data matrix. Numerous analytical methods have been developed in qualitative research, among them the well-proven method of qualitative content analysis.
2 Key Points of Qualitative Content Analysis
What are the key points of the qualitative content analysis method? Regardless of which variant of QCA is used, the focus will always be on working with categories (codes) and developing a category system (coding frame). What Berelson formulated in 1952 for quantitative content analysis still applies today, both to quantitative and qualitative content analysis:
Content analysis stands or falls by its categories (…) since the categories contain the substance of the investigation, a content analysis can be no better than its system of categories. (Berelson 1952, p. 147)
Categories are therefore of crucial importance for effective research, not only in their role as analysis tools, but also insofar as they form the substance of the research and the building blocks of the theory the researchers want to develop. That raises the question ‘What are categories?’—or more precisely, ‘What are categories in the context of empirical social research?’ Answering this question is by no means easy and there are at least two ways of doing so. The first way can be described as phenomenological: Kuckartz (2016, pp. 31–39) focuses on the use of this term in the practice of empirical social research, i.e., drawing attention to what is called a category in empirical social research. The result of this analysis is a very diverse spectrum, whereby several different types of categories can be distinguished in social science research literature (ibid., pp. 34–35):
-
Factual categories denote actual or supposed objective circumstances such as ‘length of training’ or ‘occupation’.
-
Thematic categories refer to certain topics, arguments, schools of thought etc. such as ‘inclusion’, ‘environmental justice’ or ‘Ukrainian conflict’.
-
Evaluative categories are related to an evaluation scale—usually ordinal types, for example the category ‘helper syndrome’ with the characteristics ‘not pronounced’, ‘somewhat pronounced’ and ‘pronounced’. For evaluative categories, it is the researchers who classify the data according to predefined criteria.
-
Analytical categories are the result of intensive analysis of the data, i.e., these categories move away from the description of the data, for example by means of thematic categories.
-
Theoretical categories are subspecies of analytical categories that refer to an existing theory, such as Ajzen’s theory of planned behavior, Ainsworth’s attachment theory, or Foucault’s analysis of power.
-
Natural categories, also called “in vivo codes” (Charmaz 2006, p. 56; Kuckartz 2014, p. 23), are terms used by the actors in the field.
-
Formal categories denote formal characteristics of an analysis unit, e.g., the length of time in an interview.
The above list is not complete; there are many more types of categories and corresponding methods of coding (Saldana 2015).
A second way of answering the question ‘What is a category?’ can be described as conceptual and historical; this way leads us far back into the history of philosophy. The conceptual historical view of the term, originating from ancient Greece, starts with Greek philosophy more than 2000 years ago. Plato and Aristotle already dealt with categories—Aristotle even in an elaboration of the same term (“categories”). The study of categories runs through Western philosophy from Plato and Kant to Peirce and analytical philosophy. The philosophers are by no means in agreement on the concept of categories, but a discussion of the differences between the different schools would far exceed the scope of this paper; Instead, reading the mostly very extensive contributions on the terms ‘category’ and ‘category theory’ in the various lexicons of philosophy is recommended. Categories are basic concepts of cognition; they are—generally speaking—a commonality between certain things: a term, a heading, a label that designates something similar under certain aspects. Categories also play this role in content analysis, as the following quote from the Content Analysis textbook of Früh (2004) demonstrates:
The pragmatic sense of any content analysis is ultimately to reduce complexity from a certain research-led perspective. Text sets are described in a classifying manner with regard to characteristics of theoretical interest. In this reduction of complexity, information is necessarily lost: On the one hand, information is lost due to the suppression of message characteristics that are present in the examined texts but are not of interest in connection with the present research question; on the other hand, information is lost due to the classification of the analyzed message characteristics. According to specified criteria, some of them are each considered similar to one another and assigned to a certain characteristic class or a characteristic type, which is called ‘category’ in the content analysis. The original differences in meaning of the message characteristics uniformly grouped in a category shall not be taken into account. (p. 42, translated by the author)
But how does qualitative content analysis arrive at its categories, the basic building blocks for forming theory? There are three principal ways to develop categories:
-
Concept-driven (‘deductive’) development of categories; in this case the categories
-
are derived from a theory or
-
derived from the literature (the current state of research) or
-
derived from the research question (e.g. directly related to an interview guide)
-
-
Data-driven (‘inductive’) development of categories; the characteristics here are
-
the step-by-step procedure,
-
the method of open coding until saturation occurs,
-
the continuous organization and systematization of the formed codes, and
-
the development of top-level codes and subcodes at different levels.
-
-
Mixing a concept-driven and data-driven development of codes:
-
The starting point here is usually a coding frame with deductively formed codes and
-
the subsequent inductive coding of all data coded with a specific main category.
-
The terms deductive and inductive are often used for the concept-driven and data-driven approaches, respectively. However, the use of the term ‘deductive’ is rather problematic in this context: In scientific logic, the term ‘inductive’ refers to the abstract conclusion from what has been observed empirically to a general rule or a law; this has little to do with the formation of categories based on empirical data. The situation is similar with the term ‘deductive’: In scientific logic, the deductive conclusion is a logical consequence of its premises; the formation of categories based on the state of research, a theory, or an advanced hypothesis is very different. Categories do not necessarily emerge from a systematic literature review or from a research question. Due to its skid resistance, however, the word pair ‘inductive-deductive’ will probably remain in the language theorem of empirical social research or the formation of categories for a long time to come. Nevertheless, I try to avoid the terms inductive and deductive, and—like Schreier (2012, p. 84)—prefer the terms ‘data-driven’ and ‘concept-driven’ for these different approaches to the formation of categories.
The decisive action in QCA is the coding of the data, i.e. a precisely defined part of the material is selected, and a category is assigned. As shown in the following figure, this may be a passage from an interview. Here, paragraph 15 of the text was coded with the code Simultaneousness (Fig. 8.1).

Text passage with a coded text segment
The individuals who perform this segmentation and coding of the data are referred to as coders. In this context, we also speak of “inter- and intracoder agreement” (reliability) (Krippendorff 2012; Kuckartz 2016; Schreier 2012). In quantitative content analysis, the units to be coded are usually defined in advance and referred to as coding units. In qualitative content analysis, on the other hand, coding units are not usually defined in advance; they are created by the coding process.
The general workflow of a qualitative content analysis is in Fig. 8.2. In all variants the research question plays the central role in this method: It provides the perspective for the textual work necessary at the beginning, that is, the intensive reading and study of the texts (Kuckartz 2016, p. 45). For qualitative methods, it is common for the individual analysis phases to be carried out on a circular basis. This also applies to QCA: The creation of categories and subcategories and the coding of the data can take place in several cycles. Saldana (2015) speaks of first cycle coding and second cycle coding, for example. The number of cycles is not fixed, and only in rare cases would one get by with just a single cycle.
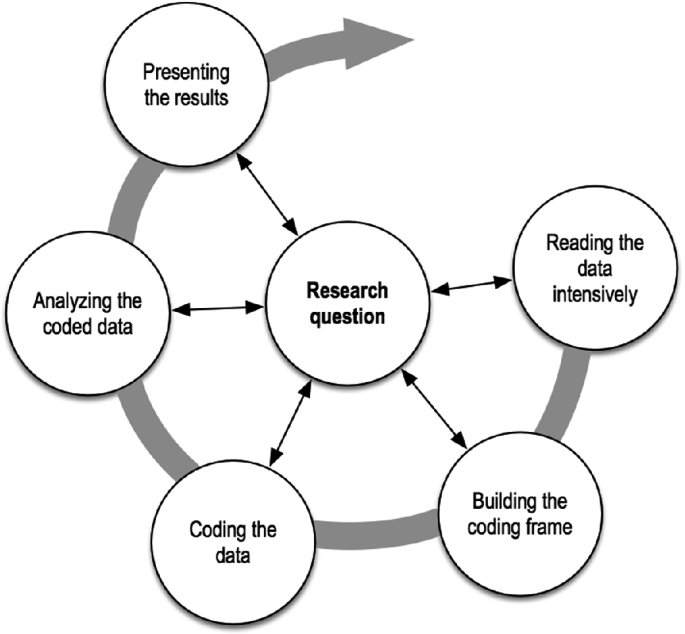
The five phases of qualitative content analysis
Once all the data have been coded with the final category frame, a systematization and structuring of all the relevant data in view of the research questions at hand will have been achieved. Table 8.2 illustrates a model of such a thematic matrix. It is similar to the quantitative data matrix shown in Fig. 8.2, but instead of containing numbers, the cells of the matrix now contain text excerpts coded with the respective corresponding category.
The further analysis of the matrix can now take two directions: If you look at columns, you can examine certain topics. These forms of analysis can be described as ‘category-based’. Looking at the rows, you can focus on cases (people) and carry out a ‘case-oriented analysis’.
Category-based analyses can focus on a specific category or even consider several categories simultaneously. For example, the statements made by the research participants can be contrasted between two or across several topics. Such complex analyses can lead to very rich descriptions or to the determination of influencing factors and effects, which can then be displayed in a concept map. Case-oriented analyses allow you to identify similarities between cases, identify extreme cases, and form types. Methods of consistently comparing and contrasting cases can be used to this end. For example, if you have determined a typology, you can then visualize it as a constellation of clusters and cases.
3 The Analysis Process in Detail
The example used in the following is a short online survey conducted in preparation for the ‘Workshop on qualitative text analysis’ as part of the ICME 13. The aim of the survey was to provide an overview of the research needs of the participants and their level of knowledge. In other words, its aim was descriptive and not about the development of hypotheses or a theory. In this online interview, I asked the following five questions and asked the participants to write their responses directly below the questions. Table 8.3 contains the resulting qualitative data.
Typically, QCA consists of six steps
-
Step 1: Preparing the data, initiating text work
-
Step 2: Forming main categories corresponding to the questions asked in the interview
-
Step 3: Coding data with the main categories
-
Step 4: Compiling text passages of the main categories and forming subcategories inductively on the material; assigning text passages to subcategories
-
Step 5: Category-based analyses and presenting results
-
Step 6: Reporting and documentation.
Since the purpose of the survey in this case was to get an overview of the relevant interests of the workshop participants and to tailor the workshop to their needs, the last step was omitted. There was no need for reporting and documentation.
The first phase consists of preparing of the data and conducting an initial read-through the responses; the analysis of this short survey did not require extensive interpretation of the responses. Since respondents used different fonts and font sizes in their e-mails, these had to be standardized first when preparing the data. In addition, the overall formatting was also adjusted to render it more uniform across responses. This would not have been absolutely necessary for the analysis, but without this preparation, later compilations of coded text passages might have looked rather chaotic.
In the second phase of QCA, categories are formed. When analyzing data obtained through an online survey, it is best to create a set of main categories based on the questions asked. In this analysis, the following five categories were formed for the first coding cycle:
-
1
Motives and goals
-
2
Experience with QCA
-
3
Specific questions about QCA
-
4
Experience with QDAS (Qualitative data analysis software)
-
5
Academic discipline.
Since the questions in the online survey were numbered, the numbers were retained for better orientation, but they could have been dispensed with without any problems.
According to the differentiation of categories laid out earlier in this paper, the categories Motives and goals and Specific questions about QCA are thematic categories. Category 5 Academic Discipline is a factual code. The other two categories Experience with QCA and Experience with QDAS are about the experiences with the method and with QDA software. If the researcher is interested in the extent of participants’ experience, both categories are evaluative categories; alternatively, if the specific type of experience is the primary point of interest, the categories are thematic. Since the aim of this survey was to get an overview of the level of knowledge and practical experience of the respondents, an overview was sufficient; detailed knowledge of the types of experience the participants had gained was not absolutely necessary. Reading the responses also demonstrated that the respondents understood the question in this sense and that in most cases no specific details were provided. In any case, working with software like MAXQDA guarantees that you can always return to the original texts should this be useful or necessary during the course of the analysis.
In the third phase of the analysis, the corresponding text segments are coded with the five main categories. Figure 8.3 shows a screenshot of the software MAXQDA after this first cycle of coding was performed on the survey responses. The assignments of the codes are displayed to the left of the corresponding text sections.

Display of a text with code assignments after the first cycle of coding
In the following fourth phase of the analysis, the coding frame is developed further. To do this, all the text passages coded with one of the main categories are first compiled, a procedure which is also referred to as retrieval. Subcodes are then developed directly in the relation to this data—in other words, the creation of categories is data-driven. This process is described in the following with regard to the first main category Motives and goals:
The category Motives and goals coded the responses to the question regarding what the participants wanted to learn in the workshop. First, all text passages to which this category was assigned were compiled. Then each of these text passages was coded a second time. This was done with a procedure similar to that of open coding in Grounded Theory (Strauss and Corbin 1990). In this case, the codes were short sequences of words that described what the participants wanted to learn:
-
analyze mathematics textbook curricula
-
learn type-building analysis
-
analyze e-portfolios and group discussions
-
analyze responses to open-ended questions
-
learn more about different research methods
-
how to establish credibility in practice
-
learn more about rigor within the process and how to ensure its validity
-
the role of reliability coefficients
-
insight into conducting qualitative research
-
learn about the QCA method
-
how to code video transcripts
-
how to take the richness of data into account (not only numbers)
-
analyze large numbers of open questions
-
learn more about a few different approaches to choose from
-
searching for a suitable method to analyze the interviews
-
interesting for me to see how colleagues are working.
As part of the software MAXQDA there is a module called “Creative Coding” that allows you to visually group codes obtained through the open coding method. After arranging the open codes, seven subcategories were created for the category “Motives and Objectives”, namely
-
Getting an overview of qualitative research
-
Getting an overview of QCA
-
Learning basic techniques
-
Learning about special type of analysis
-
Reliability and validity
-
Learning to analyze special types of data
-
Interesting for me to see how colleagues are working.
Figure 8.4 shows a visual display of the category formation; the original statements are assigned to the respective category. It turns out that many participants in the workshop were mainly interested in obtaining an overview of qualitative content analysis and qualitative research in general. The graph also implicitly illustrates the differences between a quantitative and qualitative analysis of the responses: Four participants (a comparatively large proportion) wanted to learn how to analyze specific types of data, but a closer look at the details, that is, the qualitative dimension, reveals that the types of data the respondents had in mind were completely different.

Visualization of the motives grouped into subcategories
Once the subcategories have been created, all the data coded with the main category Motives and goals must be coded a second time. This is also known as the second coding cycle. In this sample survey, all the coded text passages were included in the formation of the subcategories due to the relatively small sample. In the case of small sample sizes like this, the Creative Coding module automatically reassigns the subcategories. In the case of larger samples, however, category formation will usually be carried out only with a subsample and not with all the data, or the process of open coding will be performed only until the system of subcategories appears saturated and no further subcategories need to be redefined. Then, of course, the data that have not been considered up to this point must still be coded in line with the final category system.
The two categories Experience with QCA and Experience with QDAS were used to code the text passages in which the respondents reported on their experience with the QCA method and the use of QDA software. For the purposes of preparing the workshop as described above, the analysis should address only whether participants had prior experience and how extensive this experience was. An evaluative category with the values ‘yes’, ‘partial’, ‘no’ was therefore defined.
For the third main category, Specific questions about QCA, no subcategories were formed, since the questions formulated by the participants had to be retained in their wording to answer them in the workshop. However, the questions asked were sorted by topic, and essentially identical questions were summarized.
For category 5, Academic discipline, subcategories were initially formed according to the disciplines mentioned by the respondents. However, it quickly transpired that almost all participants came from the field of mathematics education and that there were only a few individual cases from other fields such as development psychology or primary school teacher (see Fig. 8.5). These individual cases were combined into the subcategory others for the final category system, so that ultimately only two subcategories were formed.

Main category “Academic discipline and status” with subcategories
After the main categories have been processed in this way—five in the case of this survey—the fifth phase ‘Category-based analyses and presenting results’ can begin. However, it should be clear that in the fourth phase of the development of the category system, an extensive amount of analytical work has already being carried out. The identification of the different motive types represents an analytical achievement in itself and is, at the same time, the foundation of the corresponding category-based analysis in phase 5. The category Motives and goals was of central importance in this survey. In addition to identifying the various motives, both quantitative and qualitative analyses can now be carried out. Quantitatively, we can determine how many people expressed which motives in their statement. Of course, it is quite possible for someone to have expressed several motives. In terms of a qualitative analysis, we can ask what is behind these categories in greater detail. In relation to the subcategory Learning to analyze special types of data, for example, we could ask which special data types the respondents had in mind here.
The category-based analysis always offers the option of focusing on qualitative and/or quantitative aspects. A frequency analysis of the category Experience with QDAS shows that the vast majority of participants have not yet had any practical experience with QDA software (see Fig. 8.6).

Bar chart of the category “Experiences with QDA software”
The question concerning their experience with text analysis methods presents a somewhat different picture. Quantitatively, we can see that more people are experienced in this regard, while the more detailed qualitative view reveals that this experience mainly involved the Grounded Theory method. It is interesting to compare the two categories that deal with experience. Table 8.4 contains an excerpt from such a comparison between five people.
There are also many further possibilities regarding the analysis of interrelationships that can be carried out in this fifth phase. For example, the connection between motives and goals, and previous knowledge and experience, can be examined. In relation to the specific questions asked by respondents in the survey, one could create a cross table (or “crosstab”) in which the questions asked by the experienced group are compared with the questions asked by those with no experience.
There are many other analysis options for larger studies than those presented for the small online survey. Qualitative content analysis is not a method that is always applied in the same way regardless of the data or research questions at hand. Although it is a systematic procedure, it nonetheless offers a flexibility that allows you to adapt it to the respective requirements of a project. There are other analytical possibilities in this regard, which were not mentioned in the above description. Among these, two should be highlighted in particular, namely, the possibility of paraphrasing text passages and the possibility of creating thematic summaries.
Paraphrasing passages of text can be understood in its everyday sense, namely, that researchers reformulate these text passages in their own words. This can be a very useful tool for category development. This technique is especially recommended for beginners, as it forces them to read the text line by line, interpret it to gain a thorough understanding, and then record it in their own words. It is certainly too time-consuming in most cases to edit all texts in this way but paraphrasing a selected subset of texts can sharpen your analytical view and be a valuable intermediate step in the development of a meaningful category system. Moreover, these paraphrases can then be sorted, particularly significant paraphrases can be combined, and gradually more abstract and theoretically rich categories can be formed.
In contrast to paraphrasing texts, formulating thematic summaries assumes that the texts have already been coded. In this approach, all the text passages coded in regard to a specific topic are read for each case and a thematic summary is written for each person. Usually, there is a huge gap between a category and the amount of original text assigned to it in the case of longer qualitative interviews, such as narrative interviews. On the one hand there is a relatively short code, such as ‘Environmental behavior in relation to nutrition’, and on the other there are numerous passages of varying length in which a respondent says something on this subject. A thematic summary summarizes all these passages as said by a certain person from the perspective of the research question. This means that the text is not repeated, but rather edited conceptually. Summaries thus create a second level between the original text and the categories and concepts. They also enable complex analyses to be carried out in which several categories are compared or the statements of different groups (women/men, different age groups, different schooling, etc.) are contrasted. This would be nigh impossible if the original quotations were always used since the amount of text would simply be too large, and it would consequently not be possible to create case overviews. A thematic summary, on the other hand, compresses what one person has said in such a way that it can easily be included in further analyses.
A third possibility the QCA method offers is the visualization of relationships between categories. Diagrams, in the form of concept maps, can be generated in which the influencing factors, effects, and relations are visualized.
Phase 6, ‘Reporting and documentation’, is about putting the results of your analyses on paper. The research report of a project working with the QCA method is usually divided into a descriptive and an analytical section. Depending on the method and the significance of the categories, category-based analyses will be the center of attention. The case dimension, however, which is all too often neglected, should also be taken into account in the report. It is often very valuable for the recipients of the research not only to learn something about the connections between the categories, but also something about the participants, that is, the cases that are consciously selected for such a presentation. It is particularly interesting if the cases are grouped into types and the report presents cases that are representative of these types.
The category-based presentation should be illustrated with quotes from the original material. However, you should also be aware of the danger of selective plausibility, i.e., that one mainly selects quotations that clarify the alleged connections between categories, while contradictory examples are not considered. For this reason, counterexamples should always be sought and included in the report.
Category-based analysis should not be limited to a description of the results per category but should also look at the relationships between two or more categories. In other words, you should move from the initial description to the development of a theory.
4 Summary and Conclusions
This chapter presents a method for the methodically controlled analysis of texts in empirical research. To conclude, therefore, the characteristics of the QCA method are concisely summarized:
-
The focus of the QCA method is on the categories with which the data are coded.
-
The categories of the final coding frame are described as precisely as possible and it is ensured that the coding procedure itself is reliable, i.e., that different coders concur in their coding.
-
The data must be coded completely. Complete in this sense means that all passages in the texts that are relevant to the research question are coded. It does, however, make sense to leave those parts of the data uncoded, which are outside the focus of the research question.
-
The codes and categories can be formed in different ways: empirically, i.e., based directly on the material, or conceptually, i.e., based on the current state of research or on a theory/hypothesis or, rather, as an implementation of the guidelines used in an interview or focus group.
-
The QCA method is carried out in several phases, ranging from data preparation, category building and coding—which may run in several cycles—to analysis, report writing and presenting the results. QCA therefore means more than just coding the data. Coding is an important step in the analysis, but it is ultimately a preparation for the subsequent analytical steps.
-
The actual analysis phase consists of summarizing the data, and constantly comparing and contrasting the data. The analysis techniques can be qualitative as well as quantitative. The qualitative analysis may, for example, consist of comparing the statements of certain groups (for instance according to their characteristics, e.g., socio-demographic characteristics) on certain topics. Differences and similarities are identified and summarized in a report. Quantitative analyses may, on the other hand, consist of comparing the frequency of certain categories and/or subcategories for certain groups.
-
Summary tables and diagrams (e.g., concept maps) can play an important role in the analysis. A good example of a presentation in table form would be a case overview of selected research participants (or groups), in which their statements on certain topics, their judgements and variable values are displayed. An example of a concept map would be a diagram of the determined causal effects of different categories.
-
Visualizations can also have a diagnostic function in QCA—similarly to imaging procedures in medicine. For example, a ‘cases by categories’ or ‘categories by categories’ display can help identify patterns in the data and indicate which categories are particularly frequently or particularly rarely associated with certain other categories.
-
When analyzing texts, you should keep in mind that you are working in the field of interpretation. It can be assumed that texts or statements could be interpreted differently. Instead of adopting a constructivist ‘anything goes’ approach, the QCA method tries to reach a consensus—as far as this is possible—on the subjective meaning of statements and tries to define the categories formed or used by it so precisely that an intersubjective agreement can be achieved in the application of the categories.
-
Group processes play an important role in this process of achieving the necessary level of agreement. Divergent assignments to categories are discussed as a team and should result in an improvement of the category definitions. Categories for which no agreement can be reached in the coding of relevant points in the data must be excluded from the analysis. Content analysis stands and falls by its categories. An analysis with the help of categories that are interpreted and applied differently in the research team, does not make sense.
-
QCA does not claim to be the best method but recognizes that it has its limits (the interpretation barrier) and that its results have to face comparison with those of competing methods.
The systematic approach of QCA is multidisciplinary and can be applied in many disciplines, including mathematics education (Schwarz 2015). This method is particularly appropriate when working with clearly formulated research questions, because these questions play the central role in this method. Indeed, in every phase of the analysis there is a strong reference to the questions leading the research. One strength of QCA is that it can be used both to describe social phenomena and to develop theories or test hypotheses (Hopf 2016, pp. 155–166).
References
Berelson, B. (1952). Content analysis in communication research. Glencoe: Free Press.
Charmaz, K. (2006). Constructing grounded theory. Thousand Oaks: SAGE.
Früh, W. (2004). Inhaltsanalyse. Theorie und Praxis (5th ed.). Konstanz: UVK.
Guest, G., MacQueen, K. M., & Namey, E. E. (2012). Applied thematic analysis. Thousand Oaks: SAGE.
Hopf, C. (2016). In W. Hopf & U. Kuckartz (Eds.), Schriften zu Methodologie und Methoden qualitativer Sozialforschung. Wiesbaden: Springer.
Krippendorff, K. H. (2012). Content analysis: An introduction to its methodology (3rd ed.). Thousand Oaks: SAGE.
Kuckartz, U. (2014). Qualitative text analysis: A guide to methods, practice and using software. Los Angeles: SAGE.
Kuckartz, U. (2016). Qualitative Inhaltsanalyse. Methoden, Praxis, Computerunterstützung (3rd ed.). Weinheim: Beltz Juventa.
Mayring, P. (2014). Qualitative content analysis: Theoretical foundation, basic procedures and software solution. Klagenfurt. http://nbn-resolving.de/urn:nbn:de:0168-ssoar-395173.
Mayring, P. (2015). Qualitative content analysis: Theoretical background and procedures. In A. Bikner-Ahsbahs, C. Knipping, & N. Presmeg (Eds.), Approaches to qualitative research in mathematics education. Examples of methodology and methods (pp. 365–380). Dordrecht: Springer.
Saldana, J. (2015). The coding manual for qualitative researchers (3rd ed.). Thousand Oaks: SAGE.
Schreier, M. (2012). Qualitative content analysis in practice. Thousand Oaks: SAGE.
Schwarz, B. (2015). A study on professional competence of future teacher students as an example of a study using qualitative content analysis. In A. Bikner-Ahsbahs, C. Knipping, & N. Presmeg (Eds.), Approaches to qualitative research in mathematics education. Examples of methodology and methods (pp. 381–399). Dordrecht: Springer.
Strauss, A. L., & Corbin, J. M. (1990). Basics of qualitative research: Grounded theory procedures and techniques. Thousand Oaks: Sage Publications, Inc.
Author information
Authors and Affiliations
Corresponding author
Editor information
Editors and Affiliations
Rights and permissions
Open Access This chapter is licensed under the terms of the Creative Commons Attribution 4.0 International License (http://creativecommons.org/licenses/by/4.0/), which permits use, sharing, adaptation, distribution and reproduction in any medium or format, as long as you give appropriate credit to the original author(s) and the source, provide a link to the Creative Commons license and indicate if changes were made.
The images or other third party material in this chapter are included in the chapter's Creative Commons license, unless indicated otherwise in a credit line to the material. If material is not included in the chapter's Creative Commons license and your intended use is not permitted by statutory regulation or exceeds the permitted use, you will need to obtain permission directly from the copyright holder.
Copyright information
© 2019 The Author(s)
About this chapter

Cite this chapter
Kuckartz, U. (2019). Qualitative Text Analysis: A Systematic Approach. In: Kaiser, G., Presmeg, N. (eds) Compendium for Early Career Researchers in Mathematics Education . ICME-13 Monographs. Springer, Cham. https://doi.org/10.1007/978-3-030-15636-7_8
Download citation
DOI: https://doi.org/10.1007/978-3-030-15636-7_8
Published:
Publisher Name: Springer, Cham
Print ISBN: 978-3-030-15635-0
Online ISBN: 978-3-030-15636-7
eBook Packages: EducationEducation (R0)