
Abstract
In Chap. 6, we solved the “backward problem” of starting with frequency response function (FRF) measurements and developing a model. However, we did not describe the measurement procedure. The basic hardware required to measure FRFs is: a mechanism for known force input across the desired frequency range (or bandwidth) a transducer for vibration measurement, again with the required bandwidth a dynamic signal analyzer to record the time-domain force and vibration inputs and convert these into the desired FRF.
Access this chapter
Tax calculation will be finalised at checkout
Purchases are for personal use only
Notes
- 1.
You may recognize this Doppler frequency shift as the increase in the pitch (frequency) of an approaching automobile’s horn and subsequent drop in pitch after the automobile passes you.
- 2.
The prefix piezo is derived from the Greek word piezein, which translates “to squeeze.”
- 3.
This follows from Newton’s second law, F = ma.
- 4.
The discrete Fourier transform is applied because our inputs are sampled; they are not continuous in time.
- 5.
This \( \frac{1}{k} \) term can be referred to as the DC compliance.
References
http://www.lionprecision.com/tech-library/technotes/cap-0020-sensor-theory.html
Inman D (2001) Engineering vibration, 2nd edn. Prentice Hall, Upper Saddle River
Author information
Authors and Affiliations
Corresponding author
Exercises
Exercises
-
1.
Complete the following statements.
-
(a)
Receptance is the frequency-domain ratio of _____________ to ____________.
-
(b)
Mobility is the frequency-domain ratio of _____________ to ____________.
-
(c)
Accelerance is the frequency-domain ratio of _____________ to ____________.
-
(a)
-
2.
Find three commercial suppliers of impact hammers for modal testing.
-
3.
Find three commercial suppliers of dynamic signal analyzers for modal testing.
-
4.
Digital data acquisition is to be used to record vibration signals for a particular system. If the highest anticipated frequency in the measurements is 5,000 Hz, select the minimum sampling frequency.
-
5.
An impact test was completed using an instrumented hammer to excite a structure and an accelerometer to measure the vibration response.
-
(a)
Show how to convert the acceleration-to-force frequency response function (i.e., accelerance) that was obtained to a displacement-to-force frequency response function (i.e., receptance).
-
(b)
What information is lost in this conversion?
-
(a)
-
6.
As described in Sects. 7.2 and 7.4, FRFs are often measured using impact testing. In this approach, an instrumented hammer is used to excite the structure and a transducer is used to record the resulting vibration.
Fig. P7.6 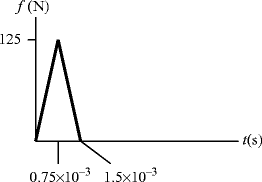
Impulsive force profile for impact test
Use Euler integration to determine the displacement due to the triangular impulsive force profile shown in Fig. P7.6. The force excites a single degree of freedom spring–mass–damper system with m = 2 kg, k = 1.1 × 10⁶ N/m, and c = 83 N-s/m. For the Euler integration, use a time step of 1 × 10⁻⁵ s and carry out your simulation for 0.2 s (20,000 points).
-
(a)
Plot both the force (N) versus time (s) and displacement (μm) versus time.
-
(b)
Determine the maximum displacement (in μm) and the time at which this displacement occurs.
-
(a)
-
7.
For a particular measurement application, an accelerometer must be selected with a bandwidth or useful frequency range of 5,000 Hz. If the allowable deviation in the scaling coefficient \( {C_A} = \frac{1}{{\sqrt {{{{\left( {1 - {r^2}} \right)}^2} + {{\left( {2\zeta r} \right)}^2}}} }} \) is ±1% and the damping ratio is known to be 0.65, determine the minimum required for the natural frequency of the accelerometer.
-
8.
A single degree of freedom spring–mass–damper system which is initially at rest at its equilibrium position is excited by an impulsive force with a magnitude of 250 N over a time interval of 0.5 ms; see Fig. P7.8. If the mass is 3 kg, the stiffness is \( 3 \times {10^6} \) N/m, and the viscous damping coefficient is 120 N-s/m, complete the following.
-
(a)
Determine \( x(t) \) using Eq. 3.44. Plot the response (in μm) over a time period of 0.3 s with a step size of 1 × 10⁻⁴ s in the time vector.
-
(b)
Determine \( x(t) \) using Euler integration. Use a time step of 1 × 10⁻⁴ s and carry out your simulation for 0.3 s (30,000 points). Plot \( x(t) \) (in μm) versus time.
Fig. P7.8 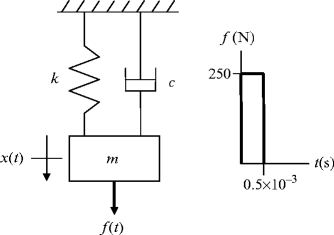
Spring–mass–damper system excited by an impulsive force
-
(a)
-
9.
Determine the FRF for the system described in Problem 8 using Euler integration to calculate the time-domain displacement due to the impulsive input force. To increase the FRF frequency resolution, use a total simulation time of 1 s. Given the time-domain displacement and force vectors, use the Matlab ® function fft to calculate the complex-valued force transform, F, and displacement transform, X. Plot the real and imaginary parts (in m/N) of their ratio, X/F, versus frequency (in Hz). Use axis limits of axis([0 500 -5e-6 5e-6]) for the real plot and axis limits of axis([0 500 -1e-5 1e-6]) for the imaginary plot.
-
10.
The existence of modes with frequencies higher than the measurement bandwidth leads to an effect referred to as _______________ when performing a modal fit to the measured FRF.


Rights and permissions
Copyright information
© 2012 Springer Science+Business Media, LLC
About this chapter
Cite this chapter
Schmitz, T.L., Smith, K.S. (2012). Measurement Techniques. In: Mechanical Vibrations. Springer, Boston, MA. https://doi.org/10.1007/978-1-4614-0460-6_7
Download citation
DOI: https://doi.org/10.1007/978-1-4614-0460-6_7
Published:
Publisher Name: Springer, Boston, MA
Print ISBN: 978-1-4614-0459-0
Online ISBN: 978-1-4614-0460-6
eBook Packages: EngineeringEngineering (R0)