
Abstract
The processes for identifying runtime issues and possible problematic code in an Android OS–targeted application or in the Android system software stack are remarkably similar. The challenges and approaches are the same, regardless of whether the underlying platform architecture is based on Intel architecture and the latest-generation Atom processor or on ARM architecture. This chapter provides an overview of the available debug methodologies for Android-targeted software on Intel architectures. We will also touch on the setup and configuration of application and system software debug environments targeting Android and Intel architectures in the early part of the chapter. In the process of doing so, we will also point out where the experience differs when developing for ARM architecture.
Not all problems have a technological answer, but when they do, that is the more lasting solution.
—Andy Grove, semiconductor manufacturing pioneer
You have full access to this open access chapter, Download chapter PDF
Keywords
These keywords were added by machine and not by the authors. This process is experimental and the keywords may be updated as the learning algorithm improves.
The processes for identifying runtime issues and possible problematic code in an Android OS–targeted application or in the Android system software stack are remarkably similar. The challenges and approaches are the same, regardless of whether the underlying platform architecture is based on Intel architecture and the latest-generation Atom processor or on ARM architecture. This chapter provides an overview of the available debug methodologies for Android-targeted software on Intel architectures. We will also touch on the setup and configuration of application and system software debug environments targeting Android and Intel architectures in the early part of the chapter. In the process of doing so, we will also point out where the experience differs when developing for ARM architecture.
Prerequisites
This chapter covers the Intel USB driver that is necessary to enable remote application debugging on an Intel Atom processor-based device running Android OS. Additionally we will also look at the Intel Atom x86 System Image for the Android Emulator. If no physical debug target is available, having a virtual Intel Atom processor-based device emulated inside the Android SDK’s device emulation layer is the next best option. These two prerequisites in conjunction with the Android SDK build the foundation for cross-development targeting an Intel Atom processor-based tablet or smartphone.
Intel USB Driver for Android Devices
This section looks at the Intel Android USB driver package, which enables you to connect your host development machine to an Android device that contains an Intel Atom processor inside. In this first example, we assume a Windows development host. Similar principles apply to Linux or OS X host systems.
-
1.
Download the installer package from http://www.intel.com/software/android .
-
2.
Run the installer and accept the Windows User Account Control (UAC) prompt, if applicable.
-
3.
You will see the screen in Figure 8-1. Click Next to continue. (If the installer detects an older version of the driver, accept to uninstall it.)

USB Device Driver Installation Start Screen
-
4.
Read and agree to the Intel Android USB Driver End-User License Agreement (EULA).
-
5.
You will be prompted to select components. Click the Next button to proceed.
-
6.
Choose the path for the installation and click Install.
-
7.
The installer will proceed to install the Android USB drivers. This may take a few minutes (see Figure 8-2).

USB Device Driver Installation Progress Screen
-
8.
After the driver installation is completed, click OK on the pop-up note and then click on Finish to close the installation program.
Installing the Intel Atom x86 System Image for Android Emulator
For the alternative of debugging on the development host using the Android Virtual Device Manager, the first prerequisite is the availability of the appropriate system image.
Using the Android Emulator requires both an Intel Atom x86 System Image and the Android SDK to be installed. Please refer to the Android developer web site ( http://developer.android.com/sdk/installing.html ) for Android SDK installation instructions, or refer to Chapter 6: Installing the Android SDK for Intel Application Development. The Android SDK Manager allows you to download and install the Intel Atom Android x86 Emulator Image add-on, and then the necessary Intel Atom x86 System Image.
Follow these steps:
-
1.
Start the Android SDK Manager program.
-
2.
Under Packages ➤ Android 4.x.x (API 1x), check the box to select Intel Atom x86 System Image by Intel Corporation.
-
3.
Once selected, click the Install Package button, as shown in Figure 8-3.
Note
You may have more than one package to install, based on other packages that you or the Android SDK Manager program selected.

Android SDK Manager Selection for x86 System Image
-
4.
Review the Intel Corporation license agreement. If you accept the terms, select the Accept option and click the Install button, as shown in Figure 8-4.

Android SDK Manager—Accepting Licensing Terms
-
5.
At this point, the Android SDK Manager will download and install the add-on to your Android SDK add-ons folder (<sdk>/add-ons/). The download and install will take several minutes, depending on your connection speed.
-
6.
Select Manage AVDs from the Tools menu (see Figure 8-5).

Android SDK Manager—Manage Android Virtual Devices
-
7.
The Android Virtual Device Manager window should appear. Click New (see Figure 8-6).

Adding a New Android Virtual Device
-
8.
Enter a name for your virtual device in the Name field. Spaces are not allowed in the name.
-
9.
Select Intel Atom x86 System Image (Intel Corporation) – API Level 10 from the Target field drop-down list (see Figure 8-7).

The Intel Atom x86 System Image as a Virtual Device Target
-
10.
Once you select your configuration settings, click the Create AVD button.
-
11.
The new virtual device should appear on the Android Virtual Device Manager. Select the new device and click the Start button, as shown in Figure 8-8.

Starting an Android Virtual Device
-
12.
The Launch Options window should appear. Select the screen size and DPI for your system. Otherwise, the emulator might exceed the dimensions of your viewing screen. Click the Launch button (see Figure 8-9).

Virtual Device Launch Options
-
13.
After a few moments, the emulator will launch and show you the screen in Figure 8-10.

AVD Emulation of Intel Architecture-Based Android Device
Application Debugging Using the Android Debug Bridge
The Android Debug Bridge (ADB) is a command-line tool that handles debug communication between a debugger on the host—usually GDB, DDMS (Dalvik Debug Monitor Server), or ADT—and an Android image running on the target. The target image could be running on device emulation or running on a physical development device, which you communicate with via a USB-OTG (on-the-go) or USB-to-Ethernet dongle. In short, ADB is the glue that makes application debugging on Android possible.
The device you are connecting to or emulating could cover a wide range of form factors. Typically it would be a smartphone or tablet. It could also be a medical tablet or an embedded device in an industry setting, home energy management, warehousing, or any number of intelligent systems applications.
Setting up the Android Debug Bridge to allow remote debugging of a platform based on the Intel Atom processor does not differ very much from debugging on other architectures.
Setting Up ADB
First you need the Android SDK, including ADB installed on the development host. Instructions for this can be found at http://developer.android.com/sdk/installing.html .
If your target image is running on a physical device, you need to include USB-OTG or USB-to-Ethernet support. For USB-to-Ethernet support, a kernel configuration change and rebuild is required. Your OEM will provide you with the necessary information if desired.
The standard method for remote application debug is to use the existing USB-OTG interface of most Android devices. The setup is described in detail at the Android developer web site at http://developer.android.com/guide/developing/device.html .
The key steps are:
-
1.
Declare your application as “debuggable” in your Android manifest.
-
2.
Turn on USB Debugging on your device.
-
3.
On the device, go to Settings ➤ Applications ➤ Development and enable USB debugging (on an Android 4.x.x device, the setting is located in Settings ➤ Developer Options).
-
4.
Set up your system to detect your device.
If you’re developing on Windows, you need to install a USB driver for ADB—visit http://developer.android.com/tools/extras/oem-usb.html for driver downloads and prerequisites.
If you’re developing on Ubuntu Linux, you need to add a udev rules file that contains a USB configuration for each type of device you want to use for development. In the rules file, each device manufacturer is identified by a unique vendor ID, as specified by the ATTR{idVendor} property. For a list of vendor IDs, see http://developer.android.com/tools/device.html#VendorIds .
To set up device detection on Ubuntu Linux, log in as root and create this file:
/etc/udev/rules.d/51-android.rules
Use this format to add each vendor to the file:
SUBSYSTEM=="usb", ATTR{idVendor}=="????", MODE="0666", GROUP="plugdev"
The MODE assignment specifies read/write permissions, and GROUP defines which UNIX group owns the device node.
Execute:
chmod a+r /etc/udev/rules.d/51-android.rules
When plugged in over USB, you can verify that your device is connected by executing ADB devices from your SDK platform-tools/directory. If connected, you’ll see the device name listed as a device.
With the Android OS booted on the SDK, connect a USB-OTG cable to the (USB mini b) port on the SDK and connect the other end of the cable (USB A) to your development host.
If everything is working, you should be able to run the following command to see the attached device:
$ adb devices
* daemon not running. starting it now *
* daemon started successfully *
List of devices attached
0123456789ABCDEF device
Note
To see which device name is assigned to this connection on the Linux dev. host, you can look at dmesg to find the address of the usb-storage: device found at <num> and then run an ls -l /dev/bus/usb/* listing to find that number.
ADB on Windows
Download and install Eclipse Classic from http://www.eclipse.org/downloads/ .
Download the Android SDK package for Windows from http://developer.android.com/sdk/index.html (android-sdk_r18-windows.zip or installer_r18-windows.exe).
After installing the Android SDK, adb.exe will be located at <install-dir>\android-sdk\platform-tools.
ADB Host-Client Communication
Thus far we focused on installing ADB on the development host. In reality, it is a client-server program that includes three components:
-
A client that runs on your development machine. You can invoke a client from a shell by issuing an ADB command. Other Android tools, such as the ADT plug-in and DDMS, also create ADB clients.
-
A server that runs as a background process on your development machine. The server manages communication between the client and the ADB daemon running on an emulator or device.
-
A daemon that runs as a background process on each emulator or device instance.
When you start an ADB client, the client first checks whether there is an ADB server process already running. If there isn’t, it starts the server process. When the server starts, it binds to a local TCP port 5037 and listens for commands sent from ADB clients—all ADB clients use port 5037 to communicate with the ADB server.
The server then sets up connections to all running emulator/device instances. It locates emulator/device instances by scanning odd-numbered ports in the range 5555 to 5585, which is the range used by emulators/devices. When the server finds an ADB daemon, it sets up a connection to that port. Note that each emulator/device instance acquires a pair of sequential ports—an even-numbered port for console connections and an odd-numbered port for ADB connections. For example:
Emulator 1, console: 5554
Emulator 1, adb: 5555
Emulator 2, console: 5556
Emulator 2, adb: 5557 …
As shown, the emulator instance connected to ADB on port 5555 is the same as the instance whose console listens on port 5554.
Once the server has set up connections to all emulator instances, you can use ADB commands to control and access those instances. Because the server manages connections to emulator/device instances and handles commands from multiple ADB clients, you can control any emulator/device instance from any client (or from a script).
Starting ADB
Type adb shell. You will get a # sign to indicate that the connection was successful.
$ adb shell
#
Key ADB Device Commands
The commands listed in Table 8-1 help to transfer the debuggee application onto the target device or emulation from the command line. This can be very helpful, especially if no ssh terminal connection is available.
More details on ADB setup and usage can be found at http://developer.android.com/guide/developing/tools/adb.html .
Using the Android Debug Tools Plug-in for Eclipse
For devices based on Intel architecture, the setup process does not vary significantly from what is described at http://developer.android.com/sdk/eclipse-adt.html#installing . The Android Debug Tools (ADT) plug-in provides full Eclipse IDE integrated application debug for emulators based on Intel architecture as well as target devices. It provides two different debug perspectives with different feature sets. You can switch between either one as needed and they both provide different strengths when debugging applications.
The Debug Perspective in Eclipse
The Debug Perspective in Eclipse, shown in Figure 8-11, gives you access to the following tabs:
-
Debug. Displays previously and currently debugged Android applications and its currently running threads.
-
Variables. When breakpoints are set, displays variable values during code execution.
-
Breakpoints. Displays a list of the set breakpoints in your application code.
-
LogCat. Allows you to view system log messages in real time. The LogCat tab is also available in the DDMS perspective.

Debug Perspective in Eclipse
You can access the Debug Perspective by clicking Window ➤ Open Perspective ➤ Debug. Refer to the appropriate documentation for the Eclipse debugger for more information.
The DDMS Perspective
The DDMS Perspective in Eclipse, shown in Figure 8-12, lets you access all of the features of DDMS from within the Eclipse IDE. The following sections of DDMS are available to you:
-
Devices. Shows the list of devices and AVDs that are connected to ADB.
-
Emulator Control. Lets you carry out device functions.
-
LogCat. Lets you view system log messages in real time.
-
Threads. Shows currently running threads within a VM.
-
Heap. Shows heap usage for a VM.
-
Allocation Tracker. Shows the memory allocation of objects.
-
File Explorer. Lets you explore the device’s file system.

DDMS Perspective in Eclipse
Application Runtime Environment for Debugging
The difference when debugging an Android application targeted for a device based on Intel architecture comes in when setting up the debug target device.
Selecting the target device using the Android Virtual Device Manager that is part of the Android SDK, you go to Window ➤ AVD Manager in the Eclipse IDE’s pull-down menu. There you need to make sure to select Intel Atom (x86) as the EABI target for the OS image and the device emulation (see Figure 8-13).

Selection of a Device Based on the Intel Atom Processor in Android Virtual Device Manager
If you followed the steps outlined at the beginning of the chapter for setting up ADB and establishing a debug bridge to a physical device, you will see a device chooser entry in the Eclipse IDE from which you can pick the target for application deployment and debug.
Otherwise, debugging an Android application targeted for Intel architecture is not different from debugging an Android application that targets ARM architecture.
Intel Hardware Accelerated Execution Manager
The Intel Hardware Accelerated Execution Manager (HAXM) is a hardware-assisted virtualization engine (hypervisor) that uses Intel Virtualization Technology (VT) to speed up Android app emulation on a host machine. In combination with Android x86 emulator images provided by Intel and the official Android SDK Manager, Intel HAXM allows for faster Android emulation on Intel VT–enabled systems. For more information on installing and using Intel HAXM, refer to Chapter 11: Using Intel Hardware Accelerated Execution Manager to Speed-up Android on x86 Emulation.
The x86 Android 4.0.4 (Ice Cream Sandwich) emulator system image enables you to run an emulation of Android on your development machine. In combination with the Android SDK, you can test your Android applications on a virtual Android device based on Intel architecture, thereby taking full advantage of the underlying Intel architecture and Intel Virtualization Technology.
In order to install the emulator system image, you use the Android SDK Manager.
Intel HAXM can be installed through the Android SDK Manager (see Figure 8-14). Intel HAXM requires the Android SDK to be installed (version 17 or higher). For more information, refer to the Android developer web site ( http://developer.android.com/sdk/ ).

Intel Hardware Accelerated Execution Manager Download
Intel HAXM is available for Linux, Windows, and OS X host operating systems. As an example we outline the installation on Ubuntu 64-bit OS, as this is Google’s main validated and supported platform for Android builds.
The next section contains the quick steps for how to install KVM, enable it on the Ubuntu host platform, and start the Intel Android x86 emulator with Intel hardware-assisted virtualization (hypervisor). When the AVD takes advantage of Intel HAXM, the operating system will run significantly faster and smoother than without hypervisor.
KVM Installation
-
1.
To see if your processor supports hardware virtualization, you can review the output from this command:
$ egrep -c '(vmx|svm)' /proc/cpuinfo
If this command returns 0, your CPU doesn’t support hardware virtualization.
-
2.
Next, install CPU checker:
$ sudo apt-get install cpu-checker
-
3.
Now you can check if your CPU supports KVM:
$kvm-ok
-
a.
If you see:
"INFO: Your CPU supports KVM extensions
INFO: /dev/kvm exists
KVM acceleration can be used"
you can run your virtual machine faster with the KVM extensions.
-
b.
If you see:
"INFO: KVM is disabled by your BIOS
HINT: Enter your BIOS setup and enable Virtualization Technology (VT),
and then hard poweroff/poweron your system
KVM acceleration can NOT be used"
you will need to go to BIOS setup and enable Intel VT.
Using a 64-Bit Kernel
Running a 64-bit kernel on the host operating system is recommended but not required. To serve more than 2GB of RAM for your VMs, you must use a 64-bit kernel. On a 32-bit kernel install, you’ll be limited to 2GB RAM at maximum for a given VM. Also, a 64-bit system can host both 32-bit and 64-bit guests. A 32-bit system can only host 32-bit guests.
-
1.
To see if your processor is 64-bit, you can run this command:
$ egrep -c ' lm ' /proc/cpuinfo
If 0 is printed, it means that your CPU is not 64-bit. If 1 or higher is printed, it is. Note: lm stands for long mode, which equates to a 64-bit CPU.
-
2.
To see whether your running kernel is 64-bit, just issue the following command:
$ uname -m
The return value x86_64 indicates a running 64-bit kernel. If you see i386, i486, i586, or i686, you’re running a 32-bit kernel.
Install KVM
To install KVM, follow these steps:
-
1.
For Ubuntu 12.04 or later:
$ sudo apt-get install qemu-kvm libvirt-bin ubuntu-vm-builder bridge-utils
You can ignore the Postfix Configuration request shown in Figure 8-15 by selecting No Configuration.

KVM Install Postfix Configuration Settings
-
2.
Next, add your <username> account to the group kvm and libvirtd:
$ sudo adduser your_user_name kvm
$ sudo adduser your_user_name libvirtd
After the installation, you need to log in again so that your user account becomes an active member of the kvm and libvirtd user groups. The members of this group can run virtual machines.
To verify installation, you can test whether your install has been successful with the following command:
$ sudo virsh -c qemu:///system list
Starting the Android Virtual Device
The Android for x86 Intel Emulator (see Figure 8-16) can be started using the following command:
$ <SDK directory>/tools/emulator-x86 -avd Your_AVD_Name -qemu -m 2047 -enable-kvm
with Your_AVD_Name being a name of your choice; -qemu provides the options to qemu, and -m specifies the amount of memory for the emulated Android (that is, guest). If you use too small a value for your memory, it is possible that performance will suffer because of frequent swapping activities.

AVD Running Android in the Intel Architecture Emulation Layer
Using AVD Manager in Eclipse to Launch a Virtual Device
The following steps are recommended by Google to start debugging an application using AVD from within the Eclipse IDE:
-
1.
In Eclipse, click your Android project folder and then select Run ➤ Run Configurations.
-
2.
In the left panel of the Run Configurations dialog, select your Android project run configuration or create a new configuration.
-
3.
Click the Target tab.
-
4.
Select the Intel architecture–based AVD you created previously.
-
5.
In the Additional Emulator Command Line Options field, enter:
-qemu -m 2047 -enable-kvm
-
6.
Run your Android project using this run configuration.
Running Android Within Oracle VirtualBox
Running a full Android OS image on a desktop PC inside an Oracle VirtualBox virtual machine can be a valuable alternative to KVM and QEMU on Windows host systems, especially for those developers looking to develop and debug native code on Android.
In this section, we share some details about:
-
Building the Android 4.0.x VirtualBox installer for x86 from the official Google x86 VirtualBox target vbox-x86-eng (included in Android 4.0.1 source tree).
-
Using a Linux 2.6 kernel provided by Intel to add specific features for VirtualBox.
-
How to use installer.vdi to install Android ICS 4.0 into VirtualBox.
In addition to Google’s AVD emulator supported by Intel Hardware Accelerated Execution Manager (Intel HAXM) technology, Android for x86 VirtualBox is running a true virtualized Intel architecture–based environment. It thus provides another fast, high-performance tool for developers and partners for quick application development and testing. Booting Android 4.0.x in VirtualBox on a typical Intel Core i5 host system takes about 10 seconds. Speed, performance, and user experience account for the popularity of VirtualBox among Android developers, especially when targeting platforms based on Intel architecture. Availability of Android tablets and smartphones on the market based on Intel architecture is still somewhat limited, and it can be more convenient to start development using a virtual environment on the development host system instead of relying on USB debug communication. Especially with both the development host and the Android target device based on Intel architecture, this becomes a valid and interesting alternative.
Google x86 VirtualBox Build Targets for Android 4.x
If you have been using Google’s Android 4.0.x source repository before, you probably noticed that Google provides an x86 version of the VirtualBox target vbox_x86-eng. Using the lunch command before starting the build, the first three targets that Google provides for Android 4.0.x are:
$ lunch
1. full-eng
2. full_x86-eng
3. vbox_x86-eng
With the vbox_x86-eng (#3) target, application developers and system developers alike can create android_disk.vdi and android installer.vdi packages. These can then be used to run Android 4.x inside VirtualBox for application development and system integration on Windows, Linux, and OS X.
Downloading the Source Tree and Installing the Repository
To install, initialize, and configure the repository, follow these steps (you can find more information at http://source.android.com/source/downloading.html ):
$ mkdir ∼/bin
$ PATH=∼/bin:$PATH
$ curl https://dl-ssl.google.com/dl/googlesource/git-repo/repo > ∼/bin/repo
$ chmod a+x ∼/bin/repo
$ mkdir ANDROID_TOP_PATH
$ cd ANDROID_TOP_PATH
To get a list of available branches (from your Android repository checkout root), use this command:
$ git --git-dir .repo/manifests/.git/ branch –a
Run repo init to obtain a current list of the available repository sub-branches with all the most recent updates:
$ repo init -u https://android.googlesource.com/platform/manifest -b android-4.0.1_r1
To use the Gerrit code-review tool, you will need an e-mail address that is connected to a registered Google account. Make sure this is a live address at which you can receive messages. The kernel version and build number will be assigned to your build, and information will be displayed on the Android/Settings/About Phone/ page.
A successful initialization will end with a message stating that Repo is initialized in your working directory. Your client directory should now contain a .repo directory where files such as the manifest are stored.
To pull down files to your working directory from the repositories, as specified in the default manifest, run
$ repo sync
By default, access to the Android source code is anonymous. To protect the servers against excessive usage, each IP address is associated with a quota.
Building a Custom Kernel with Mouse Support
Since Android is meant for touch screen devices, it doesn’t include support for a mouse pointer by default. Additionally it may not include a driver for hardwired Ethernet support, as most Android devices are exclusively using wireless radios for network communication. To add these capabilities, you need to rebuild the kernel with mouse support as well as any additional features that you require. To do so, follow these steps:
-
1.
Download the Android x86 Emulator Image add-on through the Android SDK Manager.
-
2.
Create a new folder and untar kernel_sdk_x86.tar.gz into it to create a folder with the kernel source tree.
-
3.
Switch to the directory that holds your kernel files.
-
4.
Now that you have the kernel source, the configuration needs to be modified to match the hardware being used as the VirtualBox host system and rebuilt. The menuconfig graphical user interface provided by the kernel sources will allow to do this conveniently:
$ cp ANDROID_TOP_PATH/your_kernel_path/arch/x86/configs/vbox_defconfig .config
$ make CC=gcc-4.4 CXX=g++-4.4 ARCH=x86 menuconfig
This will take a few seconds to compile and load. Once it does load, you can use
-
Up/Down arrows to navigate
-
Enter to select (to expand)
-
Y (or space) to include
To enable mouse support, navigate to Device Driver ➤ Input Device Support ➤ Mice.
Note
menuconfig can be used to ensure that all features required to support your application or system integration are available. For application developers, it is equally important to test and validate the application on default Android builds. Only then can maximum compatibility with Android devices from multiple different device manufacturers be guaranteed.
Having made the necessary change to the kernel configuration, you can now compile it. It doesn’t take too long, so I picked a low –j value. It is important to note that if you omit the CC and CCX parameters, the compile will terminate prematurely (on this setup), without an explicit error, as it will use version 4.6.
$ make CC=gcc-4.4 CXX=g++-4.4 ARCH=x86 –j8
The –j parameter provides the number of available cores for compilation. This example assumes a quad-core system with Intel Hyper-Threading Technology enabled.
After the build is completed successfully, the last line of the build log will say
Kernel: arch/x86/boot/bzImage is ready
Add Patched Kernel
The kernel image bzImage needs to be renamed to kernel-vbox and copied to /ANDROID_TOP_PATH/prebuilt/android-x86/kernel/kernel-vbox:
$ cp /ANDROID_TOP_PATH/kernel/arch/x86/boot/bzImage/ANDROID_TOP_PATH/prebuilt/android-x86/kernel/kernel-vbox
Reduce Compile Time Using CCACHE
You can greatly reduce the compile time for subsequent compilations by using the compiler cache. To set up a 50GB cache, do the following:
-
1.
Install the CCcache program and create a directory for your ccache:
$ sudo apt-get install ccache
$ sudo mkdir /ANDROID_TOP_PATH/ccache
$ sudo chown $LOGNAME /ANDROID_TOP_PATH/ccache
-
2.
Set up your environment variables for ccache support by modifying ∼/.bashrc:
$ sudo gedit ∼/.bashrc
-
3.
Add the following:
export CCACHE_DIR=/ANDROID_TOP_PATH/ccache
export USE_CCACHE=1
-
4.
Set the ccache sizes.
$ ccache -F 100000
$ ccache -M 50G
Build Android 4.0.x with New Kernel
To set up the environment:
$ /ANDROID_TOP_PATH/> source build/envsetup.sh
For ICS 4.0.1, you will see:
including device/samsung/maguro/vendorsetup.sh
including device/samsung/tuna/vendorsetup.sh
including device/ti/panda/vendorsetup.sh
including sdk/bash_completion/adb.bash
To ensure you pick a valid target when using the lunch command, it is convenient to simply do the following:
$ lunch
and pick the desired target from the list:
1. full-eng
2. full_x86-eng
3. vbox_x86-eng
4. full_maguro-userdebug
5. full_tuna-userdebug
6. full_panda-eng
Which would you like? [full-eng]
Note
Make sure you select 3. vbox_x86-eng.
PLATFORM_VERSION_CODENAME=REL
PLATFORM_VERSION=4.0.1
TARGET_PRODUCT=vbox_x86
TARGET_BUILD_VARIANT=eng
TARGET_BUILD_TYPE=release
TARGET_BUILD_APPS=
TARGET_ARCH=x86
TARGET_ARCH_VARIANT=x86
HOST_ARCH=x86 HOST_OS=linux
HOST_BUILD_TYPE=release
BUILD_ID=ITL41D
Run make:
$ make -j8
Build the VirtualBox Disk and Android Installer
Finally, build the Android_disk.vdi and installer_vdi together:
$ make android_disk_vdi installer_vdi -j8
If the build is successful, you will see this output in the build log:
Done with VirtualBox bootable disk image -[ out/target/product/vbox_x86/android_disk.vdi ]-
Done with VirtualBox bootable installer image -[ out/target/product/vbox_x86/installer.vdi ]-
With android_disk.vdi, you can select New ➤ Create New Virtual Machine in VirtualBox. You can use android_disk.vdi as an existing disk image to base the virtual machine on, which will now automatically boot Android 4.0.x.
Setting up the start parameters for VirtualBox is straightforward. Go to Settings ➤ About This Phone to see the build information shown in Figure 8-17.

Android 4.0.x Build Information Inside Oracle VirtualBox
Using an Android Installer Disk to Create a Large Virtual Partition
Even if the file size in VirtualBox is expanded to 550MB, it is still too small to load applications for testing. An Android installer disk is needed to install Android into a much larger partition (preferably larger than 4GB).
First select Machine ➤ New from the VirtualBox menu bar and use the Create New Virtual Machine Wizard to create a larger disk under the IDE controller configuration entry.
Then in Settings ➤ Storage of your virtual machine, add the installer.vdi as the primary IDE slave, as shown in Figure 8-18. Now you can install Android on the 4GB hard disk you just created.

Configuring Storage Settings for Virtual Machine
-
1.
Start the emulator.
-
2.
Use F12 to get to the BIOS boot menu. Boot to the secondary drive.
-
3.
Use grub to select the Install option: 2. Boot from the primary slave (see Figure 8-19).

Booting Installer Image Inside VirtualBox
When you see Done processing installer config, type reboot.
Note
The first time you install on your target virtual disk, the install may fail. A message will be printed that tells you to run the installer again. Do so by using the following command:
$ installer
After reboot, you can see that your Android is running from the larger disk that you create, and you can safely remove installer.vdi from storage under the VirtualBox IDE controller settings.
Serial Port
Serial port support in the virtual machine is enabled by default. However, the COM1 serial port needs to be initialized and configured before it can be used. The following instructions cause VirtualBox to create a named pipe called .vbox_pipe in your home directory. On the command line, enter:
$ VBoxManage modifyvm Android --uart1 0x03f8 4
$ VBoxManage modifyvm Android --uartmode1 server /home/user/.vbox_pipe
Alternatively from in the VirtualBox GUI, use the Serial Ports tab in the Virtual Machine Settings menu to enable COM1 as a host pipe. Select Create Pipe for it to be created as /home/user/.vbox_pipe.
To connect to this named pipe, use:
$ socat unix-client:$HOME/.vbox_pipe stdout
Note
VirtualBox might not understand environment variables (such as $HOME), so you will have to specify a full explicit path, such as /home/user/.vbox_pipe.
Ethernet
The Ethernet port (eth0) is enabled for DHCP in the image. To connect to it via ADB, you will need to look up the DHCP address that has been assigned.
If you are using a bridged ethernet, you may obtain this address from a shell prompt, either from the serial port or from Developer Tools ➤ Terminal Emulator using this command:
$ netcfg
If you are using a host-only adapter, vboxnet0, you should use the address 192.168.56.101.
Final Notes
Now you have a VirtualBox image running Android 4.0.x completely built from Google’s official vbox-x86 target (see Figure 8-20).

Android OS Fully Booted Inside the VirtualBox Virtual Machine
Debugging with GDB, the GNU Project Debugger
The Android NDK includes the GDB, the GNU debugger, which allows you to start, pause, examine, and alter a program. On Android devices and more generally on embedded devices, GDB is configured in client/server mode. The program runs on a device as a server and a remote client. The developer’s workstation connects to it and sends debugging commands similar to a local application. GDB itself is a command-line utility. You’ll first look at its basic usage model before looking at the Eclipse CDT integration.
When debugging with GDB, gdbserver running on the device handles debug communication. However, you still might be using an underlying USB-to-Ethernet dongle driver with ADB to communicate to the transport layer on which gdbserver communicates via TCP/IP with GDB running on the development host.
There is a gdbclient application that sets up the debug communication environment and launches gdbserver on the debuggee device.
usage: gdbclient EXECUTABLE :PORT [PROG_PATH]
EXECUTABLE executable name (default app_process)
PORTcommection port (default :1234)
PROG_PATHexecutable full path on target (ex /system/bin/mediaserver)
If PROG_PATH is set, gdclient tries to launch gdbserver and attach it to the running PROG_PATH.
To launch gdbserver explicitly, you use the following command:
# gdbserver :1234 --attach 269
Attached; pid = 269
Listening on port 1234
The step-by-step debug session launch instructions that follow illustrate how ADB is still underlying the debug communication even if GDB (not ADT or DDMS) is used for debugging. Assume that port 1234 is being used.
The lunch process is as follows:
gdbserver :1234 /system/bin/executable
To attach to an existing process:
gdbserver :1234 --attach pid
On your workstation, forward port 1234 to the device with adb:
adb forward tcp:1234 tcp:1234
Start a special version of gdb that lives in the “prebuilt” area of the source tree:
prebuilt/Linux/toolchain-eabi-4.x.x/bin/i686-android-linux-gdb (for Linux) or
prebuilt/darwin-x86/toolchain-eabi-4.x.x/bin/i686-android-linux-gdb (for Darwin).
If you can’t find either special version of GDB, run this
$find prebuilt –name i686-android-linux-gdb
in your source tree to find and run the latest version. Make sure to use the copy of the executable in the symbols directory, not the primary Android directory, because the one in the primary directory has been stripped of its symbol information.
In GDB, tell GDB where to find the shared libraries that will be loaded:
set solib-absolute-prefix /absolute-source-path/out/target/product/product-name/symbols
set solib-search-path /absolute-source-path/out/target/product/product-name/symbols/system/lib
The path to your source tree is absolute-source-path. Make sure you specify the correct directories—GDB might not tell you if you make a mistake. Connect to the device by issuing the gdb command:
(gdb) target remote :1234
The :1234 tells GDB to connect to the localhost port 1234, which is bridged to the device by ADB.
Now you can start debugging native C/C++ code running on Android with GDB the same way you are used to. If you also have Eclipse installed, which you probably do if you are using the Android SDK for Dalvik/Java-based application development, Eclipse and the GDB integration of Eclipse can be used directly to add breakpoints and inspect a program.
Indeed, using Eclipse, you can insert breakpoints easily in Java as well as in C/C++ source files. You simply clicking in the left margin of the text editor. Java breakpoints work out of the box thanks to the ADT plug-in, which manages debugging through the Android Debug Bridge. This is not true for CDT, which is, of course, not Android-aware. Thus, inserting a breakpoint will do nothing unless you configure CDT to use the NDK’s GDB, which itself needs to be bound to the native Android application in order to debug it. First, enable debugging mode in the application by following these steps:
-
1.
An important thing to do, but something that is really easy to forget, is to activate the debugging flag in your Android project. This is done in the application manifest AndroidManifest.xml. Do not forget to use the appropriate SDK version for native code:
<?xml version="1.0" encoding="utf-8"?> <manifest ...> <uses-sdk android:minSdkVersion="10"/> <application ... android:debuggable="true"> ...
-
2.
Enable the debug flag in the manifest. This automatically activates debug mode in native code. However, the APP_OPTIM flag also controls debug mode. If it has been manually set in Android.mk, then check that its value is set to debug (and not release) or simply remove it:
APP_OPTIM := debug
-
3.
Now configure the GDB client that will connect to the device. Recompile the project and plug your device in or launch the emulator. Run and leave your application. Ensure the application is loaded and its PID is available. You can check it by listing processes using the following command (use Cygwin in Windows):
$ adb shell ps |grep gl2jni
One line should be returned:
app_75 13178 1378 201108 68672 ffffffff 80118883 S com.android.gl2jni
-
4.
Open a terminal window and go to your project directory. Run the ndk-gdb command (located in the Android NDK folder, for example android-ndk-r8\):
$ ndk-gdb
This command should not return a message, but will create three files in the obj\local\x86 directory:
-
gdb.setup. This is a configuration file generated for GDB client.
-
app_process. This file is retrieved directly from your device. It is a system executable file, launched when the system starts up and forked to start a new application. GBD needs this reference file to find its marks. In some ways, it is the binary entry point of your app.
-
libc.so. This is also retrieved from your device. It is the Android standard C library (commonly referred as bionic) used by GDB to keep track of all the native threads created during runtime.
-
5.
In your project directory, copy obj\local\x86\gdb.setup and name it gdb2.setup. Open it and remove the following line, which requests the GDB client to connect to the GDB server running on the device (to be performed by Eclipse):
(gdb) target remote :1234
-
6.
In the Eclipse main menu, go to Run | Debug Configurations and create a new debug configuration in the C/C++ application item called GL2JNIActivityDefault. This configuration will start the GDB client on your computer and connect to the GDB server running on the device.
-
7.
In the Main tab (see Figure 8-21), set the project to your own project directory. Set the C/C++ application to point to obj\local\ x86\app_process using the Browse button (you can use an absolute or relative path).

Debug Configurations for C/C++ Application
-
8.
Switch the launcher type to Standard Create Process Launcher (see Figure 8-22) using the link Select Other link at the bottom of the window.

Select Preferred Launcher
-
9.
Go to the debugger file and set the debugger type to gdbserver. Set the GDB debugger to android-ndk-r8\toolchains\x86-4.4.3\prebuilt\windows\bin\i686-android-linux-gdb.exe. The GDB command file (see Figure 8-23) needs to point to the gdb2.setup file located in \obj\local\x86 (you can use an absolute or relative path).

Debugger Setting Panel
-
10.
Go to the Connection tab (see Figure 8-24) and set Type to TCP. Keep the default values for hostname or IP address and port number (localhost, 5039).

Connection Settings on the Debugger Setting Panel
-
11.
Now, let’s configure Eclipse to run a GDB server on the device. Make a copy of android-ndk-r8\ndk-gdb and open it with a text editor. Find the following line:
$GDBCLIENT -x 'native_path $GDBSETUP'
Comment it out because GDB client is going to be run by Eclipse itself:
#$GDBCLIENT -x 'native_path $GDBSETUP'
-
12.
In the Eclipse main menu, go to Run | External Tools | External Tools | Configurations (see Figure 8-25), and create a new configuration GL2JNIActivity_GDB. This configuration will launch GDB server on the device.
Figure 8-25. 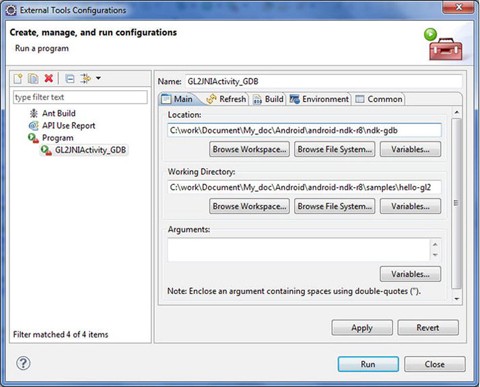
External Tools Configurations
-
13.
On the Main tab, set the Location pointing to the modified ndk-gdb in android-ndk-r8. Set the working directory to your application directory location. Optionally, set the Arguments text box:
-
Verbose: To see in detail what happens in the Eclipse console.
-
Force: To automatically kill any previous session.
-
Start: To let the GDB server start the application instead of getting attached to the application after it has been started. This option is interesting if you debug native code only and not Java.
-

-
14.
Now, launch your application as usual.
-
15.
Once the application starts, you could launch ndk-gdb by console directly or launch the external tool configuration GL2JNIActivity_GDB, which is going to start the GDB server on the device. The GDB server receives debug commands sent by the remote GDB client and debugs your application locally.
-
16.
Open jni\gl_code.cpp and set a breakpoint (see Figure 8-26) in setupgraphics by double-clicking the left margin of the text editor (or right-clicking and selecting Toggle Breakpoint).

Setting Breakpoints
-
17.
Finally, launch the GL2JNIActivity default C/C++ application configuration to start the GDB client. It relays debug commands from Eclipse CDT to the GDB server over a socket connection. From the developer’s point of view, this is almost like debugging a local application.
The Intel Graphics Performance Analyzer (Intel GPA)
There are also some specific tools for debugging graphics performance. The Intel GPA System Analyzer is one of the Intel Graphics Performance Analyzers (GPA) with new support for Intel-based Android devices, and is intended for application and driver engineers to optimize their OpenGL ES workloads.
This section provides instructions for how to configure and use Intel GPA with your Android device over a USB connection. When connected to an Android device, the Intel GPA System Analyzer provides OpenGL ES API, CPU, and GPU performance metrics, and also provides multiple graphics pipeline state overrides to aid with your analysis of OpenGL ES application performance.
To use the Intel GPA System Analyzer on Android x86-based devices, you need to check the target machine and firmware version from the document.
To start collecting metrics, you need to install the Intel GPA System Analyzer on the client system and connect it to the target device:
-
1.
Install Intel GPA 2013 on the Windows/Linux client machine.
-
2.
Launch the Intel GPA System Analyzer.
-
3.
Make sure that the Android device(s) is connected to the client system using a USB cable.
-
4.
Wait up to 10 seconds while your client system is detecting the target device(s). Found devices appear in the window. The list of the target devices refreshes every five to six seconds.
-
5.
Find the device you want to connect to and click Connect (see Figure 8-27). The Intel GPA System Analyzer will copy the required components to the target device and generate the list of installed applications. You can interrupt the connection process by clicking Stop.

Select the Connected Device
-
6.
Select the desired application from the list of available ones. The Application List screen (see Figure 8-28) displays all user and system applications installed on the Android device.

Applications List
-
7.
The application will be launched and you will see its data in the Intel GPA System Analyzer window.
-
8.
To switch to a different application, click Back. Note that the running application will be forced to close.
-
9.
To switch to a different target device, click Back. The PowerVR graphics architecture consists of the following core modules that convert the submitted 3D application data into a rendered image—Tile Accelerator (TA), Image Synthesis Processor (ISP), and the Texture & Shading Processor (TSP). Intel GPA metrics in the “GPU” group correspond to one of these core modules, and the order of metrics in the Metrics List depends on the order of the core modules in the graphics pipeline (see Figure 8-29).

Intel GPA System Analyzer Window
System Debug of Android OS Running on an Intel Atom Processor
Until now this chapter has focused on developing and debugging applications, whether they use Android’s Java runtime alone or run natively as x86 Intel Architecture binaries and shared objects.
For the system integrator and device manufacturer it might be necessary to work on the device driver and system software stack layer as well. This is especially true if additional platform-specific peripheral device support needs to be implemented or if the first operating system port to a new Intel Atom processor-based device is undertaken.
In the following chapters, you’ll look at the Joint Test Action Group IEEE 1149.1 (JTAG) standard-based debug solutions for this purpose as well as architectural differences between the ARM and Intel architectures that can impact system-level debugging.
JTAG Debugging
For true firmware, operating system-level, and device driver debugging, the most commonly used method in the world is using a JTAG debug interface. Historically speaking, the Joint Test Action Group was formed by industry leaders in the 1980s to define a standard for testing access ports and printed circuit boards. The IEEE adopted their standard in the 1990s as the IEEE 1149.1 Standard Test Access Port and Boundary-Scan Architecture. For the sake of brevity, the testing standard is usually referred to as JTAG. From its original use for circuit board testing, it has developed into the de facto interface standard for OS-independent and OS-level platform debugging.
More background information on JTAG and its usage in modern system software stack debugging is available in the article, “JTAG 101; IEEE 1149.x and Software Debug” by Randy Johnson and Stewart Christie (see http://www.intel.com/content/www/us/en/intelligent-systems/jtag-101-ieee-1149x-paper.html ).
From the OEM’s perspective and that of their partner application and driver developers, understanding the interaction between the driver and software stack components running on the different parts of the system-on-chip (SoC) integrated intelligent system or smartphone form factor device is critical for determining platform stability. From a silicon validator’s perspective, the low-level software stack provides the test environment that emulates the kind of stress factors the platform will be exposed to in real-world use cases. In short, modern SoCs require understanding the complete package and its complex real-world interactions, not just positive unit test results for individual hardware components. This is the level of insight a JTAG-based system software debug approach can provide. This can be achieved by merging the in-depth hardware awareness JTAG inherently provides with the ability to export state information of the Android OS running on the target.
Especially for device driver debug, it is important to understand both the exact state of the peripheral device on the chipset and the interaction of the device driver with the OS layer and the rest of the software stack.
If you are looking at Android from the perspective of system debugging—looking at device drivers and the OS kernel—it is really just a specialized branch of Linux. Thus it can be treated like any 2.6.3x or higher Linux.
The Intel Atom processor Z2460 supports IEEE-1149.1 and IEEE-1149.7 (JTAG) Boundary Scan and MPI Parallel Trace Interface (PTI), as well as Branch Trace Storage (BTS)-based instruction tracing through Intel’s JTAG-compliant eXtended Debug Port (XDP).
Various JTAG vendors offer system debug solutions with Android support, including the following:
-
Wind River ( http://www.windriver.com/products/JTAG-debugging/ )
-
Lauterbach ( http://www.lauterbach.com )
-
Intel ( http://software.intel.com/en-us/articles/embedded-using-intel-tools )
Android OS Debugging,
What complicates debugging an Android-based platform is that Android aggressively takes advantage of low power idle states and sleep states to optimize for power consumption. Thus the real challenge becomes debugging through low power states and either maintaining JTAG functionality through some of the low power states or, when this is not possible, reattaching JTAG as soon as the chipset power domain for JTAG is re-enabled.
Many OS-level issues on these types of platforms tend to center around power mode changes and sleep/wake-up sequences.
A system debugger, whether debug agent-based or using a JTAG device interface, is a very useful tool to help satisfy several of the key objectives of OS development.
The debugger can be used to validate the boot process and to analyze and correct stability issues like runtime errors, segmentation faults, or services not being started correctly during boot.
It can also be used to identify and correct OS configuration issues by providing detailed access and representations of page tables, descriptor tables, and instruction trace. The combination of instruction trace and memory table access can be a very powerful tool to identify the root causes for stack overflow, memory leak, or even data abort scenarios.
Figure 8-30 shows the detailed access to page translation attributes and descriptor tables as provided by the Intel JTAG debugger. With the high level of flexibility that is available on x86 in defining the depth of translation tables and granularity of the addressed memory blocks, this level of easy access and visibility of the memory layout becomes even more important for system development on the OS level.

Example of Debugger Views for Memory Configuration
This highlights two key differences between developing and configuring the Android OS software stack on Intel architecture and many other architectures. The selector base and offset addressing model—combined with the local descriptor table (LDT) and global descriptor table (GDT)—allow for deep, multilayered address translation from physical to virtual memory with variable address chunk granularity as well. This is a powerful capability for custom memory configuration in a compartmentalized environment with protected isolated memory spaces. If used incorrectly it can, however, also increase memory access times.
One other difference between Intel architecture and others is handling system interrupts. On ARM, for instance, you have a predefined set of hardware interrupts in the reserved address space from 0x0 through 0x20. These locations then contain jump instructions to the interrupt handler. On Intel architecture, a dedicated hardware interrupt controller is employed. The hardware interrupts are not accessed directly through memory space, but by accessing the Intel 8529 interrupt controller. The advantage of this approach is that the interrupt handler already allows for direct handling of I/O interrupts for attached devices. In architectures that don’t use a dedicated interrupt controller, the IRQ interrupt usually has to be overloaded with a more complex interrupt handler routine to accomplish this.
Device Driver Debugging
A good JTAG debugger solution for OS-level debugging should furthermore provide visibility of kernel threads and active kernel modules along with other information exported by the kernel. To allow for debugging dynamically loaded services and device drivers, a kernel patch or a kernel module that exports the memory location of a driver’s initialization method and destruction method may be used.
Especially for system configuration and device driver debugging, it is also important to be able to directly access and check the contents of device configuration registers. The concept of bitfield editors, shown in Figure 8-31, can be very useful for this. A bitfield editor is a bitwise visualization of SoC device registers that allows monitoring changes to a device state in real time while the associated device driver is interacting with it.

Device Register Bitfield Editor View
Analyzing the code after the Android-compressed zImage kernel image has been unpacked into memory is possible by simply releasing run control in the debugger until start_kernel is reached. This implies that the vmlinux file that contains the kernel symbol information has been loaded. At this point the use of software breakpoints is possible. Prior to this point in the boot process, only breakpoint-register–based hardware breakpoints should be used, to avoid the debugger attempting to write breakpoint instructions into uninitialized memory. The operating system is then successfully booted once the idle loop mwait_idle has been reached.
Additionally, if your debug solution provides access to Branch Trace Store (BTS) based instruction trace, this capability can, in conjunction with all the regular run control features of a JTAG Debugger, be used to force execution stop at an exception. You can then analyze the execution flow in reverse to identify the root cause of the runtime issues.
Hardware Breakpoints
Just as on ARM architecture, processors based on Intel architecture support breakpoint instructions for software breakpoints as well as hardware breakpoints for data and code. On ARM architecture, you usually have a set of dedicated registers for breakpoints and data breakpoints (called watchpoints). The common implementation tends to provide two of each. When these registers contain a value, the processor checks against accesses to the set memory address by the program counter register or a memory read/write. As soon as the access happens, execution is halted. This is different from software breakpoints in that their execution is halted as soon as a breakpoint instruction is encountered. Since the breakpoint instruction replaces the assembly instruction that would normally be at a given memory address, the execution effectively halts before the instruction that normally would be at the breakpoint location is executed.
The implementation of hardware breakpoints on Intel architecture is very similar to that on ARM, although it is a bit more flexible.
On all Intel Atom processor cores, there are four DR registers that store addresses, which are compared against the fetched address on the memory bus before (sometimes after) a memory fetch.
You can use all four of these registers to provide addresses that trigger any of the following debug run control events:
-
00. Break on instruction execution
-
01. Break on data write only
-
10. Undefined OR (if architecture allows it) break on I/O reads or writes
-
11. Break on data reads or writes but not instruction fetch
Thus, all four hardware breakpoints can be used as breakpoints or watchpoints. Watchpoints can be write-only or read-write (or I/O).
Cross-Debug: Intel Atom Processor and ARM Architecture
Many developers targeting the Intel Atom processor have experience developing primarily for RISC architectures with fixed instruction length. MIPS and ARM are prime examples of ISAs with fixed lengths. In general, the cross-debug usage model between an Intel Atom processor and ARM architecture processor is very similar. Many of the conceptual debug methods and issues are the same.
Developing on an Intel architecture-based development host for an Intel Atom processor target does, however, offer two big advantages, especially when the embedded operating system of choice is a derivative of one of the common standard operating systems like Linux or Windows. The first advantage is the rich ecosystem of performance, power analysis, and debug tools available for the broader software development market on Intel architecture. The second advantage is that debugging functional correctness and multithreading behavior of the application may be accomplished locally. This advantage will be discussed later in the chapter.
There are a few differences between Intel Atom processors and ARM processors that developers should know. These differences are summarized in the next two subsections.
Variable Length Instructions
The IA-32 and Intel 64 instruction sets have variable instruction lengths. The debugger cannot just inspect the code in fixed 32-bit intervals, but must interpret and disassemble the machine instructions of the application based on the context of these instructions. The location of the next instruction depends on the location, size, and correct decoding of the previous one. In contrast, on ARM architecture all the debugger needs to monitor is the code sequence that switches from ARM mode to Thumb mode or enhanced Thumb mode and back. Once in a specific mode, all instructions and memory addresses are 32-bit or 16-bit in size. Firmware developers and device driver developers who need to precisely align calls to specific device registers and may want to rely on understanding the debugger’s memory window printout should understand the potential impact of variable length instructions.
Hardware Interrupts
One other architectural difference that may be relevant when debugging system code is how hardware interrupts are handled. On ARM architecture the following exception vectors are mapped from address 0x0 to address 0x20:
-
0. Reset
-
1. Abort
-
2. Data Abort
-
3. Prefetch Abort
-
4. Undefined Instruction
-
5. Interrupt (IRQ)
-
6. Fast Interrupt (FIRQ)
This memory area is protected and cannot normally be remapped. Commonly, all of the vector locations at 0x0 through 0x20 contain jumps to the memory address where the real exception handler code resides. For the reset vector that implies that at 0x0 will be a jump to the location of the firmware or platform boot code. This approach makes the implementation of hardware interrupts and OS signal handlers less flexible on ARM architecture, but also more standardized. It is easy to trap an interrupt in the debugger by simply setting a hardware breakpoint at the location of the vector in the 0x0 through 0x20 address range.
On Intel architecture, a dedicated hardware interrupt controller is employed. The following interrupts cannot be accessed directly through the processor memory address space, but are handled by accessing the Intel 8259 Interrupt Controller:
-
0. System timer
-
1. Keyboard
-
2. Cascaded second interrupt controller
-
3. COM2—serial interface
-
4. COM1—serial interface
-
5. LPT—parallel interface
-
6. Floppy disk controller
-
7. Available
-
8. CMOS real-time clock
-
9. Sound card
-
10. Network adapter
-
11. Available
-
12. Available
-
13. Numeric processor
-
14. IDE—Hard disk interface
-
15. IDE—Hard disk interface
As you can see the list of interrupts, the controller already allows for direct handling of hardware I/O interrupts of attached devices, which are handled through the IRQ interrupt or fast interrupt on an ARM platform. This feature makes the implementation of proper interrupt handling at the operating system level easier on Intel architecture especially for device I/O. The mapping of software exceptions like data aborts or segmentation faults is more flexible on Intel architecture as well and corresponds to an interrupt controller port that is addressed via the Interrupt Descriptor Table (IDT). The mapping of the IDT to the hardware interrupts is definable by the software stack. In addition, trapping these exceptions cannot as easily be done from a software stack agnostic debug implementation. In order to trap software events that trigger hardware interrupts on Intel architecture, some knowledge of the OS layer is required. It is necessary to know how the OS signals for these exceptions map to the underlying interrupt controller. Most commonly, even in a system-level debugger, a memory mapped signal table from the operating system will trap exceptions instead of attempting to trap exceptions directly on the hardware level.
Single Step
ARM architecture does not have an explicit single-step instruction. On Intel architecture, an assembly-level single step is commonly implemented in the debugger directly through such an instruction. On ARM, a single instruction step is implemented as a “run until break” command. The debugger is required to do some code inspection to ensure that all possible code paths are covered (especially if it’s stepping away from a branch instruction or such). From a debugger implementation standpoint, this does generate slight overhead but is not excessive, since this “run until break” implementation will be frequently needed for high-level language stepping anyway. Software developers in general should be aware of this difference since this can lead to slightly different stepping behavior.
Virtual Memory Mapping
The descriptor table and page translation implementation for virtual memory mapping is surprisingly similar, at least conceptually. On Intel architecture, the Global Descriptor Table (GDT) and Local Descriptor Table (LDT) enable nested coarseness adjustments to memory pages to be mapped into the virtual address space. Figure 8-32 uses the page translation feature of the debugger to graphically represent the linear-to-physical address translation on Intel architecture.

Page Translation on Intel Architecture
On ARM, the first level and second level page tables define a more direct and at maximum, a one- or two-level–deep page search for virtual memory. Figure 8-33 shows a sample linear address to physical address translation.

Page Translation on ARM
Intel architecture offers multiple levels of coarseness for the descriptor tables, page tables, 32-bit address space access in real mode, and 64-bit addressing in protected mode, which is dependent on the selector base:offset model. ARM does not employ base:offset in its various modes. On Intel architecture, the page table search can implicitly be deeper. On ARM, the defined set is two page tables. On Intel architecture, the descriptor tables can actually mask nested tables and thus the true depth of a page table run can easily reach twice or three times the depth on ARM.
The page translation mechanism on Intel architecture provides for greater flexibility in the system memory layout and mechanisms used by the OS layer to allocate specific memory chunks as protected blocks for application execution. However, it does add challenges for the developer to have a full overview of the memory virtualization and thus avoid memory leaks and memory access violations (segmentation faults). On a full featured OS with plenty of memory, this issue is less of a concern. Real-time operating systems with more visibility into memory handling may be more exposed to this issue.
Considerations for Intel Hyper-Threading Technology
From a debugging perspective, there is really no practical difference between a physical processor core and a logical core that has been enabled via Intel hyper-threading technology. Enabling hyper-threading occurs as part of the platform-initialization process in your BIOS. Therefore, there is no noticeable difference from the application standpoint between a true physical processor core and an additional logical processor core. Since this technology enables concurrent execution of multiple threads, the debugging challenges are similar to a true multi-core debug.
SoC and Interaction of Heterogeneous Multi-Core
Dozens of software components and hardware components interacting on SoCs increase the amount of time it takes to root-cause issues during debug. Interactions between the different software components are often time-sensitive. When trying to debug a code base with many interactions between components, single-stepping through one specific component is usually not a viable option. Traditional printf debugging is also not effective in this context because the debugging changes can adversely affect timing behavior and cause even worse problems (also known as “Heisenbugs”).
SVEN (System Visible Event Nexus)
SVEN is a software technology (and API) that collects real-time, full-system visible software “event traces.” SVEN is currently built into all media/display drivers and is the primary debug tool for the Intel media processor CE3100 and Intel Atom processor CE4100 platforms. SVEN provides debug, performance measurement, and regression testing capabilities.
Ultimately, SVEN is simply a list of software events with high-resolution timestamps. The SVEN API provides developers a method for transmitting events from any operating system context and firmware. The SVEN Debug infrastructure consists of a small and fast “event transmit” (SVEN-TX) library and a verbose capture and analysis (SVEN-RX) capability.
This so-called System Visible Event Nexus in the form of the SVEN-TX library provides an instrumentation API with low and deterministic overhead. It does not cause any additional timing-dependent effects. There are no changes in the behavior of the system because of the instrumentation observation. In other words, there is no software Heisenberg effect. The events to monitor can be issued by any software component on the entire platform. These can be interrupt service routines (ISRs), drivers, applications, and even firmware.
A real-time monitor interface named SVEN-RX provides real-time and offline analysis of the data exported by the SVEN-TX API. SVEN-RX can monitor an executing system and analyze failures on the executing application. In addition, it provides detailed information for fine-grained performance tuning.
Lastly, the SVEN Debug console is a command-line utility that attaches to the Nexus and observes all events being generated by the SVEN-TX instrumented code (drivers, user apps, and libraries). A scriptable filter dynamically accepts or rejects any describable event category (for example, only record events from MPEG decoder). Scriptable “triggers” stop recording events to halt local capture of events leading up to a failure. A Reverse Engineer feature transfers all register reads/writes from a physical address to the unit and External Architecture Specification (EAS) registers.
The SVEN debug console can save the recorded events collected from the SoC to a disk file for offline debugging.
Signal Encode/Decode Debug
The SVEN Debug console has a built-in Streaming Media Decoder (SMD) buffer flow monitor that checks on SMD ports/queues for data flow between drivers. It also samples the SMD circular buffer utilization over time. Its health monitor is capable of triggering an execution stop and data capture if, for example, it fails to detect video flip or an audio decode within a specified period of time.
SVEN Benefits
SVEN enables an accelerated platform debug process providing the developers with all of the required evidence for problem triage. The included automation tools can diagnose most of the common system failures automatically. In short, it speeds up the development cycle on complex Intel Atom processor–based SoC designs by reducing the time it takes the developer to understand issues that occur in the data exchanges and handshake between all of the system components.
Overview
This chapter covered the configuration and installation details of the necessary drivers and debug tools. In addition, we highlighted some of the underlying architectural differences that may impact debug, but usually only for those developers who are interested in development very close to the system layer.
As you have seen in the overview of available debug solutions and debug configurations, there is a full set of debug environments available covering the needs of the Java application developer, the native C/C++ code developer, as well as the system software stack developer.
Debugging on Intel architecture is supported with the standard Android SDK and Android NDK toolsets provided by Google. In addition Intel as well as other ecosystem players provide debug solutions that expand on these available debug tools and provide solutions for system software stack debug as well as graphics performance debug.
If you are familiar with debugging and developing for Android running on ARM architecture, the same debug methods apply to Intel architecture. The available debug tools and development tools infrastructure is based on the Android SDK and extended by solutions from Intel, as well as ecosystem partners that are often also familiar from ARM. Thus there should be few surprises when debugging software on an Intel Atom processor-based Android device versus ARM-based devices.
Author information
Authors and Affiliations
Rights and permissions
Open Access This chapter is licensed under the terms of the Creative Commons Attribution-NonCommercial-NoDerivatives 4.0 International License (http://creativecommons.org/licenses/by-nc-nd/4.0/), which permits any noncommercial use, sharing, distribution and reproduction in any medium or format, as long as you give appropriate credit to the original author(s) and the source, provide a link to the Creative Commons licence and indicate if you modified the licensed material. You do not have permission under this licence to share adapted material derived from this chapter or parts of it.
The images or other third party material in this chapter are included in the chapter’s Creative Commons licence, unless indicated otherwise in a credit line to the material. If material is not included in the chapter’s Creative Commons licence and your intended use is not permitted by statutory regulation or exceeds the permitted use, you will need to obtain permission directly from the copyright holder.
Copyright information
© 2013 Iggy Krajci
About this chapter
Cite this chapter
Krajci, I., Cummings, D. (2013). Debugging Android. In: Android on x86. Apress, Berkeley, CA. https://doi.org/10.1007/978-1-4302-6131-5_8
Download citation
DOI: https://doi.org/10.1007/978-1-4302-6131-5_8
Published:
Publisher Name: Apress, Berkeley, CA
Print ISBN: 978-1-4302-6130-8
Online ISBN: 978-1-4302-6131-5
eBook Packages: Professional and Applied ComputingApress Access BooksProfessional and Applied Computing (R0)