
Abstract
This chapter deals with selected variables (light, nutrients, and temperature) that function as proximate or immediate controls of abundance and activity of marine primary producers. Grazing and sinking, two other major proximate factors affecting producers, are discussed in Sects. 10.3 and 15.2.4. These proximate controls act to set rates, govern densities, sizes, and other responses by producers. Later chapters deal with driver variables (hydrodynamics, climate, weather, and geology) that act as the ultimate mechanisms that determine the conditions under which the action of proximate controls, and the responses of the producers and consumer organisms, take place. These linkages constitute the rather complicated matrix of interactions that generates the very varied features and conditions across environments. These interactions result in the complex set of controls of communities and ecosystems that will be the focus of later chapters.
Access this chapter
Tax calculation will be finalised at checkout
Purchases are for personal use only
Notes
- 1.
Most of us would think that a measure of amount of light might be light intensity, but that term probably should be used to refer to emission of light energy by a source, for example, in units of watts. Energy from such a source changes with distance from the source. The measure of light energy that seems most appropriate for our purposes is irradiance, whose units are moles of photons impinging on a unit of surface per unit time.
- 2.
The measurement of irradiance is reported in widely varying units. Photosynthesis is driven by photons and so the preferred light unit quantifying photons is the Einstein (E), where 1 E = 1 mol of photons. Full sunlight at the sea surface roughly equals 2000 ΜE m−2 s−1. Rough conversion among other light units used, some perhaps less appropriately, in the literature are: 1 μE m−2 s−1 = 0.0187 ly (langley) h−1 = 0.217 W (watt) m−2 = 51.2 L = 4.78 ft candles, where 1 ly = 1 gcal cm−2, 1 W = 107 ergs s−1; 1 lx = 1 candle on 1 m2; 1 ft candle = a candle at 1 ft distance; all conversions refer to light in 400–700 nm, the range of wavelength that spans photosynthetically active radiation (PAR).
- 3.
Turbulence is generated by winds, waves, currents, and tides. It is manifested as multiple eddies that have no well-established direction of translation. Turbulent eddies tend to disturb stratified waters and result in mixing of water masses and organisms.
- 4.
The widespread preference of producers for uptake of ammonium over nitrate has an energetic basis. Ammonium can be readily used in protein synthesis, while nitrate has to be reduced within the cells—an energy demanding transformation—before the nitrogen can be used in synthesis of proteins.
- 5.
Early studies in the chemical composition of plankton (Redfield 1934) showed that particulate matter had carbon:nitrogen:phosphorus of 106:16:1, a relationship now referred to as the Redfield ratio. This was extended to claim that uptake of N and P from seawater would also follow a 16:1 ratio (Redfield et al. 1963; Corner and Davies 1971). These ratios are convenient averages but may not always be matched under field conditions (Banse 1979 Falkowski and Raven 2007).
- 6.
There is some doubt about the validity of estimates of K s obtained by incubation periods as long as hours, such as those in Table 3-2. Ammonium uptake can be very rapid during the first few minutes of exposure to nutrients (Glibert and Goldman, 1981), and slows later. Estimates obtained in exposures longer than 1 h or so may therefore underestimate K s (Glibert et al. 1982).
- 7.
Rectangular hyperbola expressions are used to describe saturating rate functions in many topics in ecology, including photosynthesis rates, nutrient uptake, growth rates, as we have already seen. In later chapters, they will appear as descriptors of ingestion rates by predators, and suspension feeding rates by consumers. Table 1 in Glibert et al. (2013) summarizes uses, variables, expressions, and ancillary information about rectangular hyperbolas.
- 8.
Oceanographers once expressed concentrations in gram-atoms or moles of an element per liter, since this made it clear that, for example, a reported value refers to the nitrogen in nitrate (NO3 -) and does not involve the oxygen. The actual expression was usually shown as μgat NO3-N l−1. Concentrations are, more recently, more often stated in molar units (M = moles l−1). This is a convenient system of units, and μM is equivalent to μgat or moles of NO3-N l−1 in the case of compounds such as NO3 - or NH4 +, where one atom of the element in question is present.
- 9.
The anomalous high frequency of very low (most are 0 or trace) phosphorus contents in Fig. 3-21 is due to coralline algal species whose cells are encrusted with calcareous deposits that increase the total weight. The data on these species are thus difficult to compare to other algal taxa. The very high values of phosphorus for freshwater plants are from sedges ( Cyperus) in environments with high phosphorus. Other Cyperus species growing in low phosphorus environments lie in the class with lowest P content.
FIGURE 3.21 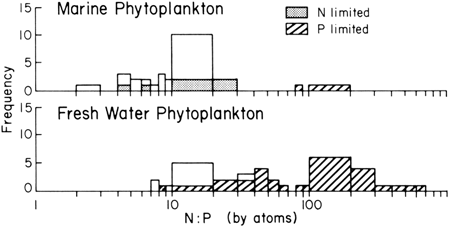
N to P ratio in marine and freshwater phytoplankton. Where the ratio was obtained from cells growing in nitrogen- or phosphorus-limited cultures or come from low P environment (less than 0.1 mg P L−1), it is so indicated. (Data from many sources, including Hutchinson (1975) and Jorgensen (1979))
- 10.
This kind of laboratory experiment is artificial in that sedimentation and grazing losses from the water are curtailed. Further, the regeneration of nutrients provided by grazers is also absent. Nonetheless, such experiments are a convenient, simple description of the situation.
- 11.
This is an opportune place to return to Fig. 3-15, which summarizes the results of nutrient enrichment experiments aimed at identification of limiting nutrients in a series of different environments. Note that in freshwaters, phosphorus tends to prompt larger responses as a limiting nutrient. In the marine coastal environments (denominated as benthos in Fig. 3-15), and in open ocean (pelagic) sites, nitrogen was more effective at limiting production. In most freshwater as well as in marine waters, there was an evident co-limitation of nitrogen and phosphorus (whether co-limitation was simultaneous or serial was not determined).

Author information
Authors and Affiliations
Corresponding author
Rights and permissions
Copyright information
© 2015 Springer-Verlag New York
About this chapter
Cite this chapter
Valiela, I. (2015). Controls of Primary Production. In: Marine Ecological Processes. Springer, New York, NY. https://doi.org/10.1007/978-0-387-79070-1_3
Download citation
DOI: https://doi.org/10.1007/978-0-387-79070-1_3
Published:
Publisher Name: Springer, New York, NY
Print ISBN: 978-0-387-79068-8
Online ISBN: 978-0-387-79070-1
eBook Packages: Biomedical and Life SciencesBiomedical and Life Sciences (R0)