
Abstract
SOOMA is a software tool developed by Laboratório de Ergonomia (LABER) of the Instituto Nacional de Tecnologia (INT) of Brazil for use in projects involving anthropometric characterization of the human body. Its main objective is to automate the location of body landmarks and calculation of anthropometric measurements based on digital human models generated by 3D laser scanning. SOOMA was designed as a modular application, allowing implementation of algorithms for landmarks location and anthropometric measurements calculation independent of the graphical user interface responsible for controlling user interaction. Data and files are stored in a local database immediately after production. Optionally, stored data and files may be copied to a centralized document management system that provides long term preservation and decentralized access by registered users. The Control module is a C# windows application and the local database is an opensource database. Currently, the Script module is based on R but other algorithm execution tools can be used. Opensource software LogicalDOC is used as document management system and some specialized functions for visual verification of landmark location and 3D pdf generation depend on additional opensource tools (CloudCompare, Meshlab and Miktex).
Keywords
1 Introduction
Conventional anthropometric measurement is a manual task performed by specialized technicians using direct measuring tools. Accuracy and consistency of results may be affected by faulty procedures and human errors. Manual direct measurement allows only for linear measures, as surface and volume measurements are not possible with conventional measurement tools. Also, as subjects are not permanently available for measurement tasks, only previously defined and planned measures are taken.
Modern optical technologies like 3D laser scanning make it possible to capture human body measurements independent of physical contact [1]. Laser light projected over the human body is reflected and captured by cameras and mapped as a large set of points (point cloud) in 3D coordinate system. These coordinates can be used to identify body landmarks and extract linear, surface and volume measurements with higher accuracy and consistency than is possible with direct manual measurements [2, 3].
Specialized software tools can be used to visualize the 3D digital model and manually extract anthropometric measurements. However, experience shows this is an arduous task and results may vary depending on user’s ability with the tool. To obtain anthropometric measurements from even a small population based on manual extraction is a significant challenge. To assure good quality and productivity levels, standard procedures for extraction of anthropometric data are needed.
For this, INT’s Ergonomics Laboratory (LABER) developed SOOMA as a supporting tool for the extraction of body landmarks and anthropometric measurements (1D, 2D and 3D). Following design guidelines were used:
-
Easy of use – user friendly interface and functionalities for a qualified user to execute standard procedures.
-
Agility – immediate results evaluation so that user may decide whether to accept or reject 3D model acquired.
-
Transparency - promotion of results consistency and quality by preserving all data necessary to verification and reproduction of results at any time.
-
Flexibility – algorithms are not embedded in compiled code and can be changed according to specific needs of research project or be updated with corrections and improvements. All registered data on subject model is available for use by the algorithms (e.g. sex, height, weight, posture, …).
-
Persistence - all data on human model and software settings, whether entered, acquired or calculated is stored independent of user action.
-
Low dependency – there is no dependency regarding scanner equipment brand or model, nor on local network or internet connection. For 3D model acquisition a digital file must be provided, but there is no hard dependency on proprietary file formats.
2 Description
SOOMA is composed by two modules: Control and Script. The first is responsible for user interface and local database storage. Second module is responsible for execution of algorithms specially designed for processing a digital human model file for the extraction of body landmarks and anthropometric measures calculation. Storage of 3D model files and data is managed in two stages: short-term storage of data and files is assured by an embedded database (open source software SQLite) and long-term storage is provided by copying data and files to a Content Management System (open source software LogicalDOC) (see Fig. 1).

SOOMA architecture.
Main concepts and artifacts considered on SOOMA development were:
-
Project Datasheet – body postures, landmarks and anthropometric measures of interest are not fixed on code and may be defined according to specific requirements of each research project. Configuration data for each project is entered by a “.xlsx” file that must be imported by SOOMA. Specific project requirements are processed by the algorithms executed by the Script module.
-
Subject – each person that contributes with digital models is identified by an alphanumeric code to which all model files and data refer to. For privacy considerations the person name and email are not exposed with other model data.
-
Subject Form – for each subject a set of characterization data is registered, including anthropometric measures manually collected during scanning sessions. This dataset is available for use by the extraction and measurement algorithms;
-
Body Posture – for each subject several digital models may be captured, where each model refers to a specific body posture of interest to the research project and has its own model file generated by the 3D scanner.
-
Body Landmarks – for each 3D model file the Script module extracts a set of XYZ coordinates corresponding to the set of body landmarks defined for the project.
-
Anthropometric Measures – based on extracted landmarks the Script module calculates a set of anthropometric measures defined for the project.
-
Session Dataset – the Subject Form along with the digital model file Body Landmarks and Measures results compose the Session dataset. Subjects may be scanned multiple times along the project duration and for each contribution, new sessions datasets are created with updated subject data at the time of the session.
SOOMA is a standalone C# [4] application installed on Windows desktops or notebooks and for most operations may be used independent of local network or internet access. Software integrated with SOOMA (SQLite [5], CloudCompare [6], Meshlab [7] and Miktex [8]) must be installed on same equipment as SOOMA, except for LogicalDOC [9] which can be accessed on a dedicated server on local network or internet.
Module Script language and platform are not fixed and may be chosen according to each project requirements. However, as communication between modules is by command line and files exchange, the Script platform must be installed on same equipment as SOOMA. During SOOMA implementation, the open source software for statistical computing R [10] was used as module Script platform. So, our first algorithm for landmark extraction and anthropometric measurements was developed as an R script. In the future other algorithm execution platforms may be used.
3 Operation
Every day use of SOOMA may be resumed as a 4-step workflow (see Fig. 2).

Simple SOOMA workflow.
-
1.
Fill Subject Form – user identifies the subject on scanned 3D model files and fills a screen data form with subject classification information and some conventional manual measurements (ex.: gender, height, weight, body posture etc.);
-
2.
Process 3D model – user supplies file containing subject’s 3D digital model and executes Script to process it. Results are collected by Control, automatically stored on local database and presented to user on screen results grid;
-
3.
Verify results – user verifies quality of landmarks location and anthropometric measurements results and decides whether proceed to next step or go back to step 2. To help users on this step, SOOMA provides integration with CloudCompare for visualization of landmarks together with digital model (see Fig. 3).
Fig. 3. 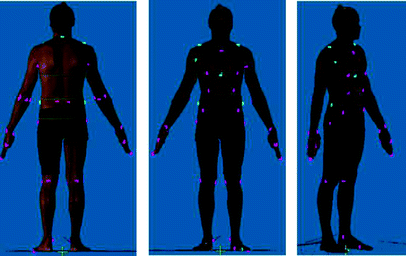
Visualization of landmarks with CloudCompare. (Color figure online)
-
4.
Export to CMS – digital model and results data are automatically saved on local database, but to assure long term storage independent of equipment used, an integration with LogicalDOC allows users to send files and data to a centralized document management system.

Step 1 is executed once for each Session Dataset, while Steps 2 & 3 are repeated for each body posture model file. Step 4 is optional and may be executed immediately following Step 3 or at a later time for all models on the Session Dataset.
4 Algorithm Development
SOOMA first algorithm for automated landmark extraction and anthropometric measurement was developed as an R script. Main concepts for this algorithm development, as well as tests procedures and results are described. For tests and validation, a total of 70 volunteers were scanned (35 men and 35 women) and a test procedure based on five steps was defined and executed: (1) Subject scanning; (2) Model selection and cleaning; (3) Landmarks extraction; (4) Measurements Calculation and (5) Results validation.
4.1 Subject Scanning
Before scanning, subject signed a Terms of Agreement and personal data was collected. Then subject dressed a measurement attire and 70 colored markers were affixed to volunteer’s body (61 blue circle-shaped stickers and 9 green elastic bands). Next, anthropometric measurements were manually taken based on positioned markers.
Finally, subject was scanned by a full body 3D scanner (Cyberware WBX) with laser vertical pitch of 2 mm, in a standing posture, conforming to CAESAR scanning research protocol [11]. Typical scanning period was about 36 s and each volunteer was scanned three times at same body posture.
To ensure resulting 3D model was adequate, a checking procedure was performed at each scanning session: equipment calibration, lighting control, and control of body posture and movements [12, 13].
Afterwards, scanner software Cyscan (Cyberware proprietary software) was used to generate a 3D triangular polygonal mesh file based on Stanford Triangle Format (“.ply”). Typical 3D mesh generated contains about 700.000 vertices, where each vertex corresponds to a point of reflected laser light detected by the scanner cameras. Each point is defined by six variables: a XYZ coordinate and RGB based reflected light color.
4.2 Model Selection and Cleaning
Five quality criteria were used to select the best human model from each three scans set: (1) Non-distorted image; (2) Visualization of five essential landmarks (C7, left and right acromion and trochanterion) (3) No rotation of the trunk in top plane view; (4) Elastic bands placed parallel to the ground; (5) Landmarks not hidden by elastic bands; (6) Elastic bands not hidden by measurement attire. Cleaning of digital model was performed by manually deleting environmental noise using CloudCompare software.
4.3 Markers Location
A built-in functionality is provided by the Control module for use with “.ply” file format, where a point cloud version is automatically generated with only the triangles vertices coordinates and RGB color. But any other open format may be converted to a point cloud model by the Script module implementation. The point cloud model is imported by the Script module and executed by statistical software package R to isolate the points that form the colored markers from all other points on the model. To improve isolation of colored markers, a DIFF variable is calculated for each point so that only points with DIFF > 5 are selected. Blue points are found by setting \( DIF_{B} = \, \left( {B - R} \right) + \left( {B - G} \right) \) and green points by setting \( DIF_{G} = \, \left( {G - R} \right) + \left( {G - B} \right) \).
For each blue marker (composed by about 50 blue points) a weighted arithmetic mean of XYZ coordinates is calculated as candidate to represent the location of the marked body landmark. To push this candidate towards the center of the marker the point’s DIFB is used as weight, considering that points located at the center of the markers have a stronger blue color. A similar procedure is used to locate the centerline of the green elastic bands.
However, selecting a landmark candidate is not enough. It is necessary to associate the candidate with a specific body landmark, and this is not always a clear and easy task, especially when distance between markers is not large. Also, significant effort and time is dispended on fixation of the circular markers and elastic bands, not always with adequate results. So, there is interest in methods that allow for automated location and classification of landmarks independent of colored markers on the subject body.
4.4 Landmark Region Calculation
SOOMA first algorithm includes a method for automated classification of candidate landmarks that also allows for estimation of landmarks without markers. Method hypothesis is that each body landmark has a characteristic region for its possible location, defined by a range of values based on the landmark relative height and angle at a certain direction. The set of relative heights and angles that define these landmark regions depend on the population physical characteristics, and for its calculation the following procedure was used:
-
a.
The marker center point for all blue markers on the 70 subjects were calculated and visually validated and associated with body landmarks using CloudCompare.
-
b.
Variable HPsi is defined as the ratio of height of marker center point corresponding to landmark i to the subject j stature. So, HPs vector is composed of 61 variables which correspond to the relative heights (hpsij) of all calculated landmarks:
$$ \begin{array}{*{20}c} {hps_{ij} = \underline{{{\text{height}}\,{\text{of}}\,{\text{marker}}\,{\text{center}}\,{\text{point}}\,{\text{calculated}}\,{\text{as}}\,{\text{landmark}}\,i\,{\text{of}}\,{\text{subject}}\,j}} } \\ {{\text{stature}}\,{\text{of}}\,{\text{subject}}\,j} \\ \end{array} $$(1) -
c.
For trunk and lower limbs, height of marker center point is obtained by value of its Z coordinate – which is the distance to scanner base. For upper limbs, it is necessary to consider that they are inclined in the project standard posture, and height calculation must discount the angle elevation relative to limbs positioned alongside the trunk. For this, some geometric manipulation is applied to get arms aligned with Z-axis and have relative heights calculated in relation to the tip of the middle finger.
-
d.
For calculation of marked angle APi, all points contained within range of ±6 mm (marker size) from z coordinate are selected and location angle is determined by X and Y coordinates of three points: the marker itself, the center of the shape and a reference point (see Fig. 4).
Fig. 4. 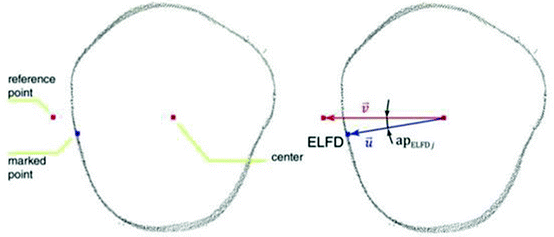
(A) points to calculate angle of right lateral femoral epicondyle (B) apELFDj - angle of the lateral femoral epicondyle.
-
e.
With HPsi and APi defined, intervals with high probability of containing the population means were created. For each variable, normality assumptions were evaluated using the Shapiro-Wilk hypothesis test, suitable for small samples [14]. When normality assumption at a 5% significance level was accepted, 95% confidence intervals (CI) were defined for population means. When normality assumptions were not met, interquartile ranges (IQR) were defined, on which limits were first and third quartiles. This type of range has high probability of containing the central tendency, since they have 50% of central data.
-
f.
Results of low/high relative heights and angles define the limits of a set of volume regions where landmarks are probable located, which we call Landmark Regions.

4.5 Landmark Estimation and Classification Using Landmark Regions
For each subject model, the Landmark Regions can be used to estimate body landmarks coordinates without using markers by following procedure:
-
a.
identify the Landmark Region set of relative height and angle corresponding to the desired landmark.
-
b.
convert the relative height range of Landmark Region to a height range in meters by multiplying the lower and upper limits height range by the subject’s stature.
-
c.
select all subject’s cloud points contained between the lower and upper height limits and within the region angle range.
-
d.
Estimated Landmark’s coordinates are obtained by calculating the arithmetic means of selected cloud points coordinates.
-
e.
for each subject model, calculate the Euclidean distance between the Estimated Landmark and all landmark candidates calculated from the blue marker points.
-
f.
landmark candidate which is closest to an Estimated Landmark’s coordinates, with a maximum calculated distance value of 10 cm, is classified as the corresponding Body Landmark and marked as “Located”.
-
g.
if no landmark candidate is close enough to an Estimated Landmark but the landmark region contains point clouds within it, the estimated landmark is classified as the corresponding Body Landmark and marked as “Estimated”.
-
h.
if no landmark candidate is close enough to an estimated landmark and the landmark region is empty of point clouds, the corresponding Body Landmark is set with invalid coordinates and marked as “Not found”.
This method of estimation and classification considers landmarks as independent from each other. Each landmark is estimated considering only the expected information for that landmark.
4.6 Measurement Calculation
Lengths, widths and diameters are calculated with Euclidean distance methods from the coordinates of the Body Landmarks obtained by localization and estimation.
A smoothing method is used to reduce perimeter overestimation due to variations in the circumferences point coordinates. Cross-section surface area and volume of body segments are calculated by adaptations of the perimeter method. The body segment is split in several parts, measurement is made as for a simple geometry part and repeated for higher number of parts until differences in sequence of measurements falls below a certain value (see Fig. 5).

Body segment division in equal parts for volume calculation.
5 Results Validation
In anthropometry, height ratio is a resource used to obtain body segment size estimates. In this work, sample means of the relative heights of landmarks were used to determine these segments due to strong correlation between stature and segment size. It was found that heights of the upper limb landmarks presented moderate correlation with stature, assuming values around 0.7, compared to trunk and lower limbs, where most of the correlations were above 0.8, not considering hands and feet.
Normality assumptions were met for almost all landmarks for both sexes for Shapiro-Wilk test at a significance level of 5%, allowing use of confidence intervals to estimate almost all landmarks. Obtained ranges presented low amplitudes with few cases above 1% of stature. This was observed even when normality assumption was not accepted and interquartile interval, less precise than confidence interval, was used. Considering average height of men (175.9 cm) and women (164.0 cm), height ranges presented amplitudes around 1.2 cm, size of marker used to identify the landmarks.
With height and angle ranges calculated from the test sample, mean difference between markers’ centers and estimated landmarks (mean error) was 1.646 cm for men and 1.445 cm for women. Estimated circumference heights were about 1.5 cm distant from the elastic bands.
Considering the three measurement methods - traditional, with markers and with estimated landmarks and circumferences - the mean and median values remained very close to each other for all anthropometric measurements both for men and women.
In all we consider that experience has shown that SOOMA is a viable tool for anthropometric data extraction with standard procedures that results in good quality and productivity levels. Also, results achieved signals that body landmark extraction without marker fixation is a viable goal. However, additional work is needed to enlarge population used for building landmark regions dataset and for developing scripts able to process additional body postures.
References
Wang MJ, Wu W, Lin K, Yang S, Lu J (2007) Automated anthropometric data collection from three-dimensional digital human models. Int J Adv Manuf Technol 32:109–115. https://doi.org/10.1007/s00170-005-0307-3
Schranz N, Tomkinson G, Olds T, Daniell N (2010) Three-dimensional anthropometric analysis: differences between elite Australian rowers and the general population. J Sports Sci 28(5):459–469. https://doi.org/10.1080/02640411003663284
Stewart AD (2010) Kinanthropometry and body composition: a natural home for three-dimensional photonic scanning. J Sports Sci 28(5):455–457. https://doi.org/10.1080/02640411003661304
C# Homepage. https://pt.wikipedia.org/wiki/C_Sharp. Accessed 25 May 2018
SQLite Homepage. https://www.sqlite.org. Accessed 25 May 2018
CloudCompare Homepage. http://www.danielgm.net/cc. Accessed 30 Mar 2017
Meshlab Homepage. http://www.meshlab.net. Accessed 25 May 2018
Miktex Homepage. https://miktex.org/. Accessed 25 May 2018
LogicalDOC Homepage. https://www.logicaldoc.com/download-logicaldoc-community. Accessed 25 May 2018
R Homepage. https://www.r-project.org. Accessed 27 Aug 2017
Robinette KM, Blackwell S, Hoeferlin D, Fleming S, Kelly S, Burnsides D (2002) Civilian American and European Surface Anthropometry Resource (CAESAR) Final Report Volume I: Summary, National Technical Information Service, 5285 Port Royal Road, Springfield, Virginia 22161
Brunsman MA, Daanen HAM, Robinette KM (1997) Optimal postures and positioning for human body scanning. In: International conference on recent advances in 3-D digital imaging and modeling proceedings, pp 266–273. (Cat. No. 97TB100134). https://doi.org/10.1109/im.1997.603875
Daanen HAM, Brunsman Ma, Robinette KM (1997) Reducing movement artifacts in whole body scanning. In: International conference on recent advances in 3-D digital imaging and modeling proceedings, pp 262–265. (Cat. No. 97TB100134). https://doi.org/10.1109/im.1997.603874
Razali NM, Wah YB (2011) Power comparisons of Shapiro-Wilk, Kolmogorov-Smirnov, Lilliefors and Anderson-Darling tests. J Stat Model Anal 2(1):21–33. https://doi.org/10.1515/bile-2015-0008
Acknowledgements
We are grateful to Universidade Estácio de Sá (UNESA) through the UNESA Productivity Research Program 2018 and to Conselho Nacional de Desenvolvimento Científico e Tecnológico (CNPq) through the Institutional Capacity Program (PCI/MCTIC) for supporting this work.
Author information
Authors and Affiliations
Corresponding author
Editor information
Editors and Affiliations
Rights and permissions
Copyright information
© 2019 Springer Nature Switzerland AG
About this paper

Cite this paper
Pastura, F.C.H., Costa, T.F., de Aguiar Mendonça, G., Zamberlan, M.C.P.L. (2019). SOOMA - Software for Acquisition and Storage of Anthropometric Data Automatically Extracted from 3D Digital Human Models. In: Bagnara, S., Tartaglia, R., Albolino, S., Alexander, T., Fujita, Y. (eds) Proceedings of the 20th Congress of the International Ergonomics Association (IEA 2018). IEA 2018. Advances in Intelligent Systems and Computing, vol 826. Springer, Cham. https://doi.org/10.1007/978-3-319-96065-4_52
Download citation
DOI: https://doi.org/10.1007/978-3-319-96065-4_52
Published:
Publisher Name: Springer, Cham
Print ISBN: 978-3-319-96064-7
Online ISBN: 978-3-319-96065-4
eBook Packages: Intelligent Technologies and RoboticsIntelligent Technologies and Robotics (R0)