
Abstract
This paper studies the effect of application of Peak-End Rule on user experience in the design of App blank pages, taking the mobile App loading process for case study. It simulates the waiting scenes caused by system response when users use mobile applications. Participants are asked to estimate the waiting time-distances for loading page time in the waiting process. Simultaneously, five-point scale is used to mark the network abnormal page for users by the questionnaire. It is found that, compared with circle loading and progress bar loading, fun loading can shorten user’s judgment of waiting time through the rich and interesting animation form. Graphic design has more influence on user experience than text expression in the design of network abnormal page.
1 Introduction
With the rapid development of mobile products, application interfaces such as product home page, detail page, list page and other key interfaces are continuously innovated and improved under the trend of design to better meet user’s experience requirements. In the design of App’s numerous interfaces, blank pages tend to be arranged by designers to the end of design schedule or even ignored. As one of the details that can easily be overlooked in mobile products, it is full of unlimited potential and possibilities. The potential value of blank pages requires designers to improve their user experience in a reasonable and interesting way.
App blank pages can be divided into two categories based on static and dynamic state: no data page and data loading page. The former contains Null page, network abnormal page and server abnormal page. Data loading page and network abnormal page constitute the loading and waiting process. Using fluency is the basic expectation of most users, just like eating without a long queue. However, the instability of mobile network and different configuration of mobile hardware can cause page load waiting to become an inevitable factor that affects user experience of mobile terminal products for users.
The related research of waiting time has been a research topic in the field of cognitive psychology and social psychology, and even consumer psychology. Waiting time is a key factor affecting user experience. It is difficult to change due to some objective reasons. Therefore, how to improve user experience in the loading process becomes one of the important issues in waiting research.
2 Peak-End Rule
Peak-End Rule was first proposed by psychologist Danny Kahneman. He found that people’s memory of an experience is determined by two factors: the feeling of the peak (whether positive or negative) and the end. In other words, people can only remember the experience of “peak” and “end” after experiencing one thing. The overall feeling of users can be improved by enhancing the experience of these two critical moments.
Peak-End Rule also has some applications in the field of design. Chen yan, Xin Xiangyang, Hu Weifeng applied Peak-End Rule to the design of bus ticket machine interface improved design. They confirmed and improved the key interface of “peak” and “end” experience of bus ticket machine and tested the results, which verified that the improvement of product interface based on Peak-End Rule is an effective way to improve the product operation experience [1]. Zhang analyzed the design of 404 error page through eye movement experiment and proposed the design principle that 404 error page should follow on the basis of Peak-End Rule [2].
In the user experience of App page loading process, the browsing of data loading page belongs to the “peak” moment of loading process, and the loading result page which may be a network abnormal page or a normal result page belongs to the “end” moment of loading process. User satisfaction of these two critical moments needs to be improved to enhance the user experience of App loading process.
3 App Loading Process
When designing App, designers will focus more on the appearance of interface, and often ignore an important part, namely, the jump between interfaces and the operation feedback given to users. In the App loading process, users will face a long waiting time for data loading when the network is not smooth and the data loading will be in a failed state when there is no network. The experience in these situations determines user’s impression of the product. Therefore, it is important to improve user experience on data loading page and network abnormal page.
3.1 Data Loading Page
Data loading page is a blank page generated in the page jump process. The waiting time of this page is subject to actual network problem, and “Do not let me wait” is a luxury for users when the network is in poor condition. The main influencing factors that affect user’s waiting time-distances estimated are actual waiting time and feeling waiting time. Actual waiting time can not be changed because it is affected by some objective conditions such as network conditions and hardware configuration of the mobile device. Therefore, user’s waiting time-distances estimated can only be reduced through the later loading design to improve user satisfaction in the waiting process.
User’s subjective feeling waiting time is called “perception of waiting time” in psychological cognition. It refers to people’s subjective feelings and psychological experience of waiting time in the process of waiting, which will affect people’s behavior [3, 4]. There are many factors influencing perception of waiting time: network connection status, loading form, visibility of loading progress, personal cognition level and personality characteristics. At present, common loading forms include concept loading model, fun loading, non-modal loading and hidden-type loading [5]. He and Fu found that non-modal loading and hidden-type loading have a better effect on shortening user’s perception of waiting time through study [6]. In view of the fact that not all mobile products are suitable for both loading modes and lack of progress bar loading with visibility of loading progress, this paper will experiment with several loading models except non-modal loading and hidden-type loading, enriching research results of data loading page. The loading methods of study are shown in Table 1.
-
1.
Circle loading. Circle loading is a common method in concept loading models. It is through repetitive rotation animation to inform users that data is being loaded and the form is simple. This loading method appears in the loading of mobile device system page. For example, the “theme beautification” application of Meizu mobile phone adopts the form of circle loading, as shown in Fig. 1(a).
Fig. 1. 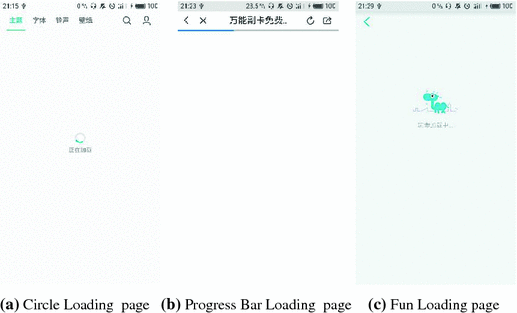
Classification of data loading pages.
-
2.
Progress bar loading. Progress bar loading is another common method in concept loading models. In addition to informing users what is going on, it also gives users a clear, informed view of loading schedule. Part of Pocket Office mobile terminal pages adopt this kind of loading method. Forward blue rectangle prompts users the current loading schedule which affects user’s judgment of time to a certain extent, shown in Fig. 1(b).
-
3.
Fun loading. Fun loading transfers user’s attention through some interesting elements such as creative writing, color, dynamic effect and sound, so as to satisfy the “pleasure” of upper needs of users [5]. Meaningful things can attract people’s attention faster [7]. Faced with something of interest, individuals tend to underestimate time-distances [8]. Page loading method of Where to Travel Mobile client simulates camel walking and disperses user’s perception of time in an interesting form, shown in Fig. 1(c).

3.2 Network Abnormal Page
Network abnormal pages generally appear in two cases. One is the network interruption when network is switched from WiFi state to 3G/4G. The other is the network interruption when data is transferred between App and server. Network interruption terminates user’s browsing action, directly influencing user’s current experience. Good network abnormal pages can effectively appease users’ emotions, guide users to perform next steps, and improve the experience of network abnormality.
Network abnormal page is usually composed of graphics and text.
-
(1)
Graphic design
The graphic design of network abnormal page is currently divided into two types. One is the icon, as shown in Fig. 2(a). A simple gray icon indicates the current network anomaly. The other is fun picture, as shown in Fig. 2(b). It creates artistic patterns through rich colors and expression forms, increases user’s visual pleasure, and improves the effect of information communication. It has remarkable effect.

Network abnormal page.
-
(2)
Text expression
The same meaning expressed in different words can give a completely different psychological feeling. In Fig. 2(a), designers convey the state of network interruption with a plain text without any embellishment. Figure 2(b) compares the network to a waiter with the figurative rhetoric, and conveys the situation of network abnormality humorously.
4 Experiment 1: Study on Time-Distances Estimated of Data Loading Pages
4.1 Experiment Purpose
Based on the previous studies, this experiment complements progress bar loading with visibility of loading schedule. This paper aims to find out which loading method can shorten user’s perception of waiting time and improve user experience of loading process with basic principles and experiment methods of cognitive psychology.
4.2 Experiment Method
The experiment was designed by two factors: 2 (Page loading time: 5.0 s, 10.0 s) * 3 (Page loading method: fun loading, circle loading, progress bar loading). In order to avoid the impact of test sequence on participants, experiment samples were presented to them in a random manner.
4.3 Experiment Sample
In order to ensure the accuracy of experiment results, experiment equipment chose the same mobile phone with the same hardware configuration as test platform. Search is one function that is used more often in mobile application software. This experiment chose search results list loading page of ticketing mobile products as experiment scene to simulate user’s waiting process of purchasing tickets. According to the blank page loading types mentioned in this paper, a practice sample Demo and two groups of experiment samples were made, shown in Fig. 3.

Experiment samples of loading pages.
4.4 Participants
The report data of CNNIC 40th China Internet Statistics shows that in the age distribution of Chinese netizens, users aged 20–29 years old are the mainstream users, with 29.7% of the total users in this age group [9]. Therefore, this experiment selected similar age group of students as participants. Sixty subjects were recruited on campus, including 32 men and 28 women. There were 55 valid data, including 30 men and 25 women, with an average age of 23.5 years old and a standard deviation of 1.835.
4.5 Experiment Task
In Experiment 1, participants are required to click the search icon of search page first and proceed to the next operation when the page jumps to result page, which represents the completion of an experiment task. Each time an experiment task is completed, the participant is required to estimate the waiting time-distance (unit:/s, to be accurate to one decimal point) and record at the corresponding position on the experiment paper. Before the experiment, each participant is given an table about waiting time-distances estimated of samples and informed the purpose and requirements of experiment. Before the formal experiment begins, each participant is familiar with the experimental flow and perceives the loading time through practice sample. In order to avoid the influence of test sequence of experiment samples on participants, the experiment samples in this experiment are presented to participants in a random manner. The experimental flow is shown in Fig. 4.

Experimental flow sketch.
4.6 Analysis of Experiment Results
55 valid data are obtained for each experiment sample after the end of the experiment. All valid data are statistically analyzed by SPSS software.
When the page loading time is 5.0 s, the loading methods of waiting time-distances estimated mean from short to long loading time are respectively fun loading, circle loading and progress bar loading, as shown in Fig. 5. According to the experiment results of single factor variance analysis, it is found that there is a significant difference (P < 0.05) in the estimation of waiting time-distance between fun loading and progress bar loading, while there is no significant difference(P > 0.05) between fun loading and circle loading and circle loading and progress bar loading, as shown in Table 2.

Waiting time-distances estimated mean (Page loading time: 5.0 s).
When the page loading time is 10.0 s, the loading methods of waiting time-distances estimated mean from short to long loading time are respectively fun loading, progress bar loading and circle loading, as shown in Fig. 6. According to the experiment results of single factor variance analysis, it is found that there is a significant difference (P < 0.05) in the estimation of waiting time-distance between fun loading and circle loading, while there is no significant difference(P > 0.05) between fun loading and progress bar loading and circle loading and progress bar loading, as shown in Table 3.

Waiting time-distances estimated mean (Page loading time: 10.0 s).
According to the results of experiment 1, it can be seen that different loading methods and different loading times have different effects on waiting time-distances estimated. However, whether the loading time is 5.0 s or 10.0 s, the mean of waiting time-distances estimated of fun loading is the shortest. This experiment uses a lovely little train styling and realistic state of motion to indicate the loading process instead of the traditional concept loading model, which makes waiting progress enjoyable and allows users to feel fresh and interesting without sense of anxiety, thereby reducing the perception of change of time. Therefore, its mean of waiting time-distances estimated is shortest. Progress bar loading has the visibility of loading schedule compared to the other two loading methods. When the loading time is 5.0 s, the mean of waiting time-distances estimated of progress bar loading is 5.124 s which is longer than the actual loading time, tending to be negative. When the loading time is 10.0 s, the mean of waiting time-distances estimated of progress bar loading is 8.527 s which is shorter than the actual loading time, tending to be positive. Tencent “mobile page user behavior report” shows that when loading time is more than 5 s, 74% of users will leave the page [10]. 5 s is the boundary value of most user load tolerance. The visibility of progress bar loading schedule may increase the level of anxiety for part of users. The loading time of 10.0 s has exceeded most users’ tolerance range. Progress bar loading lets users see the completion of loading, which appeases user’s waiting psychology to some extent. Circle loading is the most common loading method in daily life. It has neither the fun of fun loading nor the schedule visibility of progress bar loading. When the loading time is 5.0 s, the invisibility of its loading schedule does not bring too much pressure to user psychology, so the mean of waiting time-distances estimated of circle loading is shorter than that of progress bar loading. When the loading time is 10.0 s, the simple and boring loading method becomes its biggest disadvantage, resulting in the longest mean of waiting time-distances estimated.
In general, fun loading effectively shortens user’s perception of waiting time and makes the load waiting no longer boring, improving the “peak” experience during loading with its vivid animation.
5 Experiment 2: Study on Design Experience of Network Abnormal Page
5.1 Experiment Purpose
The purpose of this experiment is to study the influence of text and graphics on the user experience of network abnormal page, and the influence of gender difference on the experience of both text and graphics.
5.2 Experiment Method
In this experiment, we collected and produced 20 network abnormal pages (see Fig. 7) in the early stage and distributed them in the form of questionnaires. The five-point scale method was used to rate the graphic design, text expression and the overall of 20 pages. (1-experience is not good, 2-experience is not very good, 3-neutral, 4-experience is not bad, 5-experience is very good).

Questionnaire samples of network abnormal pages.
5.3 Analysis of Experiment Results
The participants of this experiment were consistent with experiment 1, with a total of 60. There were 57 valid data, including 31 men and 26 women, with an average age of 23.4 years old and a standard deviation of 1.753.
The 20 pages were grouped by ABCD from two angles of graphic design and text expression, and each group had five pages, as shown in Table 4.
Table 5 shows the score mean of 20 network abnormal pages from three angles. It can be seen that the overall score mean of 9 pages is more than 3. The experience tends to be positive. Eight of them belong to the design of colorful interesting pictures. The means of each group are calculated according to grouping (see Table 6). It can be seen that the score means of group A and group C are lower than 3 and the experience tends to be negative. The score means of group B and group D are higher than 3 and the experience tends to be positive. From the score mean of group B and group C, it can be seen that colorful and interesting graphic designs can make up for lack of expression, making the overall experience of network abnormal pages tend to be positive (overall score mean >3). However, good text expression does not make up for simple and tasteless graphic design, and the overall experience of network abnormal pages tends to be negative (overall score mean <3). Words and pictures are recognized through human visual system, and words need to be understood. Everyone may have a different understanding on words because of individual differences. Pictures present a more intuitive and informative content. The reasonable collocation of color can improve the overall appeal of pictures, so users are more sensitive to pictures. It can be seen that the quality of graphic design has a greater impact on user experience.
Tables 7 and 8 show the mean of network abnormal page scores in text expression and graphic design, respectively. The mean of women’s scores are higher than that of men in various aspects, but there is no significant difference. Therefore, gender difference has little influence on the experience of graphic design and text expression.
6 Conclusion and Prospect
Based on the above analysis, it can be concluded that fun loading can shorten user’s estimation of waiting time more than circle loading and progress bar loading, reduce the anxiety in the waiting process, and thereby improve the experience of “peak” moment. In the design of network abnormal page, graphic design is more important than text expression. Reasonable color matching and interesting and cute design can placate users when they face the abnormal state of network, and thereby improve the experience of “end” moment.
Although this paper studies how to improve user experience of “peak” and “end” moment in loading waiting from the perspective of Peak-End Rule, data loading page and network abnormal page are just two types of App’s blank pages. Therefore, future research will consider selecting other App blank pages as objects to study, and enrich the application of Peak-End Rule in the design of App blank page.
References
Chen, Y., Xiangyang, X., Hu, W.: Improvement design of the car ticket dispenser interface on the basis of peak-end rule. Packag. Eng. (6), 57–61 (2016)
Zhang, L., Zhang, Y.: The improvement of 404 error page based on “peak-end rule”. Packag. Eng. (24), (2012)
Chien, S.Y., Lin, Y.T.: The effects of the service environment on perceived waiting time and emotions. Hum. Factors Ergon. Manuf. Serv. Ind. 25(3), 319–328 (2015)
Baker, J., Cameron, M.: The effects of the service environment on affect and consumer perception of waiting time: an integrative review and research propositions. J. Acad. Mark. Sci. 24(4), 338–349 (1996)
Zheng, J.: The waiting experience design research of loading page. Art Des. (1) (2016)
He, R., Fu, Y.: Mobile APP page loading methods based on time perception. Packag. Eng. (18) (2017)
Thomas, E.A.C., Weaver, W.B.: Cognitive processing and time perception. Atten. Percept. Psychophys. 17(4), 363–367 (1975)
Chu, Y., Feng, C., Ji, W.: The impact of length of duration and change in velocity on duration perception of progress bars. Psychol. Sci. (2) (2014)
CNNIC: The 40th Statistical Report on the Internet Development in China in 2017. http://www.199it.com/archives/619827.html. Accessed 04 Aug 2017
Tencent “mobile page user behavior report”. https://socialone.com.cn/tencent-mobile-page-user-behavior-report-2016/. Accessed 29 Mar 2016
Author information
Authors and Affiliations
Corresponding author
Editor information
Editors and Affiliations
Rights and permissions
Copyright information
© 2018 Springer International Publishing AG, part of Springer Nature
About this paper

Cite this paper
He, C., Ji, Z. (2018). Study on the Application of Peak-End Rule in the Design of App Blank Pages. In: Rau, PL. (eds) Cross-Cultural Design. Methods, Tools, and Users. CCD 2018. Lecture Notes in Computer Science(), vol 10911. Springer, Cham. https://doi.org/10.1007/978-3-319-92141-9_10
Download citation
DOI: https://doi.org/10.1007/978-3-319-92141-9_10
Published:
Publisher Name: Springer, Cham
Print ISBN: 978-3-319-92140-2
Online ISBN: 978-3-319-92141-9
eBook Packages: Computer ScienceComputer Science (R0)