
Abstract
Objective By summarizing the visual characteristics of the elderly and intelligent kitchen appliances, and combing with the methods of experimental psychology and evaluation of Kansei engineering image, this thesis objectively designed the visual test of the interface information of intelligent kitchen appliances for the elderly in order to provide the design reference and experimental methods for the subsequent interface visual design of intelligent product. Methods The visual tests board was used to obtain the sample material of preference experiment. By using the paired comparison method from psychology experiment methods, this thesis obtained the preference rank by the testee towards the experimental samples twice, then the preference rank was sorted for POZ score conversion to obtain the quantitative preference data. Finally, SPSS statistical software was used to analyze the preference experiment data, in order to summarize the preferences of the elderly on the color information and figure information of the kitchen appliance interface. Conclusion Based on the conclusion of the visual preference experiment, the interface information design strategy of intelligent kitchen appliance was concluded on the basis of the visual preference of the elderly, which provided design guidance for subsequent intelligent product interfaces GUI compliant to the preference of the elderly.
You have full access to this open access chapter, Download conference paper PDF
Keywords
- The elderly
- Visual characteristics
- Intelligent kitchen appliances
- Interface design
- Preference experiment
1 A Study of the Visual Characteristics and Preferences of the Elderly
Along with the increasing age, the visual senses of the elderly also experienced varying degrees of degeneration. Modern medical research showed that with the decline of the physiological function of the elderly, the organism of the eye structure would show different forms of aging. Among the various types of visual degeneration in the elderly, the most significant one was visual acuity weakness. Visual acuity was ‘vision’, which was the visual system’s ability to distinguish visual information. As the corneal diameter of the elderly was getting smaller and flatter, its ability to regulate the optic nerve gradually reduced, eventually leaded to reduced visual acuity of the elderly [1]. At the same time, due to the aging of the eye ciliary muscle of the elderly, the transparency of the crystalline lens was weakened and the visual acuity of the light response also gradually declined. According to the literature, the 60-year-old people received only about 33% of the natural light of what he received when he was 20. While the 70-year-old people could only receive 12% of what he received when he was 20. As to the 80-year-old people, the visual acuity of the optical response to the light at daytime and night was almost close to 0% [2]. In addition, as the visual acuity of the elderly declined, their visual perception ability was also gradually declining, and the ability of capturing, receiving, recognizing and understanding visual information was greatly reduced. Based on this, this thesis combined the relevant theories of clinical research and concluded the visual and physiological characteristics of the elderly as three levels, namely: visual organ aging, visual pathological characterization and visual ability declining (Table 1).
The weakened visual physiologic phenomena of the elderly also triggered mental characteristics of the elderly at mental level. It could be said that the visual and psychological characteristics of the elderly were generated by physical changes in the visual and physical characteristics [3]. In short, the reduction of visual acuity in the elderly directly affected the acquisition and cognition of visual information, which made the elderly anxious and depressed during the declining of their living ability and triggered the psychological reaction of depression and loneliness. Therefore, in order to improve and alleviate the negative emotional effects caused by visual dysfunction in the elderly, psychology data showed that the elderly should at least receive and recognize the most basic visual information of the physical form of the objects in the outside world. By completely receiving and identifying visual information, the positive and optimistic psychological feelings of the elderly would be triggered, and the germination of negative emotions would be reduced. To meet the needs of visual information reception and recognition, besides extracting the explicit features of the visual physiology of the elderly, it was necessary to further explore the hidden features of the visual psychology of the elderly, which was to clarify the visual preferences of the elderly.
French philosopher Merleau-Ponty once made it clear that ‘the so-called vision refers to the perceptual response that the visual system of the human uses visual sense as the output channel, after a variety of experiences, and transmits the visual information to our brain; And preference is a kind of inner feelings and tendencies hidden in people, which is closely related to the humanity factors such as people’s life experience and regional culture, etc. All in all, the visual preference of human beings originates from the pursuit of truth, goodness and beauty of objective things in the outside world’. In general, the perception and cognition degree of visual information by two people could not be exactly the same. However, under the guidance of the specific use environment of products and humanistic quality background, the user’s cognition of the same visual information would produce a certain degree of convergence performance. Therefore, the visual preference this thesis focused on referred to the perceptual and personalized preferences generated by the elderly when receiving visual information in their home life.
2 Current Situation Analysis of Intelligent Kitchen Appliances for the Elderly
Intelligent kitchen appliance belonging to intelligent appliances, was an important part of the modern intelligent home system. Specifically, the so-called kitchen appliances especially referred to the household electrical appliances in kitchen environment serving for daily life. The intelligent kitchen appliance was the combination of computer information technology and traditional instrumental kitchen appliance, and the innovative home appliance product combining perception, monitoring, judgment, regulation and other executive functions [4]. Compared with the traditional kitchen appliance, the intelligent kitchen appliance emphasized more on the human-machine interaction of the products, which also made the human-machine operation interface of intelligent kitchen appliance present different visual appearances (Fig. 1). At present, there were two forms of the intelligent kitchen appliance interface on the market: the Standard User Interface (SUI) and the figureal User Interface (GUI), and the main contents of the interface were mainly control and information display. Therefore, in order to achieve the convenience of human-machine operation and the information recognition accuracy when users were using intelligent kitchen appliances, the design of a reasonable interface information was particularly important.

The interface forms of intelligent kitchen appliances.
At this stage, the elderly were putting more and more attention on kitchen electrical products. According to the ‘Research Report on the Home Appliances Needs of Chinese Elderly People in 2017’, as of the end of 2017, the elderly in China had the largest demand for kitchen appliances, and their market share far exceeded those of health-care appliances and entertainment appliances [5]. Among the three kinds of kitchen appliances, namely: cooking appliances, hygiene appliances and food processing appliances, the 60-year-olds preferred cooking appliances, and the sex ratio of the sales was close to each other, with no obvious regional differences (as shown in Fig. 2).

The sales statistics of three types of kitchen appliances in 2017.
In the meantime, Beijing CBN Data conducted randomized questionnaires and user interviews on the family ownership rate of cooking appliances in 16 provinces in mainland China in 2017. The data showed that in 10 kinds of kitchen appliances for cooking, 55 to 65-year-old middle-aged population had a higher owning rate of household electric rice cooker (Fig. 3). However, during the interview, nearly 90.3% of elderly users indicated that the first consideration when choosing and purchasing cooking appliances was the basic performance factors such as product hygiene and quality, use security and product selling price. Functional intelligent kitchen appliances were not popular. In addition, 85.7% of elderly users thought that the intelligent kitchen appliances currently on the market were too complicated in functions and did not match their demand in the actual life. And the interface information of the products was too complicated, which was hard to identify visually and operate. In summary, the research object was the human-machine interface of the intelligent household electric rice cooker. From the perspective of the elderly visual characteristics and perception preferences, it concluded the preference of visual identification of the interface color information and figure information when the elderly was using intelligent household electric rice cooker, which provided the experimental basis and design method for the design of information interface of intelligent kitchen electrical products.

The household ownership statistics of cooking appliances owned by the middle-aged and the elderly in 2017.
3 The Visual Preference Experiment on the Interface Information of Intelligent Kitchen Appliances for the Elderly
3.1 Purpose and Content of the Experiment
During the GUI design of intelligent kitchen appliances, the color information and figure information were widely used in the visual characterization of the attribute information of product functions such as start, time display, keep warm and so on. The color and figures of product digital interface design were also inseparable and closely related to the user’s visual preferences. Literature data of elderly psychology showed that a series of actions and enforcement behaviors generated by the elderly after receiving the information of the external objective substance were highly influenced by their visual perception preferences. Therefore, this experiment used the visual cognitive simulation experiment, the purpose of which was to explore the general visual preference pattern of the elderly on the color and figure information of the intelligent rice cooker through the analysis and conclusion of the visual characteristics of the elderly. It provided the experimental reference and practical basis for the interface design of intelligent kitchen appliances for the elderly in the later period.
3.2 The Orientation of the Testees Group
According to the service condition of intelligent kitchen appliances in the actual life of the elderly, the specific experimental carrier was the digital display interface of the intelligent rice cooker. This thesis set up a relatively objective screening criteria based on the testees group of this visual preference experiment: (1) the age of the testees should be between 60 and 75; (2) the minimum level of education of the testees should be junior high school; (3) a certain degree of payment ability; (4) the testees should have the life experience of using intelligent kitchen appliances in daily life; (5) the testees should not have pathological features such as no viability, dementia and so on, besides, they should not have visual impairment such as achromatopsia, hypochromatopsia, astigmatism and so on; (6) the testees should be generally adaptable to the color, figures of the kitchen appliances interface, and their perception and recognition towards the visual information should have homoplasy.
To sum up, 12 testees were selected to participate in the visual preferences of interface information experiment. The gender ratio was 50%; the age was between 60 and 75, all the testees were divided into 3 age groups, and each age group contained 4 members; all the testees were retired college teachers from Xuanwu District, Nanjing who had the life habits of cooking and with good physical condition and no visual abnormalities. In addition, all of the target testees had the general sense of acceptance towards the visual information of intelligent kitchen appliances interface, which relatively reduced the anthropic factor errors of this experiment.
3.3 Procedures and Methods of the Experiment
The basic theory of this experiment was experimental psychology theory, experimental psychology belonged to the empirical psychology system, which referred to the psychology science using objective experimental methods to study and reveal the user’s psychological phenomena and cognitive pattern, with the help of corresponding experimental equipment under the controlled condition of laboratory. The reasonable design of the psychology experimental procedure was the core of the actual operation of experimental psychology. In general, the psychological experiment procedure contained three stages as ‘experimental evidence collection, decomposition test and data analysis’. Based on this, the experiment would focus on the main stages of the psychological experimental procedure (Fig. 4), and set the matching experimental method.

Experimental process and the main stage.
During the ‘experimental evidence collection’ stage, the experiment used the experimental method named visual test board for sample collection. The visual test contents were drawn on the A4 size white background board. The specific test contents mainly included the color attributes and figureal form of the rice cooker. When obtaining samples, the visual test contents could be directly presented to the testees, and the feedback could be obtained in time so as to effectively avoid the testees’ emotional fluctuation which could influence the objectivity of sampling collection [6].
During the ‘decomposition test’ stage, the experiment used paired comparison method for experimental operation and implementation. The so-called paired comparison was to pair all the experimental samples one by one, and to present to the testees by the form of two samples in one group. That was n (n − 1)/2 pairs for test if the number of test samples was n. Since there would be certain spatiotemporal errors in the test samples during the experiment, each test pair needed to be compared twice, and the position (space error) or sequence (time error) presented by the test samples needed to be exchanged with each other, in total n (n − 1) times of comparison. Testees made a visual preference choice based on self-subjective awareness of each set of paired sample sets, and judged the better preferred sample in each test set. After all the comparisons, the test samples in each group would get higher percentage compared to the remaining samples in each group, and then according to the percentage, the user preference order scale [7] would be done. Based on this, according to the sensory characteristics of the elderly, this experiment paired the interface color of the intelligent rice cooker with the interface information elements of the figure information test set respectively, and obtained the functional properties of the intelligent rice cooker products commonly used by the elderly through questionnaires. The testees were required to select the color and figure which met their preferences and could indicate the function of the product under each product function respectively. Then the sequence of visual color and figure preferences for each function was acquired.
During the stage of ‘data analysis’, the experiment selected POZ score quantification method and sociological mathematical statistics method to make statistical analysis on the experimental data. Through the POZ score quantification table, the number of users’ preferences on the color and figure of the intelligent rice cooker was score quantified. The social economic statistics software SPSS23.0 was used to score the 12 testees’ preference degrees of the color and figures of the intelligent rice cooker interface, and a descriptive statistical analysis was adopted to obtain the visual preference of the elderly on the color and figure interface of the intelligent rice cooker.
3.4 Screening of Experimental Samples
Through the above experimental methods, this experiment finally selected the most commonly used six functions of the intelligent rice cooker display interface in the elderly by field questionnaire survey and interview analysis. The specific functional attributes were: ‘Attribute A: Start/Cancel’, ‘Attribute B: Timing/Schedule’, ‘Attribute C: Keep Warm/Pause’, ‘Attribute D: Time Display’, ‘Attribute E: Taste Selection’ and ‘Attribute F: Intelligent Pressure Control’. In addition, the intelligent rice cooker market research through the design example analysis, the initial establishment of a intelligent rice cooker interface color information samples 14, 10 figures information samples. Using the visual test board design form, the experimental test content is drawn on the A4 size white background board, and the specific content of the test is shown in Fig. 5.

Visual tests board of the interface information elements of intelligent rice cooker.
The specific test contents mainly included the color information and figure information of the interface of the intelligent rice cooker. In order to reduce the error rate of the experimental operation and the visual fatigue of the testees, the color test of the visual preference experiment would be based on the actual color of the intelligent rice cooker in the visual testing board, no further divisions on the hue, lightness, and saturation level. In addition, in order to ensure the accuracy of experimental operation and the objectivity of the experimental results, the shape sample determined by the figure test of the visual preference experiment would be the abstract geometric shape in the interface of the intelligent rice cooker, and would not be related to the iconic interface.
Under the principle of ‘majority pass’, the sample screening selected the final interface information sample of intelligent rice cooker from the visual test board, that was, the selection times by the testees of the final interface information test sample should at least exceed 50% of the total number of testees. The orientation stage of the testees had shown that the total number of participants in this experiment were 12 elderly people, so the test results of the interface color and figure information with a frequency less than 6 would be excluded. In total, there were 7 color information samples of the intelligent rice cooker excluded, as well as 3 figures information samples. The remaining 7 color and visual samples in the visual test board were rearranged to form the 14 final test experimental samples of the interface color and figure information of the intelligent rice cookers (as shown in Fig. 6).

Final test sample of the interface color and figure information of intelligent rice cooker.
After establishing the final 14 color and figure samples of the intelligent rice cookers, according to the test samples pairing method of paired comparison method, the 7 color samples and the 7 figure samples were respectively paired, and a total of 21 pairs of color and figure sample test sets were obtained. In the specific experiment, the color and figure test set actually needed to be tested twice, so the color and figure test set needed to be tested 42 times respectively (Table 2).
3.5 Equipment and Environment of the Experiment
The experimental hardware was mainly the computer, and the specific parameter configuration was as follows: the operating system was Win7 64-bit, the CPU was Core(TM)i5-2410 M, the dominant frequency was 2.30 GHz, and the memory was 2 GB. The figure processing unit was AMD Radeon HD 6370 M, and independent 1G memory. The monitor was 32-bit true color with a 14-inch display (31 × 17CM2), a 16: 9 aspect ratio, and a full-screen resolution of 1366 × 768.
The experimental software was mainly E-prime2.0 user psychology experimental programming software which was usually used in experimental psychology. E-prime was an experimental generation system for computerized user-perception research jointly developed by the Learning Research and Development Center of the University of Pittsburgh and the U.S. PST Company. The system adopted a figureal editing interface that covered functions from experimental generation to data collection with millisecond accuracy and preliminary analysis of data [8]. This provided the experimenter with more efficient and convenient operation, and human-machine interface with the perception information of figures, color, sound, dynamic effect and other perceptions. Based on this, in this experiment, the program could automatically present the experimental materials of color and figure for comparison to the testees under the instruction of the functional attributes of the specific intelligent rice cooker, and record the reaction results of the testees at the same time. This visual preference experiment was wholly conducted on the computer. In order to ensure the universality and objectivity of the experimental results, the experimental environment was normal environment, reducing the physical stimulation and psychological interference of the testees in the experimental environment.
3.6 Process and Statistics of the Experiment
The process of the experiment was divided into four main steps. The testees were required to choose 6 kinds of interface color and figure which could present the function and attribute of the intelligent rice cooker best according to individual preference on the PC. The specific steps were as follows,
-
Step 1: 12 testees were required to seat in front of the computer, keeping the head at a distance of about 90 cm from the center of the display and the line of sight plane intersecting with the display.
-
Step 2: The background of experimental test interface was white, and at the center of the screen there was a white cross. The testees were required to focus on the center of the screen all the time (Fig. 7).
Fig. 7. 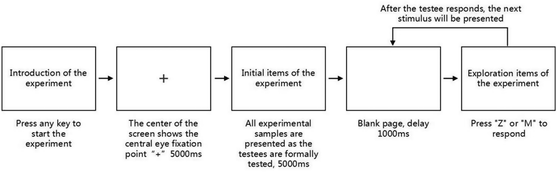
E-prime experimental program chart.
-
Step 3: At the beginning of each function attribute test, the general instruction words and the specific task instructions were displayed. Then from the color test set and the figure test set, random sampling without replacement was conducted. The horizontal spacing of the 2 test samples of each set was about 8 cm. For a specific combination of colors and figures, testees were asked to choose the colors and figures which were more suitable to represent the state of the function attributes according to the guideline. In the meantime, in order to reduce the azimuth error of every two color (figure) samples during the test, as for each group of test samples, it needed to be selected twice in succession, and the 2 samples in each group needed to be replaced. The specific implementation process (function attribute A ‘start/end’ as an example) was as follows: Please compare the following two colors (figures), you are more inclined to use what kind of interface colors (figures) to characterize the “End” function of the intelligent rice cooker, press the computer key ‘Z’ or ‘M’ indicating the color (figure) of the interface according to your preference (Figs. 8 and 9).
Fig. 8. 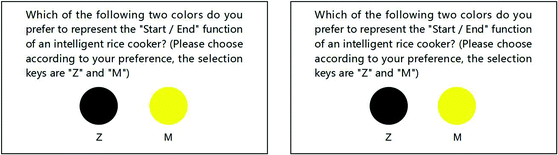
2 times of visual preference test steps of the interface color of intelligent rice cooker.
Fig. 9. 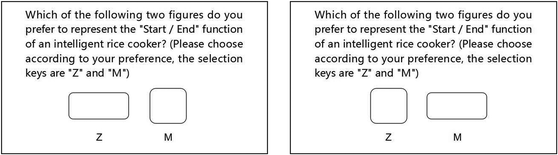
2 Times of visual preference test steps of the interface figure of intelligent rice cooker.
-
Step 4: After the testee 1 completed a group of preference experiments, the next testee was required to repeat the steps 1–3. After completing a group of tests, the experimental program would automatically record the preference results of each testee. When all 12 subjects finished the 2 visual preference experiments of color test set, the above three steps were followed to carry out the experiment of interface figureal visual preference.


Because there was many actual operations of this experiment, this research would take the intelligent rice cooker function attributes A: start/end as an example, to conduct a detailed analysis of the experimental process. Through the operation steps above, the experiment statistically summarized the 84 preference results chosen by the 12 testees towards the color and figure of the attribute A interface of the intelligent rice cooker. The statistical results were shown in Table 3 (due to the limited space of the thesis, only a part of statistical lists was provided here).
Due to the statistical number of visual preference experiments was not conducive to more accurate data analysis, so the above statistics of preference results chosen by the testees was calculated by POZ conversion table which proved the preference value Z of each color and figure chosen by the testees under the 6 functional attributes. The testee 1, for example, in the actual calculation process, C presented the number of choices, P presented the percentage. The specific value of Z could be found according to the POZ conversion table, with a minimum of 0. After eliminating the negative, the final preference value Z’ of the color and figure of the intelligent rice cooker was calculated (Table 4). According to the above calculation method, the experiment calculated the preference scores of the interface’s color and figure which was chosen twice by the 12 testees towards the 6 functional attributes of the intelligent rice cooker experimentally. Here, the quantitative preference results of the partial interface information chosen by 12 testees towards functional attributes A was provided (as shown in Table 5).
The quantification of preference scores of the interface colors (figures) by the above 12 testees was put into the socio-economic statistical software SPSS 23.0 for descriptive statistical calculation to obtain the average information preference, standard deviation and variance and other statistical data by the 12 testees on the interface of 6 functional properties of the intelligent rice cooker. According to the statistical results of SPSS mean value, the overall preferences of the interface color and figure of the intelligent cooker by the 12 elderly were further obtained. Here, taking the function attribute A of the intelligent rice cooker as an example, this experiment provided the corresponding statistical results (Table 6).
From the average score of the above statistical tables, it clearly showed that the preference rank of the interface color chosen by the 12 testees towards the functional attribute A: start/end of the intelligent rice cooker was C7, C4, C2, C5, C3, C6 and C1. Among them, the mean value of C7 sample was 2.409, while the average of C1 sample was 0.065, which meant that in the above 7 color samples, 12 tested elders generally believed that C7 could most directly reflect the ‘start/end’ function of an intelligent rice cooker, while C1 could hardly characterize the ‘start/end’ function of intelligent cooker. In the meantime, the preference rank of the interface figure chosen by the 12 testees towards the functional attribute A: start/end of the intelligent rice cooker was F6, F4, F1, F5, F7, F3, and F2. Among them, the mean value of F6 sample was 2.353, while the average of F4 sample was 0.098, which meant that in the above 7 figure samples, 12 tested elders generally believed that F7 could most directly reflect the ‘start/end’ function of a intelligent rice cooker, while F2 could hardly represent this functional attribute.
3.7 The Results Analysis and Discussion of the Experiment
Through the above experimental results, this experiment integrated and ranked the visual preference of the interface color and figure information of the 6 functional attributes of the intelligent rice cookers by the 12 tested elders, and drew the corresponding statistical line chart. The dynamic distribution of the interface color and figure preference degree of 6 functional attributes was shown in Fig. 10 and 11. The statistical line chart could clearly reflect the integrated visual preferences of the elderly towards the interface color and figure of intelligent rice cooker.

6 kinds of functional properties of interface color preference distribution of intelligent rice cooker.

6 kinds of functional properties of interface figure preference distribution of intelligent rice cooker.
According to the above statistical chart, this experiment summed up the mean value rank of the interface information preference of the 6 functional attributes of the intelligent rice cooker by the 12 tested elders. The specific statistical conclusions were shown in Table 7.
From the above table, the experimental conclusion of this visual preference experiment could be drew:
First of all, from the preference rank of the interface information of intelligent rice cooker showed that the elderly generally believed that the C7 interface, which was red, was most suitable for representing the 5 functional attributes of intelligent rice cooker ‘Start/Cancel’, ‘Timer/Reservation’, ‘Keep Warm/Pause’, ‘Taste Selection’ and ‘Intelligent Pressure Control’, and C3, which was gray, was most suitable for representing the ‘Time Display’ function. At the same time, in the preference choosing of interface figure, 12 elderly generally agreed that the F6 interface figure, which was rounded square, was most suitable for representing the 5 functional attributes of the intelligent rice cooker ‘Start/Cancel’, ‘Timer/Reservation’, ‘Keep Warm/Pause’, ‘Taste Selection’ and ‘Intelligent Pressure Control’, and F1, which was rounded rectangle, was most suitable for representing the ‘Time Display’ function. In addition, the tested elders indicated that the interface color C1 and the interface figure F2, that is, the black and the triangle, were not suitable for representing the 6 functional attributes of the intelligent rice cooker. From the in-depth interviews of the users, 12 tested elders generally believed that the black was too dreary, and it was easy to be blurred with the background of the computer numerical control interface of the intelligent rice cooker. And the triangle was too strange to act as a touch button.
Secondly, among the 6 kinds of functions of the intelligent rice cooker commonly used by the elderly, the rank of the interface color of partial functional attributes and the preference of the figure information presented a state of common preference by the users. Specifically, all the color preference rank of the interface of attribute B ‘Timer/Reservation’ and attribute C ‘Keep Warm/Pause’ was the same as: C7, C4, C5, C2, C3, C6 and C1; all the figure preference rank of the interface was the same as F6, F4, F1, F7, F5, F3, and F2. At the same time, the color preference of the interface of attribute E ‘Taste Selection’ and attribute F ‘Intelligent Pressure Control’ were all ranked as follows: C7, C5, C4, C2, C3, C6, and C1; all the figure preference rank of the interface was the same as F1, F3, F5, F7, and F2. From the indepth interviews of the users, 12 tested elders believed that although functional attributes B and C, E and F had different operation functions in the intelligent rice cooker interface, the layout, position and number in the CNC interface were relatively uniform. So there was a common understanding and similar preferences of the elderly on the interface color and visual morphology of figures. Therefore, the interface information preferences rank of intelligent rice cooker functions chosen by the two groups showed the same tendency.
Finally, among the 6 kinds of functions of the intelligent rice cooker commonly used by the elderly, there was a big difference in preference rank of attribute D ‘Time Display’ and other five kinds of functions. The interface color preference rank of the attribute D was: C3, C6, C5, C4, C7, C2, and C1; the figure preference rank of the interface was F1, F5, F3, F7, F4, F6, and F2. That is, all 12 elders agreed that the gray and chamfering rectangle were best suited to represent the ‘Time Display’ function, whereas black and triangle were least suitable for representing this function. Through interviews with the users, 12 tested elders indicated that due to the position and large proportion of interface area of the ‘Time Display’ function in the digital interface of intelligent rice cooker, in order to help the elderly identify the time information during actual operation, the more complete form of the chamfering rectangle should be selected as the time display figure, while gray, with high color saturation should be selected as the theme color of the information to enhance the sense of coordination of visual comfort for the elderly.
4 Conclusion
Today’s intelligent kitchen appliances had gradually infiltrated into all aspects of people’s daily life. It could be said that intelligent kitchen appliances had become an important part of the intelligent home system in the information age. However, for the elderly, how to effectively identify the interface information of intelligent products so as to accurately use and operate the intelligent products was the most important requirement of the elderly.
In this thesis, the visual characteristics of the elderly were summarized, and the preference factors in the visual characteristics were clarified. Based on the analysis of the status quo of the intelligent kitchen appliances commonly used in the elderly, the representative digital interface of the intelligent rice cooker was selected as the research carrier. By using experimental psychology research method and E-prime experimental program and paired comparison method, this thesis deeply explored the rules of color and figure visual preference of the elderly on the common functions of intelligent rice cooker, in order to provide design guidance for GUI design of the product interface of intelligent kitchen appliances. After understanding the visual preferences of the elderly on the interface information of intelligent kitchen appliances, the designer could acquire the emotional needs for the interface information of the elderly more accurately and thus make the rational design of the interface of intelligent kitchen appliances more suitable for the elderly. Of course, the intelligent kitchen electric interface involved in this thesis was exemplified by the intelligent rice cooker interface, the main empirical analysis was about the color information and figures information of the interface.
In the follow-up study, the author would conduct a multi-dimensional preference research of the information interface for the elderly to accomplish a more comprehensive intelligent product interface design suitable for the elderly from aspects such as interface text information, layout information, material information and information architecture and so on.
References
Wang, L.-L.: Friendly website design for seniors. J. Gerontechnol. Serv. Manag. 3(1), 15–20 (2015)
Zhi, Y.: Research summary on character, color and layout design for the elders. Zhuang Shi 5, 86–87 (2012)
Dongmei, H.: Journal of Geropsychology. Study Press, Beijing (2017)
Kai, X.: Analyzing Usability of Smart Kitchen Appliances Interface Based on The User Mental Model. Zhejiang University of Technology (2013)
Wu, X., Wei, Y.-Y., Qu, J.: Analysis and counter measure research on the status quo of chinese aging products industry. Res. Cent. Aging 11, 14–21 (2015)
Mingshun, E.: Research on the interactive design of digital interface for aged products based on visual features. Nan Jing University of Science & Technology (2014)
Yan, L.: Study on the optimized design of locomotive CAB visual interface based on driver’s color preferences. Southwest Jiaotong University (2015)
Zeng, X., Chen, J.: E-prime DOE Techniques. Jinan University Press, Guang Zhou (2014)
Acknowledgement
This study is supported by the Project supported by the National Social Science Foundation of China (Project No. 16BSH127).
Author information
Authors and Affiliations
Corresponding author
Editor information
Editors and Affiliations
Rights and permissions
Copyright information
© 2018 Springer International Publishing AG, part of Springer Nature
About this paper

Cite this paper
Wu, Ty., Zhao, Yq., Li, Yj. (2018). An Experimental Study on Intelligent Kitchen Appliances’ Interface Information Preference Based on Visual Characteristics of the Elderly. In: Zhou, J., Salvendy, G. (eds) Human Aspects of IT for the Aged Population. Applications in Health, Assistance, and Entertainment. ITAP 2018. Lecture Notes in Computer Science(), vol 10927. Springer, Cham. https://doi.org/10.1007/978-3-319-92037-5_33
Download citation
DOI: https://doi.org/10.1007/978-3-319-92037-5_33
Published:
Publisher Name: Springer, Cham
Print ISBN: 978-3-319-92036-8
Online ISBN: 978-3-319-92037-5
eBook Packages: Computer ScienceComputer Science (R0)