
Abstract
In order to study pilots’ behavior characteristics, two pilots of a certain airline were selected as research subjects. Two typical tasks in recurrent training were selected for the experimental scene. One was an aerodrome-traffic pattern under a normal situation; the other was an aerodrome-traffic pattern in the case of a large crosswind. Using multi-angle video recording, all details of the two pilots’ operation in the training simulator (B737-800) were recorded completely. Using Noldus’s Observer XT 12.0, a preliminary analysis of typical operational behaviors was performed, including the control behaviors of the pitch, yaw, and roll movement, as well as the throttle lever movement. The coding scheme and the data visualization of these behaviors were also presented. Finally, combing the statistics, a depth-comparison analysis of these behavior characteristics was conducted in terms of many aspects, including mean duration, total number, rate per minute, percentage of total duration, and so on. The results show that the pilot’s pitch and roll controls have larger differences in mean duration, total number, rate per minute, and percentage of total duration; however, there were no significant differences in other behaviors between tasks.
You have full access to this open access chapter, Download conference paper PDF
Keywords
1 Introduction
“Aviation safety” is a topic of perpetual research in the aeronautical field. Government administrations, aircraft manufacturers, and airlines have been working hard to improve the safety of aircraft. Whether it is structural improvements, new electronic devices, or new means of communication, the aim is to pursue higher security and to maximize economic interests in ensuring safety [18]. The reliability of aircraft has been greatly improved, which profited from the development of aviation design and manufacturing and aviation safety has increasingly considered human factors. Statistics from different sources indicate that crew errors have always been the main cause of civil-aviation accidents [1]. Therefore, it is of great significance to study the operational behaviors of pilots and to analyze their characteristics during flight.
There have been many pilot-behavior studies. Internationally, Bonomalenko et al. [2] considered operational behavior as elements of pilot action in his book, Flight Psychology, and summarized pilot operation in terms of integrity, accuracy, timeliness, flight image, and a series of features. Liu and Liu [12], using a developed psychological scale for civil-aviation pilots, designed a flight-behavior-observation system using VB and Access to realize the functions of testing, result inquiry, data management, statistical analysis, and user management and provide an experimental platform to psychologically assess pilots and pilot cadets. Hayashi et al. [8] built up a neural-network model based on genetic-algorithm optimization using a simulator to obtain flight data, and analyzed the pilot’s behavior in terms of the sensitivity and threshold of this model. The results revealed the operational-behavior rule of the pilot. Chen and Wang [3] proposed a unique frequency-domain-analysis method based on simulated experimental data to reflect the pilot’s activity frequency and activity level after setting the cut-off and power frequencies of pilot flight-control behavior as key indicators. Smith et al. [19] introduced common methods and techniques for pilot-behavior modeling. Keane [11] proposed an extended Lancheste equation-evaluation method based on partial differential equations. Hillard et al. [9] proposed a pilot-behavior-assessment method, mainly used in the field of information extraction.
Chinese scholars have also been involved in this research. He et al. [7] analyzed flight accidents and incidents caused by crew error between 1996 and 2000 based on records from the Civil Aviation Administration of China and selected cases that are closely related to the time margin for problem solving; they discussed these cases with flight experts, and drew a relationship between such incidents and crew behavior and time margin. Yin et al. [23] proposed an air-combat-pilot fighting-behavior-assessment method based on average time of air combat, dominant posture, and air-combat credibility. Chen and Tan [4] used the principle of EMG (Electromyography) and STP (Skin Temperature) detection to design pilot-behavior-analysis experiments based on electromyography and skin-temperature testing using JD/PW-5 testing equipment and the PC-based aviation-training device. Xue et al. [22] used the ACT-R (Adaptive Control of Thought-Rational) cognitive framework to model the internal mechanism for obtaining, extracting and applying the skills of civil-aircraft pilots and structured simulation modeling of behavioral integration. Luo et al. [14] discussed the relationship between psychological factors such as social-psychological quality, motivation, emotion, and personality psychology and crew-behavior errors and analyzed the psychological background of such errors; the relationship among the flight-space environment, aviation-organization management, the influence of man-machine-environment imbalance, and the influence of crew mismanagement was also discussed, and countermeasures to improve crew management were also proposed. Wu and Wang [21] proposed serial process hypothesis of human brain, set RNP APCH profile as operation scenario background, translates flight crew operation behavior into abstract mathematic model and quantitatively produces the level of dependence and strength of workload utilizing mathematic means. The work intensity of the operation and the correlation between operational tasks were quantitatively given by mathematical methods, which better described the real human–computer interaction. Liu [15] studied the operational-gesture characteristics of pilots’ intelligent model using visual-monitoring technology. The contents covered were machine-vision-based gesture detection, tracking, trajectory analysis and cockpit operational behavior analysis combined with the eye-movement characteristics of the pilots. At present, the domestic and foreign scholars’ research on pilot behavior mainly focuses on pilot behavior psychology research, pilot behavior modeling research and pilots behavior assessment. The accuracy and applicability of the research conclusions need to be improved. However, there are few researches on the basic operational behaviors between pilots in different flight training subjects through the direct behavior observation using dynamic flight simulator.
This paper uses wireless cameras and monitoring equipment in the B737-800W Full Flight Simulator to construct an experimental platform for pilot-behavior observation. Then, in training tasks under typical aerodrome-traffic patterns in the normal situation and with large crosswinds, the pilots’ behaviors are videotaped. Using the observation and analysis function of Observer XT (12), this paper aims to explore the similarities and differences in pilot behaviors under the two kinds of training tasks.
2 Method
2.1 Participants
The study involved two male-refreshment pilots (33-year-old captain, 4554-h flight experience; 26-year-old copilot, 900-h flight experience) at an airline who had good flying skills, normal vision, and good physical condition. As the data acquisition involved the human subject, this experiment was approved by the Ethics Review Committee of Civil Aviation University of China. Two pilots read the informed consent form and voluntarily signed and then participated in the trial before starting the experiment.
2.2 Apparatus
-
2.2.1
An airline’s B737-800 W Full Flight Simulator, as shown in Fig. 1-a, is mainly used for pilots’ regular refreshment. It can simulate a variety of flight missions realistically, letting the pilots act as if they were manipulating controls on a real plane;
Fig. 1. 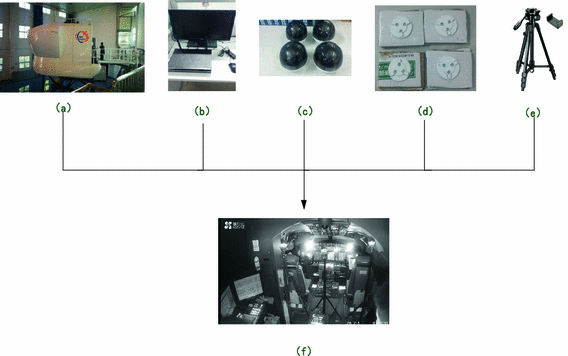
Components of the experimental platform
-
2.2.2
EZVIZ surveillance video equipment and four EZVIZ wireless cameras, as shown in Figs. 1-b and c, are used to record pilots’ manipulative behaviors in the cockpit;
-
2.2.3
Four camera bases made in-house and three tripods, as shown in Figs. 1-d and e, are mainly used to fix the camera flexibly.
According to the process shown in Fig. 1, the existing equipment is connected together to build an experimental platform suitable for observing the pilot’s behavior, as shown in Fig. 1-f.
-
2.2.4
Observer XT (12.0) - Behavioral Analysis Software: In order to be able to quantitatively analyze pilots’operational behavior, Noldus’ Observer XT 12.0 Behavioral Analysis Software is used. Unlike conventional behavioral observation devices, it can be used to record and analyze the actions of the studied subjects, Attitude, emotion, social interaction, human-computer interaction and so on. It is a standard tool for studying human behaviors to record the times, occurrences and durations of various behaviors of the subjects under study.

2.3 Research Design
Based on an airline’s B737-800W Full Flight Simulator, an experimental platform was constructed to observe pilot operations using existing equipment, and experimental design was carried out. Afterwards, the refreshment-manipulation videos of the pilots were obtained from the experimental platform in the Full Flight Simulator. Before importing the maneuvering video into the Observer XT, the pilot’s motion-coding scheme needed to be pre-defined. Then, the pilots’ behaviors were analyzed by the developed coding scheme and compared under different tasks. Specific research ideas are shown in Fig. 2.

Study framework
2.4 Data Collection and Analysis Processes
2.4.1 Data Collection Processes
-
(1)
The B737-800 W Full Flight Simulator’s Cockpit and the surveillance-video equipment are activated.
-
(2)
The matters needing attention in this experiment are explained.
-
(3)
An aerodrome-traffic circuit under the normal situation is set up on the control computer by the pilot instructor, and the airplane is set directly on the runway end, eliminating taxiing from the air bridge to the end of the runway and simplifying the experimental process.
-
(4)
After the pilot instructor has issued the “take-off” command, the two pilots operate according to the established procedure and route, which is the only time that communication between the crew members and between the flight crew and the controller is allowed; silence should be maintained for the rest of the process so as not to affect the pilots’ normal operation.
-
(5)
The task of the aerodrome-traffic pattern ends under the normal situation, when the plane lands on the runway and comes to a stop.
-
(6)
After three minutes of rest, the pilot instructor sets up an aerodrome-traffic pattern of large crosswind on the control computer and pulls the plane directly to end of the runway.
-
(7)
After the pilot instructor has issued the “take-off” command, the two pilots should operate according to the established procedure and route, which is the only time that communication between the crew members and between the flight crew and the controller is allowed; silence should be maintained for the rest of the process so as not to affect the pilots’ normal operation.
-
(8)
The aerodrome-traffic-pattern task ends under large crosswind when the plane lands on the runway and comes to a stop.
-
(9)
The surveillance-video equipment is deactivated, and then it is removed and packaged.
Matters needing attention: before starting the experiment, it is important to ensure that all experimental instruments are working properly and that the camera can capture clear video of the pilots’ operations.
2.4.2 Analysis Processes
-
(1)
Coding and defining the pilot’s behavior
Before observing the record, the pilot’s behaviors need to be coded. By reading the “Airplane Flying Handbook” [6] and watching the “Pilots Eye” videos, pilots’ characteristics, including Holding, Landing-gear Setting, Throttle Control, Steering-column Control, Flap Setting, Speed-brake Setting, Rudder Setting, and Thrust-reverser Setting, are all extracted.
Based on the pilots’ extracted behavioral characteristics and combined with the code rules of the ‘Codings’ of the Observer XT software instructions, the pilot’s behaviors are divided into four continuous behavior groups (including Pitch Control, Roll Control, Yaw Control, and Monitoring) and a start–stop behavior group (Other behaviors). Behavior groups and specific definitions of behaviors are shown in Table 1.
-
(2)
Behavioral observation records
Custom behavior codes are applied to observe and record the pilots’ manipulations under the two tasks and Fig. 3 presents a screenshot. In Fig. 3, the observation time of the aerodrome-traffic pattern under the normal situation is 792.95 s, and that under large crosswind is 456.16 s.

Screenshot of the pilot’s behavior observation record
-
(3)
The mean duration, total number and the proportion of each behavior under the two tasks
By clicking the “Calculate” option in the Behavior Analysis Function, one can count the total durations of each pilot behavior, as well as the total number of occurrence. Because the time consumption of the two flight tasks is inconsistent, it is not appropriate to directly compare the total duration and total number of each operational behavior. Therefore, we need to transform the data into the same standard form using formulas (1), (2) and (3), and then compare them [5].
Formula (1) is used to calculate the number of occurrences of each behavior per minute, known as the rate per minute (RPM):
Formula (2) is used to calculate the total duration of each behavior as a percentage of the total observed duration:
Formula (3) is used to calculate the mean duration of each behavior:
3 Results and Discussions
Pilot control behaviors are directly affected by the internal and external environment and the controlled object [4]. This study is different from previous studies which adopt expert investigation and literature review to design flight control behavior training and evaluation tools [14, 23], use semi-quantitative method for flight crew resource management behavior and workload evaluation [13], use computer technology to the pilot manipulation simulation experiment to research (see, for example, [22]) and so on. It uses the Observer XT (12) to quantitatively describe the process of pilots’ controlling behaviors of aerodrome traffic patterns in the normal situation and the large crosswind, in ensuring data acquisition under that the condition of internal and external environment is not affected to find out the specific differences between the pilots’ operating behaviors of the two tasks in the cockpit. The following results and discussions are made from the differences in visibility charts of the behavioral data, Rolling control, pitching control, and other behaviors.
3.1 Visibility Charts of the Behavioral Data
After observing and recording the pilots’ manipulation video, the “Visual” option of the software can automatically generate the visibility charts of aerodrome-traffic patterns in the normal situation and in that with large crosswinds, as shown in Figs. 4 and 5. In the generated visibility charts, each rectangular strip represents the occurrence of an encoding action, and the length of each rectangle represents its duration [25].

Visibility Chart of the pilots’ behaviors in the normal aerodrome-traffic pattern

Visibility Chart of the pilots’ behaviors in the large-crosswind aerodrome-traffic pattern
Under a normal aerodrome-traffic pattern, it can be seen from the pilot-behavior-visibility chart that in the two time periods of 0–180 ms and 660–790 ms, there are many more rectangular strips in the roll-control and pitch-control behavior groups than between these periods. This also means that pilots manipulate the pitch and roll of the aircraft during the takeoff and landing phases more frequently.
Under the large-crosswinds aerodrome-traffic pattern, the chart shows that the pilot exerts more control over the pitch and roll of the aircraft than in the normal case over the whole period.
Through the data analysis process, the statistic tables of each behavior data of pilots under two different tasks are generated, as shown in Tables 2 and 3, respectively.
3.2 Rolling Control Differences
The roll control group includes the compressive bar to the left, the compressive bar to the right, and roll neutral manipulation. According to Fig. 6, it is found that the proportion of keeping neutral roll in the case of large crosswinds is 18.10%, compared with 70.53% under normal situations, which is obviously less than that under normal situations. In the behavior of the compressive bar to the left and right, the compressive bar to the left and right accounted for 43.91% and 37.99% respectively of the large crosswind condition. However, under normal situations, the compressive bar to the left and right accounted for 17.02% and 12.45%. It can be seen that in the case of large crosswind, the behavior of the compressive bar to the left or right is significantly more than normal. By comparing the RPMs of the behaviors in the roll-control group in Tables 2 and 3, it can be seen that the RPMs of behaviors to maintain roll-neutral behavior do not differ significantly between the two tasks, respectively 2.04 times per minute in normal situation and 2.69 times per minute in the large crosswind, whereas the RPM of moving the compressive bar to the left or right is obviously higher in the case of a large crosswind. Combining the above two points, it can be found that in the case of a large crosswind, both the proportions of behaviors’ duration and the RPM devoted to moving the compressive bar to the left and right are larger than in the normal situation.

The comparison of pilots’ roll-control behaviors for each of the two tasks
3.3 Pitching Control Differences
The pitch control group includes the pulling back on the stick, the pushing the stick forward, and pitch neutral manipulation. According to Fig. 7, it is found that the proportion of keeping neutral pitch in the case of large crosswinds is 14.77%, compared with 65.84% under normal situations, which is obviously less than that under normal situations. In the behaviors of the pulling back on the stick and the pushing the stick forward, the pulling back on the stick and the pushing the stick forward accounted for 38.95% and 43.36% respectively of the large crosswind condition. However, under normal situations, the pulling back on the stick and the pushing the stick forward accounted for 17.02% and 12.45%. It can be seen that in the case of large crosswind, the behavior of pulling or pushing the stick is significantly more than normal. By comparing the RPMs of each behavior in the pitch-control groups in Tables 2 and 3, one finds that RPMs that pitch-neutral-maintaining behaviors do not differ significantly between the two tasks, whereas pushing and pulling of the throttle lever occur with greater frequency in the large-crosswind case. Combining the above two points, it can be found that in the case of large crosswind, the throttle lever is pushed and pulled more frequently and for higher proportions of behaviors’ duration.

The comparison of pilots’ pitch-control behaviors for each of the two tasks
3.4 Other Behaviors
Through the calculation, the statistics for each pilot behavior under the two tasks are generated, as shown in Tables 2 and 3. Comparison of the tables shows that, in other behavior groups, the proportions of six behaviors (Release parking brake, Close the landing gear, Landing Gear Down, Speed-braker Arming, Turn on the Reverse Thrust and Retract the Reverse Thrust) are less than 1% for both tasks and there is no difference in the frequency of occurrence.
The process of aircraft manipulation is a closed- loop human-machine interaction process including the display and acquisition process of task information, the cognition process of pilots, the execution process of mission actions, and the information processing process of flight control computer. Aiming at the process of aircraft manipulation, Liu used the basic elements of colored Petri nets to describe the manipulative dynamic process, built the manipulation process model based on colored Petri nets and put forward the corresponding task reachability, cognitive load and entropy-based method of evaluating the complexity of the program [17]. Unlike above, this paper selected the task execution process and referred to that Sun et al. proposed the idea of quantitatively evaluating the pilot’s operation level [20]. The pilot’s operation behaviors in the cockpit are divided into continuous behavior groups (Pitch Control, Roll Control, Yaw Control) and start-stop behavior groups (Release parking brake, Close the landing gear, Landing Gear Down, Speed-braker Arming, Turn on the Reverse Thrust, Retract the Reverse Thrust and so on). And then each operational behavior is defined, and a coding scheme is constructed. With the help of Observer XT (12.0) and statistical methods, the collected videos are quantitatively recorded to analyze the total number, mean duration, total duration, the number of occurrences per minute and the proportion of each behavior duration of pilots during two tasks. Compared with a previous study on pilots’ verbal behavior by using Observer XT software, it enriches the behavior code of pilots, records pilots’ manipulation behavior from multiple angles, and conducts in-depth research on pilots’ main operation behaviors. Through the above the results show that compared with the normal aerodrome-traffic pattern, the RPMs and proportions of four kinds of behavior (Pull back on the stick, Push the Stick forward, Compressive bar to the left, Compressive bar to the right) are significantly more and operations are more complicated under large-crosswind aerodrome traffic; the total number of occurrence and proportions of six kinds of behavior (Release parking brake, Close the landing gear, Landing Gear Down, Speed-braker Arming, Turn on the Reverse Thrust and Retract the Reverse Thrust) are no difference in two tasks. This quantitative validates the cognitive that compared with the normal situation, the case of a large crosswind need to consider more factors, the technology is more complicated [24]. At the same time, from the point of view of engineering application of aviation safety, for the first time, the coding scheme was developed for the pilot’s behavior, providing new ideas for studying pilots’ specific behaviors, which laid a certain foundation for the future application of Observer XT(12.0) software to study the pilot’s behavior. However, this paper only uses Observer XT (12.0) to conduct preliminary research on pilots’. The study on the pilot’s behavior still needs to be further deepened, mainly in terms of quantitative analysis, which makes it better applied to the study of human factors of aviation safety.
4 Conclusion
Pilot’s operational performance has a direct impact on flight safety. Using Observer XT (12.0) to study the pilot’s cockpit’s operational behavior can reduce interference with the pilot’s current activity, ensure the objectivity and accuracy of the analysis and, to the maximum extent, ensure that the behavior we want to observe is not impacted of additional variables in the environment. More than 20 years after its birth, this software has been widely used in human factors research [10] and human-computer interaction research [16]. In this paper, the study of pilots’ behavior is based on reading the “Aircraft Flight Manual” [6] and watching the “Eye of the Flight” and other methods to design pilots cockpit behavior encoding scheme. Based on the analysis of operational behavior data, we can get the following conclusions: Our developed scheme for coding pilot actions provides a useful way to quantify the pilots’ specific behaviors in the future. However, the coding scheme does not include all pilot actions and needs to be further improved; By building an experimental platform suitable for observing pilots’ behavior, the typical behaviors of pilots were analyzed by Observer XT 12.0, and the similarities and differences in pilot behaviors under two tasks were compared. This provides a method for analyzing the behavior of pilots in the future.
References
Ban, Y.K.: Aviation Accidents and Human Factors. China Civil Aviation Press (Chinese), Beijing, pp. 30–38 (2002)
Bonomalenko, B.A., Lapa, B.B.: Flight Psychology, pp. 40–43 (1988)
Chen, H., Wang, G.: Pilot control behavior analysis using cutoff frequency and power frequency for a civil transport aircraft encountering turbulence based on flight Simulation. Procedia Eng. 80, 424–430 (2014)
Chen, N.T., Tan, X.: Experimental design of pilots’ operational behavior analysis based on electromyography and skin temperature detection. Exp. Technol. Manag. 32(11), 202–205 (2015). (Chinese)
Chen, M.L.: Comparison on the teaching behaviors of expert and novice aerobics teacher. Doctoral dissertation, Wuhan Institute of Physical Education (Chinses) (2013)
Federal Aviation Administration: Aircraft Flight Manual. Shanghai Jiao Tong University Press (Chinese) (2010)
He, W., Ke, S.H., Wu, X.B., Li, X.L.: Relationship between crew behavior, time margin and flight safety. J. Saf. Environ. 3(2), 16–18 (2003). (Chinese)
Hayashi, K., Suzuki, S., Uemura, T.: Analysis of human pilot behavior at landing with neural network. J. Jpn. Soc. Aeronaut. Space Sci. 49(564), 21–26 (2001)
Hillard, D., Manavoglu, E., Raghavan, H., Leggetter, C., Iyer, R.: The sum of its parts: reducing sparsity in click estimation with query segments. Inf. Retr. 14(3), 315–336 (2011)
Heffelaar, T., Kuipers, J., Andersson, J., Wiertz, L., Noldus, L.P.J.J.: Easy to use driving behavior analysis using drive lab. In: Stephanidis, C. (ed.) HCI 2014. CCIS, vol. 434, pp. 330–334. Springer, Cham (2014). https://doi.org/10.1007/978-3-319-07857-1_58
Keane, T.: Combat modeling with partial differential equations. Appl. Math. Model. 35(6), 2723–2735 (2011)
Liu, R., Liu, Z.H.: Research on psychology determination system of flight behavior observation. In: Automation and Instrumentation (2017)
Liu, S.Q., Sun, Y.C.: Research on crew workload base on BP neural network. Aircr. Des. (2), 63–66 (2014). (Chinese)
Luo, F., She, L., Gu, B.C.: The psychological analysis on the behavior mistakes of the civil aviation crews. J. Wuhan Univ. Technol. (Transp. Sci. Eng.) 26(2), 191–194 (2002). (Chinese)
Liu, Z.H.: Upper extremity behavior for the pilot. Doctoral dissertation, Shanghai Jiao Tong University (Chinese) (2012)
Li, P.F.: Research on indices and analysis of driving behavior. Doctoral dissertation, Jilin University (Chinese) (2010)
Liu, Y.J., Sun, Y.C.: Aircraft control process modeling and ergonomics analysis based on CPN. Aeronaut. Comput. Tech. 47(1), 69–73 (2017). (Chinese)
NASA Vision 2050一An Integrated National Transportation (2011)
Smith, R.E., Dike, B.A., Ravichandran, B., El-Fallah, A., Mehra, R.K.: Discovering novel fighter combat maneuvers: simulating test pilot creativity. In: Creative Evolutionary Systems. Morgan Kaufmann Publishers Inc (2002)
Sun, R.S., Xiao, Y.B.: Research on indicating structure for operation characteristic of civil aviation pilots based on QAR data. J. Saf. Sci. Technol. 8(11), 49–54 (2012). (Chinese)
Wu, L., Wang, X.F.: Mathematics analysis method research for dependence of flight crew operation behavior. Sci. Technol. Innov. Her. 12(26), 5–9 (2015). (Chinese)
Xue, H.J., Pang, J.F., Luan, Y.C., Li, L.: Cockpit pilot cognitive behavioral integration simulation modeling. Comput. Eng. Appl. 49(23), 266–270 (2013). (Chinese)
Yin, Y.F., Guan, H.C., Zeng, Y.F., Sun, T.H.: Pilot dynamic behavioral evaluation method. J. Chongqing Univ.: Nat. Sci. Ed. 36(6), 154–160 (2013). (Chinese)
Zhang, Z.P.: Take-off and landing skills under big crosswind. Saf. Secur. 6, 54–55 (2014). (Chinese)
Zimmerman, P.H., Bolhuis, J.E., Willemsen, A., Meyer, E.S., Noldus, L.P.: The observer xt: a tool for the integration and synchronization of multimodal signals. Behav. Res. Methods 41(3), 731–735 (2009)
Author information
Authors and Affiliations
Corresponding author
Editor information
Editors and Affiliations
Rights and permissions
Copyright information
© 2018 Springer International Publishing AG, part of Springer Nature
About this paper

Cite this paper
Sun, R., Zhang, G., Yuan, Z. (2018). The Preliminary Application of Observer XT(12.0) in a Pilot-Behavior Study. In: Harris, D. (eds) Engineering Psychology and Cognitive Ergonomics. EPCE 2018. Lecture Notes in Computer Science(), vol 10906. Springer, Cham. https://doi.org/10.1007/978-3-319-91122-9_54
Download citation
DOI: https://doi.org/10.1007/978-3-319-91122-9_54
Published:
Publisher Name: Springer, Cham
Print ISBN: 978-3-319-91121-2
Online ISBN: 978-3-319-91122-9
eBook Packages: Computer ScienceComputer Science (R0)