
Abstract
Growing demands for cleaner production and higher eco-efficiency in process engineering require a comprehensive analysis of technical and environmental outcomes of customers and society. Moreover, unexpected additional technical or ecological drawbacks may appear as negative side effects of new environmentally friendly technologies. The paper conceptualizes a comprehensive approach for analysis and ranking of engineering and ecological requirements in process engineering in order to anticipate secondary problems in eco-design and to avoid compromising the environmental or technological goals. For this purpose, the paper presents a method based on integration of the Quality Function Deployment approach with the Importance-Satisfaction Analysis for the requirements ranking. The proposed method identifies and classifies comprehensively the potential engineering and eco-engineering contradictions through analysis of correlations within requirements groups such as stakeholder requirements (SRs) and technical requirements (TRs), and additionally through cross-relationship between SRs and TRs.
You have full access to this open access chapter, Download conference paper PDF
1 Introduction
Development of green and efficient intensified process technologies in process engineering (PE) plays a fundamental role in society and global economy. Moreover, with the increasing interest towards sustainable innovation design, anticipating possible negative side effects either of technical or environmental origin becomes more important in the early phase of innovation design and process development [1]. Numerous approaches, methods and tools have been developed in the last decades to support the sustainable and environmentally friendly product and process development, as presented in the reviews [1, 2]. To the well-established one belongs the concept of Eco-Design, which is defined by the International Standard Organization (ISO 14006:2011) as “integration of environmental aspects into product design and development, with the aim of reducing adverse environmental impacts throughout a product’s life cycle”. In the field of process engineering are well known the Green Process Engineering [3], Process Intensification [4], and Process Design for Sustainability [5]. Nevertheless, the process innovation activities in industrial companies are still usually driven primarily by costs and quality concerns. As a result, both ecological and technical problems subsequently lead to increase of capital expenditures (CAPEX) and operating expenditures (OPEX) [6]. Therefore, the comprehensive sustainable innovation in process engineering should lay much greater emphasis on higher productivity and quality, as well as on lowering environmental footprint and increasing resource and energy efficiency, as illustrated in Fig. 1.

Tasks and outcomes of sustainable innovation in process engineering
The success of any innovation process depends on how its outcomes meet the needs and expectations of all beneficiaries – in first place the customer groups, and other internal and external stakeholders of industrial companies. The Process Mapping method for systematic and comprehensive identification of engineering and stakeholder requirements in process engineering is a part of the Advanced Innovation Design Approach for PE [7]. One of the widely used methods for collection and evaluation of the customers’ priority criteria in innovation design is the Quality Function Deployment (QFD) with the concept of the Houses of Quality (HoQ) as its core part [8]. QFD helps to translate customers’ requirements into the corresponding technical requirements in each stage of product development and manufacturing. Various models and applications of the QFD are known in the literature [9,10,11]. In the field of eco-design, one should mention in the first place the Quality Function Deployment for Environment (QFDE) [12]. However, the practical QFD application for process intensification and environmental innovation in process engineering remains relatively seldom in comparison with the product innovation. Therefore, the presented paper conceptualizes a new method based on integration of the Quality Function Deployment approach with the Process Mapping [7] and the Importance-Satisfaction Analysis of requirements [7, 13].
Process Mapping is an easy-to-use technique to identify problems and innovation tasks, formulated as solution-neutral process intensification requirements. This method involves breaking down of a complete industrial production process into process steps to capture in each step the information on process equipment, processing methods, input/output quality parameters, product, available resources, and environment, as illustrated in Fig. 2. Process Mapping results in comprehensively capturing and ranking of all existing problems, needs, requirements and possible improvements or optimization opportunities of the technologies and equipment in each process step and in production process in whole. It delivers reliable results for existing technologies or well-known processes [7]. The systematically identified requirements and innovation tasks can be separated in three major groups: (a) enhancement of positive functions or properties; (b) elimination of harm or undesired properties, including environmental impact; (c) raising degree of controllability, accuracy, and automation of the process. The pair-by-pair comparisons of requirements allow to systematically identify all possible engineering and eco-engineering contradictions [1].

adapted from [7]
Fragment of Process Mapping
The Importance-Satisfaction Analysis (ISA) is applied for requirement ranking and for the fast and objective identification of the high priority process intensification problems. The average values of Importance and Satisfaction are based on the independent judgements of the experts. The concept of the QFD House of Quality is used for a systematic identification and fast visualization of the positive and negative interactions between technical requirements and functions (TRs) and requirements of different stakeholders (SRs). In other words, the proposed method identifies and classifies comprehensively the potential engineering and eco-engineering contradictions through analysis of correlations within different requirements groups in complex problem situations in process engineering. The paper introduces new metrics, such as Synergy Index and Contradiction Index in correlations between SRs and TRs, which can be used in optimization algorithms for selection of the process intensification and innovation strategies.
2 Integrating Quality Function Deployment and Importance-Satisfaction Analysis
The proposed method includes modifications of five phases of building the first House of Quality, known in the classical QFD. These modifications, presented in Fig. 3, are essential for the application in process engineering in general and for the requirement ranking and Importance-Satisfaction Analysis in particular. In accordance to the modification of the phase 1, the roof of the HoQ contains the TRs correlation matrix of technical functions and requirements of process equipment and steps. In the phase 2, the voice of the customer is rearranged into stakeholder requirements (SRs) with at least two groups of requirements - the solution-neutral engineering requirements and environmental issues. The interaction between different stakeholder requirements is documented in the SRs correlation matrix. Both the TRs and SRs correlations matrices indicate with the correlation coefficients cTR and cSR equal “−1” a possible negative correlation (contradiction), with “+1” a possible synergy impact, and with “0” - a neutral or unknown relationship between two requirements. Furthermore, the correlations matrices are extended by the Synergy and Contradiction Indexes. These new metrics characterize each technical function or requirement regarding its positive impact (synergies) and negative impact (contradictions) on other TRs.

Modification of the House of Quality for requirements ranking in process engineering
In the phase 3 the importance of each stakeholder requirement and its current performance (defined as satisfaction with its fulfillment in existing process) is evaluated by the experts from a stakeholders’ point of view using a scale from 0% to 100% (100% - very high level of importance or performance, 80% - high, 60% - middle, 40% - low, 20% - very low importance or performance). In accordance to the Importance-Satisfaction Analysis [7, 13], the requirements with higher importance and lower performance have a higher ranking in a process innovation strategy.
The phase 4 comprises the cross-relationship analysis of the stakeholder requirements SRs and technical requirements TRs. The results of this analysis are documented in corresponding cells in the body of the House of Quality. The cells contain the impact factor F of each technical requirement TR on the stakeholder requirement SR. The impact factor has a positive value from 0 to 1, if a TR increases the satisfaction with a stakeholder requirement. On the other hand, the impact factor has a negative value from −1 to 0, if a TR decreases the satisfaction with a stakeholder requirement. The simplest and fastest way to classify a relationship for each pair of SRs and TRs is to apply the binary method. In accordance to the binary classification, the YES-option (impact factor F = 1 or F = −1) is applied if a SR is affected positively or negatively by the corresponding TR. Whilst the NO-option (impact factor F = 0) is indicated if a TR shows neither improving nor worsening effect on a SR.
Finally, the phase 5, includes the calculation of the total, positive or negative relevance of each TR for all stakeholder requirements SRs. Additionally, the partial relevance of each TR for a specific SRs group, for example the partial relevance of each TR to the eco-requirements group, can be estimated in this step. The relevance values of TRs identify technical functions with higher priority for process intensification in order to fulfill the stakeholder requirements with higher ranking, as it has been defined in the phase 3.
3 Illustrating Case Study
The proposed concept for integration of the Quality Function Deployment and Importance-Satisfaction Analysis is illustrated below using an industrial case study dealing with the ceramic powder granulation [14] as presented in Table 1.
Based on the information collected by the Process Mapping, the creation of the House of Quality and requirements ranking can be carried out in the following phases.
-
1.
Generating a correlation matrix of technical requirements (TRs):
-
(a)
Listing all TRs in each unit operation (process step and corresponding equipment) identified by Process Mapping and Function Analysis.
-
(b)
Classifying each TR to technical function (T), and to environmental function (E) for further correlation analysis.
-
(c)
Evaluating the correlations between TRs using (−1) as negative correlation, (+1) as positive correlation and (0) as neutral correlation.
-
(d)
Calculating the Synergy (is) and Contradiction (ic) Indexes for each TR respectively as a number of positive (+1) and a number of negative correlations (−1)
$$ TR \;Synergy\;Index, \quad \quad \quad \,\; i_{s, TRx} = \mathop \sum \nolimits_{j = 1}^{j = n} C_{TRxj} \left( {C_{TR} = + 1} \right) $$(1)$$ TR\;Contradiction\;Index,\quad \;\;i_{c, TRx} = \mathop \sum \nolimits_{j = 1}^{j = n} C_{TRxj} \left( {C_{TR} = - 1} \right) $$(2)where:
- is,TRx:
-
– Synergy Index of a technical requirement x;
- ic,TRx:
-
– Contradiction Index of a technical requirement x;
- C TRxj :
-
– correlation factor between technical requirement x and other TRs;
- n :
-
– total number of technical requirements.
As depicted in Fig. 4, the correlation matrix of TRs (CTR) presents Synergy Index (is) and Contradiction Index (ic) of each technical function. For example, technical function Drying slurry (process step 6) has a positive correlation with three TRs (is = 3) and a negative correlation with other two TRs (ic = 2).
Fig. 4. 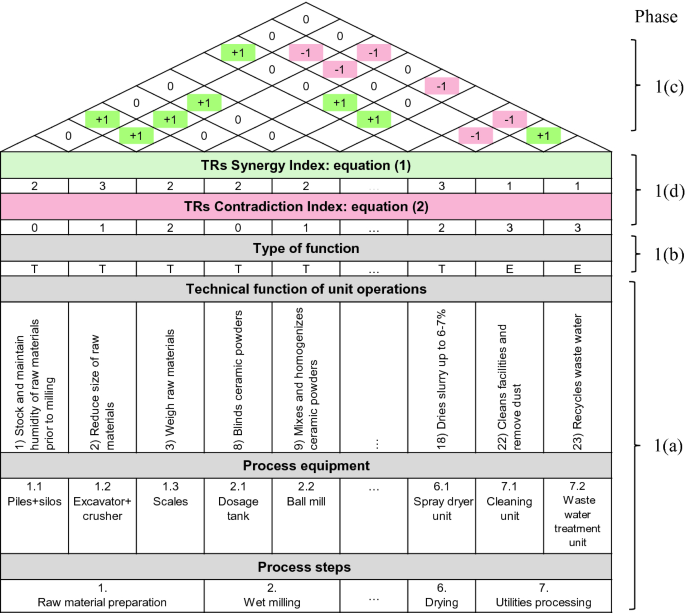
Structure of correlation matrix of technical requirements TRs
-
(a)
-
2.
Generating a correlation matrix of stakeholder requirements (SRs):
-
(a)
Listing all stakeholder requirements (SRs) based on Process Mapping results.
-
(b)
Categorizing SRs to technical or engineering requirements (T), and to the environmental requirements (E).
-
(c)
Evaluating the correlations between SRs using (−1) as negative correlation, (+1) as positive correlation and (0) as neutral correlation.
-
(d)
Calculating the Synergy (is) and Contradiction (ic) Indexes for SRs respectively as a number of positive (+1) and a number of negative correlations (−1)
$$ SR\;Synergy\;Index:\quad \quad \quad \;\;i_{s, SRx} = \mathop \sum \limits_{j = 1}^{j = m} C_{SRxj} \left( {C_{SR} = + 1} \right) $$(3)$$ SR \;Contradiction\; Index:\quad i_{c, SRx} = \mathop \sum \limits_{j = 1}^{j = m} C_{SRxj} \left( {C_{SR} = - 1} \right) $$(4)where:
- is,SRx:
-
– Synergy Index of stakeholder requirement x;
- ic,SRx:
-
– Contradiction Index of stakeholder requirement x;
- C SRxj :
-
– Correlation factor between stakeholder requirement x and other SRs;
- m :
-
– total number of stakeholder requirements.
In the same way as presented in Fig. 4, the correlation matrix of SRs (CSR) shown in Fig. 5 also provides Synergy Index (is) and Contradiction Index (ic) of each stakeholder requirement. For instance, the requirement on Reducing air pollution has a positive impact on three SRs (is = 3) and a negative impact on two other SRs (ic = 2).
Fig. 5. 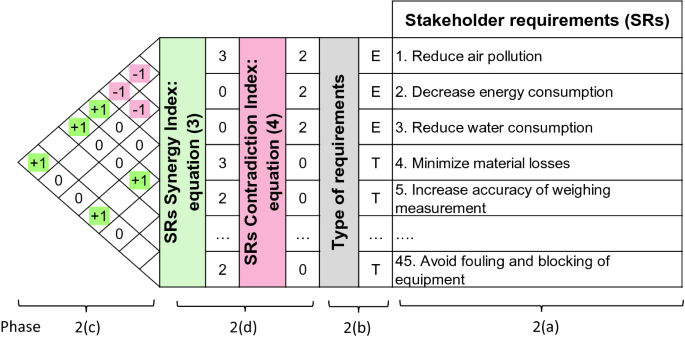
Structure of correlation matrix of stakeholder requirements
-
(a)
-
3.
Determination of SRs ranking using Importance-Satisfaction Analysis (ISA):
-
(a)
Rating the current SRs importance (ISR) and satisfaction (SSR) with the following scale from 0% (lowest value) to 100% (highest value) with interval of 25%.
-
(b)
Obtained importance and satisfaction mean values allow one to calculate the ranking of each stakeholder requirement using the following equation [15]:
$$ Rank_{SRx} = \frac{{\left\{ {I_{SRx} + aI_{SRx} \left( {I_{SRx} - S_{SRx} } \right)\left( {1 - S_{SRx} } \right)} \right\}}}{{\mathop \sum \nolimits_{x = 1}^{x = m} \left\{ {I_{SRx} + aI_{SRx} \left( {I_{SRx} - S_{SRx} } \right)} \right\}}} $$(5)where:
- Rank SRx :
-
– ranking of stakeholder requirement x (SRx), %;
- I SRx :
-
– importance level of SRx, 0 …100%;
- S SRx :
-
– satisfaction level of SRx, 0 …100%;
- m :
-
– total number of stakeholder requirements;
- a :
-
– adjustment coefficient; a = 1 recommended for PE [7].
If we define the “ideal process” as a process with all stakeholder requirements satisfied to 100%, the ranking value RankSRx in the formula (5) corresponds to a maximum contribution of one requirement to the growth of total process ideality towards 100%. An example of problem ranking by one expert is illustrated in the Table 2 below. Decreasing energy consumption has been identified here as the highest priority requirement among other SRs.
Table 2. Example of stakeholder requirements ranking using Importance-Satisfaction Analysis. -
(a)
-
4.
Defining the cross relationship between TRs to SRs in the House of Quality: evaluating the effect of each single technical requirement TR on stakeholder requirements SRs, using simplified binary approach, as illustrated in the Fig. 6:
-
YES - if TR has an effect on SR, either improving (F = 1) or worsening (F = −1);
-
NO - if TR has no influence on SR (impact factor F = 0).
Fig. 6. 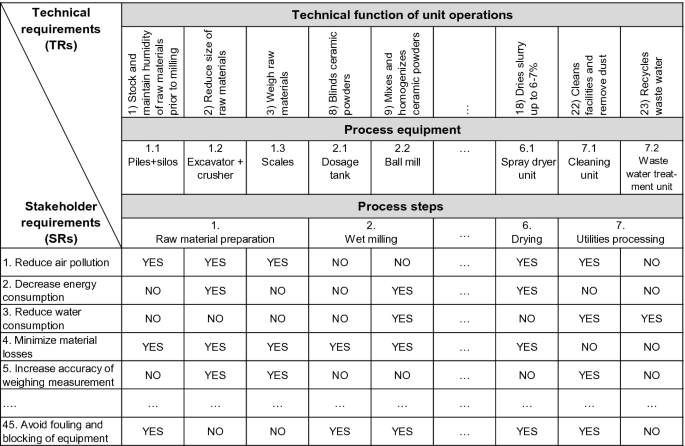
Example of cross-relationship between TRs and SRs (simplified binary approach)
-
-
5.
Calculating the total relevance of a technical requirement x (TRx) for all stakeholder requirements SRs using the Eq. (6):
$$ Rel _{TRx \to SRs} = \mathop \sum \limits_{j = 1}^{j = m} \left( {Rank_{SRj} \times |F_{xj} |} \right) $$(6)where:
- Rel TRx→SRs :
-
– total relevance of technical requirement x (TRx) for all SRs;
- Rank SRj :
-
– ranking of a stakeholder requirement j (SRj), %;
- F xj :
-
– impact factor of a TRx to a stakeholder requirement j (SRj): Fxj = 1 if TR is improving SR, or Fxj = −1 if TR is worsening SR (YES-option); Fxj = 0 if TRs have not influence on SRs (NO-option) – see phase 4;
- m :
-
– total number of stakeholder requirements.


Following example illustrates calculating the total relevance of technical function (Drying slurry) from drying process step 6 to all stakeholder requirements (see the complete modified House of Quality in Appendix A): RelTRx → SRs = (1.4% × 1) + (4.0% × 1) + (2.3% × 0) + (0.3% × 1) + (1.0% × 0) + … + (0.6% × 1) = 6.3%.
In the same manner, one can calculate the total positive relevance considering the improving impact factor (Fxj = 1) or total negative relevance considering the worsening impact factor (Fxj = −1) only. It is also possible to calculate a partial relevance considering the impact of technical requirements TRs on, for example, environmental stakeholder requirements SRs only.
4 Conclusion
The proposed approach of integrating Quality Function Deployment (QFD) and Importance-Satisfaction Analysis (ISA) aims to identify and classify comprehensively the potential engineering and eco-engineering contradictions in process engineering. As shown in Fig. 7, the method investigates correlations within different requirements groups in complex problem situations using Function Analysis and Process Mapping and combining importance-satisfaction evaluation with visualization of the metrics and correlations between technical and stakeholder requirements in a modified House of Quality.

Concept and main outcomes of integrating Quality Function Deployment and Importance-Satisfaction Analysis for process engineering
In general, the proposed approach can contribute to the practical needs of innovation tasks ranking for process intensification using current importance and satisfaction with process key performance parameters by considering not only process efficiency and product quality but also environmental concerns. The estimation of proposed metrics, such as Synergy and Contradiction Indexes of requirements, Ranking of stakeholder requirements and Relevance of technical requirements, helps to define the appropriate process innovation strategy and to select or develop the optimal process intensification technology without secondary problems. Based on obtained information, the computer-aided multi-parameter optimization of processes can be applied to reduce environmental impact and to improve performance of new technologies with the inventive tools of the Theory of Inventive Problem Solving (TRIZ) and Process Intensification methods. However, the application of the proposed method requires specific expert knowledge and practical experience to define and evaluate the correlations of stakeholder and technical requirements. Also, the introduction of the qualitative and quantitative cause-effect relationship between partial problems and requirements will be a part of the future work.
References
Livotov, P., et al.: Eco-innovation in process engineering: contradictions, inventive principles and methods. Therm. Sci. Eng. Prog. 9, 52–65 (2019). https://doi.org/10.1016/j.tsep.2018.10.012
Tyl, B., Legardeur, J., Millet, D., Vallet, F.: A comparative study of ideation mechanisms used in eco-innovation tools. J. Eng. Des. 25(10–12) (2014). https://doi.org/10.1080/09544828.2014.992772
Poux, M., Cognet, P., Gourdon, C.: Green Process Engineering: From Concepts to Industrial Applications. CRC Press, Boca Raton (2015). ISBN 9781482208177
Boodhoo, K., Harvey, A.: Process intensification: an overview of principles and practice. In: Boodhoo, K., Harvey, A. (eds.) Process Intensification for Green Chemistry, pp. 1–31. Wiley (2013). https://doi.org/10.1002/9781118498521.ch1
Azzaro-Pantel, C.: Green process engineering design methodology: a multicriteria approach. In: Poux, M., Cognet, P., Gourdon, C. (eds.) Green Process Engineering: From Concepts to Industrial Applications, pp. 3–26. CRC Press, Boca Raton (2015). ISBN 9781482208177
Livotov, P., Mas’udah, Chandra Sekaran, A.P., Law, R., Reay, D.: ecological advanced innovation design approach for efficient integrated upstream and downstream processes. In: Proceedings of the International Conference on Engineering Design, ICED 2019, Delft, 5–8 August 2019, vol. 1, Issue 1, pp. 3291–3300. Cambridge University Press (2019). https://doi.org/10.1017/dsi.2019.336
Casner, D., Livotov, P.: Advanced innovation design approach for process engineering. In: Proceedings of the 21st International Conference on Engineering Design (ICED 2017), vol. 4: Design Methods and Tools, Vancouver, pp. 653–662 (2017)
Akao, Y.: Quality Function Deployment. Productivity Press, Cambridge (1986)
Chan, L.K., Wu, M.L.: Quality function deployment: a literature review. Eur. J. Oper. Res. 143, 463–497 (2002)
Akao, Y., Mazur, G.H.: The leading edge in QFD: past, present and future. Int. J. Qual. Reliab. Manag. 20(1), 20–35 (2003)
Sisasamy, K., Arumugan, C., Devadasan, S.R.: Advanced models of quality function deployment: a literature review. Qual. Quant. 50, 1399–1414 (2016). https://doi.org/10.1007/s11135-015-0212-2
Masui, K.: Quality function deployment for environment: QFDE - a methodology in early stage of DfE. In: Proceedings of Second International Symposium on Environmentally Conscious Design and Inverse Manufacturing, Japan, pp. 852–857. IEEE (2001)
Bettencourt, L., Ulwick, A.: The customer-centered innovation map. Harv. Bus. Rev. 86(5), 109–114 (2008)
Livotov, P., Mas’udah, Chandra Sekaran, A.P.: On the efficiency of TRIZ application for process intensification in process engineering. In: Cavallucci, D., de Guio, R., Koziołek, S. (eds.) TFC 2018. IFIPAICT, vol. 541, pp. 126–140. Springer, Cham (2018). https://doi.org/10.1007/978-3-030-02456-7_11
Livotov, P.: Method for quantitative evaluation of innovation tasks for technical systems, products and processes. In: Proceedings of ETRIA World Conference 2008 “Synthesis in Innovation”, Enschede, 5–7 November 2008, pp. 197–199. University of Twente, Enschede (2008). ISBN 978-90-365-2749-1
Author information
Authors and Affiliations
Corresponding author
Editor information
Editors and Affiliations
A Appendix
A Appendix
Example of the modified House of Quality and requirements ranking for ceramic powders granulation process (fragment).

Rights and permissions
Copyright information
© 2019 IFIP International Federation for Information Processing
About this paper

Cite this paper
Mas’udah, Livotov, P., Chandra Sekaran, A.P. (2019). Sustainable Innovation in Process Engineering Using Quality Function Deployment Approach and Importance-Satisfaction Analysis of Requirements. In: Benmoussa, R., De Guio, R., Dubois, S., Koziołek, S. (eds) New Opportunities for Innovation Breakthroughs for Developing Countries and Emerging Economies. TFC 2019. IFIP Advances in Information and Communication Technology, vol 572. Springer, Cham. https://doi.org/10.1007/978-3-030-32497-1_22
Download citation
DOI: https://doi.org/10.1007/978-3-030-32497-1_22
Published:
Publisher Name: Springer, Cham
Print ISBN: 978-3-030-32496-4
Online ISBN: 978-3-030-32497-1
eBook Packages: Computer ScienceComputer Science (R0)