
Abstract
Automatic detection of mature apples in a complex agricultural condition is still a challenge for an autonomous picking robot due to the influence from overlapping. In order to detecting overlapped apples in tree canopy using a low-cost camera, a robust apples detection and reconstruction approach based on improved K-means and distance least square algorithm was studied. Firstly, the region of potential apple objects was extracted by using improved K-means algorithm. Then, the contours of apples were obtained by utilizing Canny edge detection algorithm on the V component map and the intact contour of unobscured apple was separated from overlapped apples contour after Y-junction searching. Finally, the contour of obscured apple was reconstructed by use of the distance least square circle fitting algorithm. The proposed method was compared with Hough transform method and the experimental result indicated that the proposed method could get much better performance for overlapped apples detection than Hough transform method. Thus it could be concluded that the proposed method is available for robotic apple picking in overlapped fruits scene with low cost.
You have full access to this open access chapter, Download conference paper PDF
1 Introduction
Apple is one of the competitive agricultural products in China. In 2015, the planting areas of apples in China achieved more than 20 million hectares, and the yield of apples reached over 40 million tons which is the highest-yielding fruit in domestic. The workload of fruit operation like bagging and harvesting accounts for 40% of all workload in entire apple production cycle, and this work is still completed reliant on manual operation. However, labor shortage and increased labor costs in rural areas makes current human-based production pattern unable to meet the demand of apple production in large-scale [1]. Using robot to support fruit operation can not only boost the work efficiency, but also save the labor cost [2]. Therefore, introducing robots to replaced human labor for fruit operation is an inevitable tendency in digitization and mechanization of modern orchards management [3]. The successful fruit operation depends on whether apple objects can be detected in correctly by visual system of the robot. Due to the unstructured characteristic of the grove, some disturbing factors that impacting the accuracy of apple detection are remained, in which fruits overlapping is a major influence factor and this is almost ubiquitous phenomenon in natural orchard condition. Hence the detecting overlapped apples has become a hit as well as difficulty [4].
Several studies have been carried out to detect overlapped objects and some progresses have been made [5,6,7,8,9]. Chen et al. [10] and Miao et al. [11] reported an approach merged region growing and improved watershed algorithms for overlapped citrus detection. This approach enhanced the segmentation accuracy of objects’ edges while decreased the errors caused by over-segmentation of the traditional watershed algorithm. Xiang et al. [12] reported a method for overlapped tomato detection using curvature analysis and regression circle algorithm, and perfectly performance can be obtained when overlapped area was less than 25% of the area of fruits region. Wang et al. [13] explored a new method for overlapped ripe apples using K-means and Normalized cut. This method has a preferable performance for keeping the intact contour of unobscured apples, and improved general accuracy of the segmentation. Xie et al. [14] reported an approach combining concave point searching and random Hough transformation algorithm for overlapped peaches detection, and correct detection rate was 90%. Xu et al. [15] reported a detection method of two overlapped apples integrated snake active contour model and distance-based corner detection algorithm, which provides a brand-new ideal for the detection of overlapped fruits. Song et al. [16] reported a segmentation approach for overlapped apples based on convex-hull theory. The approach transformed concave point detection to salient point detection so as to complexity reduction of the detection algorithm. Lv et al. [17] realized the detection of overlapped apples using RHT algorithm on the image that add together binary image and saltation region generated by edge curvature detection. The approach has improved fruits’ detection efficiency.
In these researches mentioned above, problems included long computation time of algorithm and lower accuracy of fruit reconstruction are remained main because of the morphological diversity of apple growth in natural environment which made various overlapped condition and adaptive difficulty of detection algorithm. For the better detection performance for overlapped apples, a method combined improved K-means and distance least square algorithm was proposed for detection and reconstruction of overlapped apples. Firstly, the region of potential apple objects was extracted by using improved K-means algorithm in L*a*b* color space. Secondly, the contour of apples was obtained by utilizing Canny edge detection algorithm on the V component map in HSV color apace. Thirdly, the intact contour of unobscured apple was separated from overlapped apples contour through Y-junction detection. Finally, the contour of obscured apple was reconstructed by use of the distance least square circle fitting algorithm.
2 Materials and Methods
2.1 Image Acquisition
For developing and testing proposed algorithm, images of apples in orchard were acquired in natural daylight environment using digital camera (EOS 6D, Canon) with a resolution of 5472 × 3648 pixels. Images were photoed randomly in October 2016 in apple orchard of institute of pomology of CAAS, Xingcheng, China. The Hanfu ripe apple was selected as the testing fruit variety. The purpose of this research develop a detection method for overlapped apples using color images, thus images were re-sized to 821 × 547 pixels utilizing the bi-cubic interpolation algorithm for computational convenience.
2.2 Detection of ROI of Overlapped Apples
2.2.1 ROI Segmentation Using Improved K-means
The segmentation of apple objects region is the primary task for detection of overlapped apples. Thus the K-means algorithm was used for ROI segmentation of apple objects, K-means algorithm is a partition-based unsupervised clustering algorithm. The algorithm takes error sum of squares and Euclidean distance as the clustering rule function and the similarity measurement, respectively, then searching the optimal partition of k clusters by means of the iterative computations [18]. Due to initial clustering center of traditional K-means algorithm applied complete random scheme, however, clustering results were most likely to be affected by the selection of initial clustering center and easily traps into local optima [19]. To solve this issue, a heuristic method for clustering center searching was introduced. This method takes the distance square between data points and near clustering center as the computing weight, and calculating optimal clustering center through iterative computation, then obtained globally optimal results [20]. The detailed steps are as follows:
-
(1)
Given data set \( X :\,X = \{ X_{1} ,X_{2} \cdots ,X_{i} , \cdots X_{j} , \cdots ,X_{n} \} \), a data point was randomly selected from X as the initial clustering center c1;
-
(2)
Computing the distance square between every sample point and c1, the distance vector is defined as
$$ D_{i}^{2} = \left\| {X_{i} - c_{1} } \right\|^{2} ,\text{where}\,X_{i} \in X $$ -
(3)
Randomly selecting the next clustering center c2 from X according to the Eq. (1)
$$ \frac{{D_{i}^{2} }}{{\sum\limits_{j = 1}^{n} {\left\| {X_{j} - c_{1} } \right\|^{2} } }} $$(1)
In which \( X_{j} \in X \)
-
(4)
Recalculating the distance vector based on Eq. (2)
$$ D_{i}^{2} = \hbox{min} (\left\| {X_{i} - c_{1} } \right\|^{2} ,\left\| {X_{i} - c_{2} } \right\|^{2} ) $$(2) -
(5)
Repeat step (3) and step (4) until k optimal clustering centers are chosen.
-
(6)
Searching the optimal partition based on k optimal clustering centers.
It is very important to set parameter k during the clustering progress. Due to the color of apples’ surface are not uniform, fruits in image might be clustered into different category if k was too large and results segmentation error. Thus the parameter k = 3 in this study, and image can be clustered into fruits, stems and branches, and others.
The image clustering segmentation was commonly performed in L*a*b* color space when using K-means algorithm because it is a well-defined color model that three components in L*a*b* space can described all sorts of colors human perceived. Due to images captured by the visual sensors belong to RGB color space, images need to transformed form RGB space to L*a*b* color space before K-means clustering. However, the transformation between two spaces cannot transformed directly because of their non-linear relation. So RGB color space needs to converted to XYZ color space firstly, and then L*a*b* color space can be converted from XYZ color space. The transformation formulas are as follow:
In which
Where, \( X_{n} \), \( Y_{n} \), \( Z_{n} \) are XYZ tristimulus values of reference white point, t is X, Y, Z to their corresponding reference white point ratio.
2.2.2 Fruits Image de-noising
After clustering segmentation, the fruit’s calyx in image could formed holes due to the obvious color differences between calyx and fruit surface. Besides, some stems and branches were still existed because the disturbance of varying sunlight, and formed image noise such as burrs isolated points or patches. To solve this issue, morphological processing approaches with the 3pixels-disk structuring element were used to reduced image noise. Utilizing Eq. (8), at first, to executing erosion operation to the image. Then, expanded object region by applied Eq. (9) to eliminate noise in image. Using flood-fill algorithm to filled the holes of apple’s calyx in processing image.
In which A is the processing image, B is the disk structuring element.
In addition, Given the pixel area of overlapped apples is considerably larger than image noise and is largest region in the image, regions that less than 1/5 largest region in the image were removed during the image de-noising.
2.3 Contour Extraction and Reconstruction of Overlapped Apples
It is found by observing that the contour of the unobscured apple was fully visible. Existing approaches, however, can usually only extracted the exterior outline of overlapped apples, and separated overlapped apples by connecting two concave points in overlapped area with a straight line, which leads to the loss of real edge in overlapped region and the lower accuracy of fruits detection. Therefore, a method that could keep the edge information of overlapped area is needed to boosted the accuracy of apples’ detection.
2.3.1 Apples Contour Extraction Using V Component-Based Canny Algorithm
Unlike single apple detection that do not consider the occlusion between fruits, separation of fruits was necessary operation when detecting overlapped apples. Although apples were overlapped, the intact contour of unobscured apple could be obtained and the missing contour of obscured apple could be fixed as long as contour information of apples can be detected.
Edge detection is an effective approach for contour tracing. The idea of the edge detection is that firstly highlighting the objects’ edges in the image by using the edge enhancement operator, then the edge strength in intensity image were calculated, finally edge pixels were extracted by threshold setting. Due to contours were formed from the region that intensity abruptly changing, the contour can be extracted through differential operation of changing parts of the function. And in general, the first derivative of pixels was used to detection computing.
In first derivative operator, assuming intensity function of the image is \( f(x,y) \), where \( (x,y) \) is the pixel coordination, then the gradient \( g(x,y) \) and phase of the location \( (x,y) \) can be defined as Eq. (10)
Gradient g(x, y) and phase reflecting the amplitude and direction of intensity variation, respectively.
The common edge detection operators include Roberts, Sobel, Prewitt, Kirsch, and Canny. The processing speed of Roberts operator is fast, but it is more vulnerable to Gaussian noise because of the strategy that directly image difference calculation without smoothing process, which lead to unsatisfied accuracy of edge location. Sobel and Prewitt operators have better performance for edge extraction of low noise images, but feeble for detection of much noise images because of the high sensitivity. Kirsch operator are sensitive to incremental and have strong inhibition to image noise and better performance of edge detection, but extracted contours are thick and computing time is not acceptable. Detected edges by using Canny operator are thin and have better connection. The real weak edges could be detected more easily since details of objects are lucid and intact when using Canny operator. Therefore, Canny operator was used in this study to detect fruits’ edge in the image.
Traditional Canny edge detection was commonly used with gray image of RGB image, but intensity of apples area in this gray image is uneven, which results much noise occurred and some long edge noise are difficult to remove. In V component of HSV space, the intensity of overlapped part of fruit image is more even and the edge gradient is more prominent. Therefore, using V component image in HSV space replaced the gray image of RGB image, then edges of apples were detected with Canny operator. The main steps of the processing were described as following:
-
(1)
Converted RGB color space to HSV color space, and extract gray image from V component as the processing image.
-
(2)
Smoothing image with the first derivative of two dimensional Gaussian function, which defined as
$$ G(x,y) = \frac{1}{2\pi \sigma }\exp \left( { - \frac{{x^{2} + y^{2} }}{{2\sigma^{2} }}} \right) $$(11)
The first directional derivative in a certain direction of \( G(x,y) \) was
In which \( n = \left[ \begin{aligned} \cos \theta \hfill \\ \sin \theta \hfill \\ \end{aligned} \right] \) is the direction vector, \( \nabla G(x,y) = \left[ \begin{aligned} \frac{\partial G}{\partial x} \hfill \\ \frac{\partial G}{\partial y} \hfill \\ \end{aligned} \right] \) is the gradient vector.
-
(3)
Gradient magnitude and direction of smoothed image \( I(x,y) \) were obtained by computing finite difference of the first partial derivative with 2 × 2 neighborhood. \( E_{x} (x,y) \) and \( E_{y} (x,y) \) are first partial derivatives of direction x and direction y, respectively. They are defined as Eqs. (13) and (14)
$$ E_{x} (x,y) = \frac{I(x,y + 1) - I(x,y) + I(x + 1,y + 1) - I(x + 1,y)}{2} $$(13)$$ E_{y} (x,y) = \frac{I(x,y) - I(x + 1,y) + I(x,y + 1) - I(x + 1,y + 1)}{2} $$(14) -
(4)
Take Eq. (12) into first derivative operator and calculated gradient magnitude and direction. Non-maxima suppression was applied to gradient magnitude, which is defined as Eq. (15)
$$ N(x,y) = NMS\left[ {M(x,y),\xi (x,y)} \right] $$(15)
In which \( N(x,y) \) is the image with non-maxima suppression, \( M(x,y) \) is gradient magnitude, \( \xi (x,y) \) is the area of non-maxima suppression.
-
(5)
The edge array image was obtained after magnitude thresholding of non-maxima suppression. Dual threshold algorithm was applied in this computational process. \( \uptau_{1} \) and \( \uptau_{2} \) are two thresholds in edge detection while \( \uptau_{1} { > \tau }_{2} \). Processing image \( N(x,y) \) with these thresholds. Setting the intensity of pixels that value is less than \( \uptau_{1} \) as 0, and obtained edge image \( T_{1} \). In a similar way, another edge image \( T_{2} \) was obtained. \( T_{1} \) was regarded as compensatory to connecting edge while \( T_{2} \) was regarded as the basis image for the reason that \( T_{2} \) has few fake edges while \( T_{1} \) keeps more edge information.
The contours of the overlapped apples were extracted with Canny edge detection algorithm, but the small edge noise were generated on fruits areas by reason of the uneven illumination. Therefore, a method that calculating numbers of edges pixels was utilized to remove noise edges contained less pixels and to keep fruits contour contained more pixels.
2.3.2 Separation of Apples Contour Based on Y-junction Detection
For the better detection accuracy, overlapped apples need to be separated into individual fruit. Due to the color uniformity, pixels noise and similar intensity of overlapped region in original image, the fruits’ contour likely to be disconnected that affect the accuracy of fruit detection. Thus, dilation operation with 5-pixels disk structural element was used to connecting the broken contour.
Although contour has connected after dilation operation, but it is not single pixel level yet. Edge thinning can make contour to be the single pixel level, which benefit for the subsequent fruit separation [21]. The steps of edge thinning are as follow:
-
(1)
Given a pixel point on the edge is P and pixel value is 1, then Xi(i = 1, 2, …, 8) are the values of the P-centered 8 neighbors pixels, as show in Fig. 1.
Fig. 1. 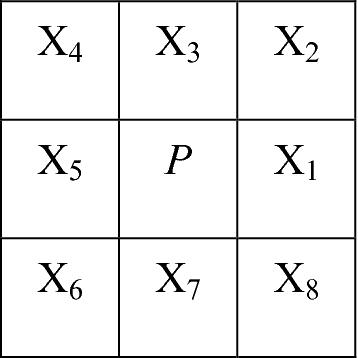
The pixel values of the P-centered 8 neighbors
-
(2)
Traverse all edge pixels according to the rule 1 that is setting pixel P as 0 if and only if the criterions C1, C2, C3 are all met. Criterions C1, C2, C3 are defined as follow:

Criterions C1,
Where
Criterions C2,
Where
Criterions C3,
-
(3)
Re-traverse all edge pixel points on the basis of the results of the first traverse according to the rule 2 that is setting pixel P as 0 if and only if the criterions C1, C2, C4 are all met. Criterions C4 is defined as follow:
$$ (X_{6} \vee X_{7} \vee X_{4} ) \wedge X_{5} = 0 $$(19)
For the separating fruits in correctly, the chief mission is extracting the intact contour of the unobstructed apple. It is found through observation that Y-like junctions are existed on the contour of overlapped area of the apple fruits. And the contour of overlapped apples can be separated into individual apple by detecting this Y-like junctions. The steps of detecting Y-like junctions are as follow:
-
(1)
Given the pixels values of the contour is 1 and that of background is 0. Then traverse all pixels of the contour, and for each pixel on the contour, calculate the sum value of it’s 3 × 3 neighbors pixels. This sum value is defined as:
$$ T = \sum\limits_{{{\text{i}} = 1}}^{8} {d_{i} } $$(20)
In which, di presents the value of the i-th pixel point.
-
(2)
If T ≥ 3, then regarded the current point as Y-like junction. And delete the values of Y-like junction pixel and it’s 3 × 3 neighbors pixels, then the separated contours of apples were obtained.
-
(3)
Given P0(x0, y0) is the center point of a contour of the apple, and P1(x1, y1), P2(x2, y2) are endpoints of the contour. Z is the tangent line crossed P0. Two perpendicular line crossed endpoints perpendicular to Z and intersect at point P3(x3, y3) and point P4(x4, y4). Calculating curve direction of each contour of apples according to the following rules, as show in Table 1, the contour of each apple was contained after grouped contours that opposite direction.
Table 1. Rules of curve direction calculation
2.3.3 Contour Reconstruction of Obscured Apple Based on Distance Least Square Circle Fitting Algorithm
For contour completion in overlapped region, Distance Least Squares (DLS) algorithm was applied to reconstruct the contour of obscured apple. DLS is a mathematical optimization method that searching the best function matching of the data through minimizes the sum of the squares of the residuals. DLS algorithm can fitting a serial of points, \( \{ P_{\text{i}} (x_{i} ,y_{i} )_{i = 1,2,\, \ldots ,\,N} \} \), on the fruit contour to a circle. Defined fitting residuals function as the quadratic sum E of distances that from each point Pi on the contour to the fitting circle. The quadratic sum E was defined as Eq. (21)
In which, \( \rho_{i} = \left\| {P_{i} - P_{c} } \right\| = \sqrt {(x_{i} - x_{c} )^{2} + (y_{i} - y_{c} )^{2} } \), \( \rho_{i} \) is the distances that from each point on the contour to the center of fitting circle \( P_{c} (x_{c} ,y_{c} ) \); Rc is the radius of the fitting circle.
During the fitting process with traditional DLS algorithm, the fitting results are more likely to be affected by outliers. Thus the weight function was introduced to decrease interference from the outliers. The main steps of the weight function-based DLS algorithm were firstly fitting a circle with DLS algorithm, and then according to the distances that from each point on the contour to this circle, calculating the corresponding weight of each point that used in subsequent iteration process. For the distant outliers assigned small enough weights, Tukey weight function was chosen as the weight function of DLS algorithm. Tukey weight function was defined as Eq. (22)
In which, \( \tau \) is clipping factor that determined which points could be the outliers; \( \delta_{i} \) is the distances that from each point on the contour to the fitting circle.
Calculating fitting residuals function by minimize iterative computation under the Eq. (23)
3 Results and Discussion
3.1 ROI Segmentation and de-noising
Figure 2 shows an example of the result of K-means clustering segmentation. Figure 2(a) shows the re-sized original image. Figure 2(b) shows the segmented image by improved K-means clustering algorithm. It can be seen that the pixel region of apples has been extracted. And improved K-means algorithm has a good performance for segmentation of red mature apples.

Example of the result of K-means clustering segmentation: (a) the re-sized original image, (b) the segmented image by using improved K-means clustering algorithm. (Color figure online)
As show in the Fig. 2(b), some image noise such as holes and patches of stems and leaves were existed after clustering segmentation. For the better detection performance, the image needs to be further treated. Morphological processing algorithm was utilized for holes filling and patches noise removing. For keeping details of the overlapped region of apple image, the processed binary image has been converted into color image. Figure 3 shows the results of an example of image de-noising. Figure 3(a) shows binary image of Fig. 2(b). Figure 3(b) shows the results of morphological processing and holes filling. Figure 3(c) shows the converted color image. It can be seen that patches noise was completely eliminated by using morphological processing while holes were perfectly filled by using flood-fill algorithm. Through conversion between binary image and color image, the color information of overlapped region in apples image were remained, which was beneficial for the subsequent processing.

An example of the results of image de-noising: (a) the binary image of Fig. 2(b), (b) the results of morphological processing and holes filling, (c) the converted color image. (Color figure online)
3.2 Apples Contour Extraction and Individual Apple Contour Separation
Figure 4 shows an example of the result of edge detection with Canny operator on the image of V component. It is observed that the contours of overlapped apples were extracted, but many short edges were existed, which lead to some image noise. Through edge de-noising, short edges that have less pixels were removed while long edges that have more pixels were kept. Figure 5 shows the result of edge de-noising. It can be seen that the outlines of the overlapped apples were extracted, and the largely intact contour of the unobscured apple was extracted too, which illustrated that V component-based Canny edge detection have preferable capacity to kept edge information of apples’ overlapped area.

Result of edge detection.

Result of edge de-noising.
Figure 6 shows the procedure of contour separation of overlapped apples. Figure 6(a) shows the result of V component-based Canny edge detection. In this image, the contour of unobscured apple has broken and have not formed closed contour. Figure 6(b) shows the result of contour connection by using proposed method. It can be seen that the broken contour has been connected. Contours of apples were thinned firstly in order to searching Y-like junction, and pixels on the area of Y-like junction were deleted and the results of Y-like junction searching and removing were show as Fig. 6(c) and (d). It can be seen that the Y-like junctions of the contour were detected and removed in correctly. Curve direction of the contours were calculated by the above-mentioned steps and grouped together contours that curve direction were opposite, then the contour of the unobscured apple was obtained. Due to this contour is not a closed contour, morphological dilation and edge thinning were used to connect and thin contours of the unobscured apple, and the result was show as Fig. 6(e). It can be seen that the complete contour of unobscured apple was extracted. These results shows that the proposed method was effective for keeping complete contour pixels of the unobscured apple. Figure 6(f) shows the contour of unobscured apple. It can be seen that partly contour of the apple object was loss and further processing is needed.

Example of the results of contour separation of overlapped apples: (a) result of V component-based Canny edge detection, (b) result of contour connection, (c) result of the area of Y-like junction, (d) result of area deletion of Y-like junction, (e) complete contour of the unobscured apple, (f) the contour of the obscured apple.
3.3 Contour Reconstruction of the Obscured Apple
Figure 7 shows an example of the result of contour reconstruction with improved DLS algorithm for obscured apple object. In the result image, the white contour was the original contour of the obscured apple, and the blue contour was the reconstructed contour of the obscured apple. It can be seen that the reconstructed contour has basically matched with the original contour of the obscured apple.

Example of the result of contour reconstruction of the obscured apple with DLS. (Color figure online)
3.4 Methods Validity and Analysis
In order to verify the validity of the method, circular Hough transformation (CHT) was used in comparison with proposed method. Figure 8 shows the result of methods comparison. Figure 8(a) shows the result of detection of overlapped apples with CHT method. Figure 8(b) shows the result of detection of overlapped apples with proposed method. It can be seen that the major detection error was generated because the big deviation of CHT fitting while proposed method has better performance of apples detection. Proposed method can not only keep complete contour of the unobscured apple in overlapped apples, but also reconstruct obscured apple with better result.

Results of comparison between CHT method and proposed method: (a) result of detection of overlapped apples with CHT method, (b) result of detection of overlapped apples with proposed method.
4 Conclusion
An approach to detecting overlapped apples on colour images was developed. To use information of shape and colour, K-means, Canny operator, Y-junction searching and DLS were implemented. Multiple detections were integrated for the final result. Using orchard scene images, experiments were conducted and performance of method were evaluated. K-means algorithm have potential for extracting ROI of overlapped apples in natural scenes which contains different visual objects due to complex color and structure of the leaves, branches and other objects. It can be concluded that Canny operator and Y-junction searching algorithm are effective ways to traced contours of overlapped apples and separated individual apple from region of overlapped apples with complete contours, which benefit for detection accuracy improvement. The missing contour of the obscured apple were reconstructed by circular fitting with DLS algorithm. Through a comparison between CHT method and proposed method, it can be concluded that proposed method has higher accuracy for the detection of overlapped apples.
References
Zhou, G.M.: Research and development of digital orchard in China. Agric. Netw. Inf. 1, 10–12 (2012)
Lu, J., Wang, X.F., Hou, D.J.: Development of machine vision system for fruit harvesting robots. Hubei Agric. Sci. 51(21), 4705–4708 (2012)
Zhou, G.M.: Application situation and outlook of digital orchard. Agric. Outlook 1, 10–12 (2015)
Feng, J., Wang, S., Liu, G., Zeng, L.: A separating method of adjacent apples based on machine vision and chain code information. In: Li, D., Chen, Y. (eds.) CCTA 2011. IAICT, vol. 368, pp. 258–267. Springer, Heidelberg (2012). https://doi.org/10.1007/978-3-642-27281-3_32
Xun, Y., Chen, X., Li, W., et al.: Automatic recognition of on-tree apples based on contour curvature. J. Jiangsu Univ. (Nat. Sci. Ed.). 28(6), 461–464 (2007)
Lu, Q., Cai, J., Zhao, J., et al.: Real-time recognition of citrus on trees in natural scene. Trans. Chin. Soc. Agric. Mach. 41(2), 185–188 + 170 (2010)
Nasiri, F., Glozarian, M.R., Aghkhani, M.H.: Development of intersection circle method for detecting and estimating the number of near-spherical clustered citrus fruits in robotic harvesting. In: International Conference on Sustainable Development with a Focus on Agriculture, Environment and Tourism (2015)
Yamamoto, K., Guo, W., Yoshioka, Y., et al.: On plant detection of intact tomato fruits using image analysis and machine learning methods. Sensors 14(7), 12191–12206 (2014)
Zeng, Q., Liu, C., Miao, Y., et al.: Non-destructive measurement of diameter of overlapping grape fruit based on morphological image processing. Trans. Chin. Soc. Agric. Eng. 25(9), 356–360 (2009)
Chen, Y., Lee, W.: Identification and determination of the number of overlapping citrus fruit in natural outdoor conditions. In: 2014 Montreal, Quebec Canada 13–16 July 2014, p. 1. American Society of Agricultural and Biological Engineers (2014)
Miao, Z.H., Shen, Y.C., Wang, X.H., et al.: Research on the optimized image processing algorithm of overlapping fruits in natural environment. Trans. Chin. Soc. Agric. Mach. 47(6), 21–26 (2016)
Xiang, R., Jiang, H., Ying, Y.: Recognition of clustered tomatoes based on binocular stereo vision. Comput. Electron. Agric. 106, 75–90 (2014)
Wang, D.D., Xu, Y., Song, H.B., et al.: Fusion of K-means and Ncut algorithm to realize segmentation and reconstruction of two overlapped apples without blocking by branches and leaves. Trans. Chin. Soc. Agric. Eng. 31(10), 227–234 (2015)
Xie, Z.H., Ji, C.Y., Guo, X.Q., et al.: Detection and location algorithm for overlapped fruits based on concave spots searching. Trans. Chin. Soc. Agric. Mach. 42(12), 191–196 (2011)
Xu, Y., Li, Y.H., Song, H.B., et al.: Segmentation method of overlapped double apples based on snake model and corner detectors. Trans. Chin. Soc. Agric. Eng. 31(1), 196–203 (2015)
Song, H.B., Zhang, C.D., Pan, J.P., et al.: Segmentation and reconstruction of overlapped apple images based on convex hull. Trans. Chin. Soc. Agric. Eng. 29(3), 163–168 (2013)
Lv, J.D., Wang, F., Ma, Z., et al.: Yellow apple recognition method under natural environment. In: 2015 7th International Conference on Intelligent Human-Machine Systems and Cybernetics (IHMSC), vol. 1, 46–49. IEEE (2015)
Yang, X.T., Sun, W.J., Li, M., et al.: Water droplets fluorescence image segmentation of cucumber leaves based on K-means clustering with opening and closing alternately filtering. Trans. Chin. Soc. Agric. Eng. 32(17), 136–143 (2016)
Xu, L.M., Lü, J.D.: Bayberry image segmentation based on homomorphic filtering and K-means clustering algorithm. Trans. Chin. Soc. Agric. Eng. 31(14), 202–208 (2015)
Cen, Z.Y., Li, B., Tian, L.F.: High dimensional transfer function design based on K -means++ for volume visualization. J. Comput. Appl. 32(12), 3404–3407 (2012)
Lam, L., Lee, S.W., Suen, C.Y.: Thinning methodologies-a comprehensive survey. IEEE Trans. Pattern Anal. Mach. Intell. 14(9), 869–885 (1992)
Acknowledgements
This work was supported by a grant from the National High-tech R&D Program of China (863 Program No. 2013AA102405) and Agricultural Science and Technology Innovation Project of Chinese Academy of Agricultural Sciences (Project No. CAAS-ASTIP-2016-AII).
Author information
Authors and Affiliations
Corresponding author
Editor information
Editors and Affiliations
Rights and permissions
Copyright information
© 2019 IFIP International Federation for Information Processing
About this paper

Cite this paper
Xue, X. et al. (2019). Detection of Overlapped Apples in Orchard Scene Using Improved K-means and Distance Least Square. In: Li, D., Zhao, C. (eds) Computer and Computing Technologies in Agriculture XI. CCTA 2017. IFIP Advances in Information and Communication Technology, vol 545. Springer, Cham. https://doi.org/10.1007/978-3-030-06137-1_25
Download citation
DOI: https://doi.org/10.1007/978-3-030-06137-1_25
Published:
Publisher Name: Springer, Cham
Print ISBN: 978-3-030-06136-4
Online ISBN: 978-3-030-06137-1
eBook Packages: Computer ScienceComputer Science (R0)