
Abstract
Using appropriate stimuli to evoke emotions is especially important for researching emotion. Psychologists have provided several standardized affective stimulus databases—such as the International Affective Picture System (IAPS) and the Nencki Affective Picture System (NAPS) as visual stimulus databases, as well as the International Affective Digitized Sounds (IADS) and the Montreal Affective Voices as auditory stimulus databases for emotional experiments. However, considering the limitations of the existing auditory stimulus database studies, research using auditory stimuli is relatively limited compared with the studies using visual stimuli. First, the number of sample sounds is limited, making it difficult to equate across emotional conditions and semantic categories. Second, some artificially created materials (music or human voice) may fail to accurately drive the intended emotional processes. Our principal aim was to expand existing auditory affective sample database to sufficiently cover natural sounds. We asked 207 participants to rate 935 sounds (including the sounds from the IADS-2) using the Self-Assessment Manikin (SAM) and three basic-emotion rating scales. The results showed that emotions in sounds can be distinguished on the affective rating scales, and the stability of the evaluations of sounds revealed that we have successfully provided a larger corpus of natural, emotionally evocative auditory stimuli, covering a wide range of semantic categories. Our expanded, standardized sound sample database may promote a wide range of research in auditory systems and the possible interactions with other sensory modalities, encouraging direct reliable comparisons of outcomes from different researchers in the field of psychology.
Emotion, as one of the most significant issues in psychology and psychophysiology, has been thoroughly examined in the field of cognitive psychology (Lindquist, 2010). For a complete understanding of emotional processes, it is especially important to select appropriate experimental materials that complement the experimental purposes appropriately (for a review, see Gerdes, Wieser, & Alpers, 2014). In daily human life, the various types of external stimulus that we receive across different modalities not only have powerful effects on subjective senses and evoked emotions (e.g., Fazio, 2001; Jaquet, Danuser, & Gomez, 2012; Marin, Gingras, & Bhattacharya, 2012) but also influence our decision-making and subsequent behavior (mood management theory; Zillmann, 1988). Therefore, many standardized affective stimulus databases were provided and have been extensively used in studies on emotion.
The emotional processes have been intensively studied particularly in the visual system. In many psychological and neuroimaging studies, visual stimuli have been used to evoke certain types of emotion such as affective pictures (e.g., Buodo et al., 2017; Lang, Greenwald, Bradley, & Hamm, 1993), emotional facial expressions (e.g., Esslen, Pascual-Marqui, Hell, Kochi, & Lehmann, 2004; Shuman, Clark-Polner, Meuleman, Sander, & Scherer, 2015), and written affective words (e.g., Schindler & Kissler, 2016). Among other senses (i.e., audition, touch, taste, and olfaction), auditory stimuli also profoundly provoke human emotions (Redondo, Fraga, Padrón, & Piñeiro, 2008). However, research on auditory system is much less frequent than on visual system (Gerdes et al., 2014). One of the potential reasons would be that visual stimuli are easier to manipulate and control as compared with auditory stimuli (Bradley & Lang, 2000). For an instance, in contrast with static pictures of facial expressions or written words, auditory stimuli are dynamic over time (Banse & Scherer, 1996; Droit-Volet, Ramos, Bueno, & Bigand, 2013; Juslin & Laukka, 2003), requiring continuous perception, integration, and interpretation for recognition (Schirmer & Kotz, 2006).
In recent decades, researches on emotion using auditory stimuli have gradually increased following the advancement and growing popularity of digital information storage and software to conveniently store and manipulate digitized data; this has made experimental control of auditory stimuli increasingly feasible (Bradley & Lang, 2000). For instance, Fabiani, Kazmerski, Cycowicz, and Friedman (1996) developed a large battery of brief (400 ms), seemingly neutral auditory stimuli (i.e., animals, noises, artificial sounds, etc.) to investigate novelty effects in the event-related potential oddball paradigm. Czigler, Cox, Gyimesi, and Horváth (2007) had attempted to investigate brain processes related to unpleasant auditory stimuli. Armony, Aubé, Angulo-Perkins, Peretz, and Concha (2015) performed an fMRI experiment to compare the neural activities evoked by music and voice. Nevertheless, there are flaws in these experimental materials. Most of the auditory stimuli used in emotional research were selected by researchers a priori or from a limited number of participants’ ratings in a preliminary experiment. Such a limited number and type of stimuli make it difficult to compare the outcomes and to replicate them across research labs (Bradley & Lang, 2007a).
To address these problems and encourage research assessing basic and applied problems in psychological science, the NIMH Center for Emotion and Attention at the University of Florida has developed a standardized auditory stimulus database named the International Affective Digitized Sounds (Bradley & Lang, 1999 [IADS-1]; Bradley & Lang, 2007a [IADS-2]). The latest version, IADS-2 (Bradley & Lang, 2007a), consists of 167 digitally recorded natural sounds that are common in daily life, such as a baby laughing, someone cooking, a thunderstorm, erotic sounds, and so on. Each sound lasts 6 s and is characterized by the affective dimensions of valence, arousal, and dominance or control according to the Self-Assessment Manikin (SAM; Bradley & Lang, 1994).
However, previous studies have exposed that IADS-2, as a standardized international affective stimulus database, had limitations and deficiencies (Choi et al., 2016; da Silva & Backs, 2015). First, as compared to most visual stimulus databases, the number of stimuli in IADS-2 is insufficient (only 167 sounds; the International Affective Picture System [IAPS] has 1,182 pictures: Lang, Bradley, & Cuthbert, 1997, 2008; the Affective Norms for English Words [ANEW] has 1,034 words: Bradley & Lang, 2007b). The small number of sound stimuli means that the distribution of IADS-2 in the bidimensional affective space of valence and arousal is uneven as compared to IAPS (see Fig. 1a and b, respectively). We counted the number of sounds for the IADS-2 in each quadrant of arousal–valence space, with the origin at ratings of 5. Consequently, the numbers of sounds from the first quadrant to the fourth quadrant are 50, 31, 16, and 70, respectively, whereas the numbers of pictures for the IAPS in each quadrant are 225, 420, 225, and 312, respectively. The biased distribution of sounds makes it difficult to choose the same number of sounds from different emotional conditions, and it is extremely difficult to keep experimental conditions balanced like they can be with the IAPS. Second, the number of sounds in each semantic category is varied: animals (N = 18), people (N = 52), nature (N = 7), daily routine sounds (N = 28), transport (N = 15), electric sounds (N = 5), breaking sounds (N = 4), music (N = 12), and scenarios (N = 26). The classification was evaluated by ten participants in a pilot study. Considering the irrelevant number of sounds, it is also difficult to select experimental materials from each semantic category equally.

Distributions of overall mean values for the 167 sounds of the IADS-2 (a) and the visual stimuli of the IAPS (b) in the valence and arousal affective dimensions
In addition to the IADS, other sets of auditory stimulus databases, including the Montreal Affective Voices database (Belin, Fillion-Bilodeau, & Gosselin, 2008), musical excerpts (Vieillard et al., 2008), Portuguese sentences and pseudosentences for research on emotional prosody (Castro & Lima, 2010), and vocal emotional stimuli in Mandarin Chinese (Liu & Pell, 2012) have also been developed. However, the materials in these databases are limited to music pieces or recorded vocalizations. Studies that are based on these artificial databases may fail to accurately predict the human emotion process, because the sounds we hear in daily life are much more extensive. Therefore, inventing a standardized natural emotional auditory stimulus database that contains sufficient stimuli for emotional research is urgently required (Gerdes et al., 2014).
In this study, we aimed to expand the IADS-2 (Bradley & Lang, 2007a) and provide a high-quality standardized, emotionally evocative auditory stimuli database with contents from across a wider range of semantic categories. We based our database on the IADS-2 because it is the only auditory database that includes a wide range of semantic categories and, as compared with other auditory databases, is also the one most frequently used in emotional research (Gerdes et al., 2014; Marchewka, Zurawski, Jednoróg, & Grabowska, 2014). We termed the new auditory stimulus database IADS-E, an expanded version of the IADS-2. The IADS-E is freely accessible to the scientific community for noncommercial use by request to the corresponding author.
For maintaining consistency in theory, our study also used the SAM (Bradley & Lang, 1994) as the IADS-2 did. Furthermore, to provide a way to conduct more controlled and refined experiments, depending on the experimental objective, we tried to include the evaluation for basic emotions (Ekman, 1992). However, because the number of sounds participants needed to examine was enormous in this study, we focused only on a subset of the six potential emotions to be rated. We selected happiness, sadness, and fear, for these can be distinguished on the dimensions of valence and arousal, and have been studied well in many psychological research (Vieillard et al., 2008). Moreover, according to Pell and Kotz (2011), sadness and fear can be recognized more accurately in auditory stimuli than other basic emotions, while the happiness is the opposite of sadness (Vieillard et al., 2008), and therefore we considered the three basic emotions is suitable for our study. By omitting other emotions to be rated, we aimed to minimize fatigue that could result from a too-long experimental time.
Moreover, although the ratings for IADS-2 were collected from a group, we improved on this procedure by designing an individual experiment in a soundproofing room, to avoid interference between the participants and noise. The affective ratings measured in the individual experiment would be better adapted to laboratory experiments, because most psychological laboratory experiments are performed individually, and emotions evoked in the same situation could be reexperienced more precisely.
Method
Participants
Two hundred seven Japanese participants (104 females and 103 males, mean age = 21.32 years, SD = 2.38 years) from Hiroshima University (except the one who had just graduated from high school) were recruited. Over the time course of the study, the data were collected in two different rooms, where exactly the same procedures were carried out at the two locations except for geographical differences between the sites. We report the details for completeness. None of the participants had any history of neurological or psychiatric disorder, and 93% of them were right-handed. All experimental protocols were conducted in accordance with guidelines approved by the Ethical Committee of the Graduate School of Education, Hiroshima University. Written informed consent was obtained from each participant, and monetary rewards were given to all participants as compensation for their participation.
Materials
Sound stimuli
-
(1)
Sound collection: Some of the sounds were assembled from the Internet and sampled using computer music software, including various sounds heard in daily life (e.g., rain, writing, laughing, and barking), and some were composed by a composer. Depending on the duration of the sound (sounds less than 1.5 s were excluded), naturalness, and the emotional ratings from a preliminary experiment, after careful filtering, an initial observation revealed 1,226 sounds, from which 768 sounds were selected.
We manipulated the 768 newly collected sounds to 6 s with the SoundEngine Free Version 5.21 software (Coderium., Inc., Japan) as this is the IADS-2’s standard duration. Because differences in physical properties may influence emotional ratings (Lolli, Lewenstein, Basurto, Winnik, & Loui, 2015), we edited three physical properties (frequency, 44.1 kHz; bit rate, 1,411 kbps; and channels, two) equally for all sounds (including those from IADS-2).
-
(2)
Experimental materials: When the new sound stimuli were added to those from the IADS-2, we had collected 935 sound stimuli for this experiment. The sounds were preliminarily divided into ten semantic categories—animals (N = 54), people (N = 74), nature (N = 70), daily routine sounds (N = 187), transport (N = 59), electric sounds (N = 64), sound effects (N = 171), breaking sounds (N = 56), music (N = 170), and scenarios (N = 30)—by ten participants who did not participate in the main experiment. Each sound’s physical property values were calculated using the Amadeus Pro sound editing version 2.2.2 software (HairerSoft., Inc. UK), shown in the fourth sheet of the supplementary materials (Sounds2nd). The peak sound intensity at presentation ranged from 50.4 to 88 dB(A), as measured using a NL-42 sound level meter (RION Co., Ltd., Japan); the maximum level (Lmax), the minimum level (Lmin), the equivalent continuous level (Leq), and the exposure level (LE) are shown on the fifth sheet of the supplementary materials (Sounds3rd). All sounds were presented with a prompt fixed volume and generally varied according to the respective natural volumes in the environment.
To ensure that the participants focused on the test, and to avoid fatigue, we distributed the 935 sounds across ten categories into nine groups of 103–104 sounds. Each group was divided into two blocks (each block contained 52 sounds, except one that contained 51 sounds). Each participant rated only one of the nine groups, and each sound was rated by at least 22 participants. The sounds in each block were presented in a predefined order, such that no more than three sounds that correspond to same semantic category were presented consecutively.
The experimental procedure was programmed using the Presentation Version 18.1 Build 03.31.15 software (Neurobehavioral Systems, Inc., USA) for process automation. The software, running on a personal computer, controlled the presentation of instructions on the computer display as well as the presentation of sounds via a speaker (GX-70HD II, ONKYO Corp., Japan). It also registered the ratings that participants entered using the keyboard.
Emotional rating measurements
-
(1)
Self-Assessment Manikin (SAM): This system for nonverbal pictorial assessment, devised by Lang (1980) (also seen in Bradley & Lang, 1994) to measure emotional ratings in the three dimensions of valence, arousal, and dominance, was used. The SAM scale we used contained five affective graphical figures, with a space between each two consecutive pictures, defining a 9-point scale for each dimension (Fig. 2): valence (ranging from 1, depicted by a frowning, unhappy figure, to 9, a smiling, happy figure), arousal (ranging from 1, depicted by a relaxed, sleepy figure, to 9, an excited, wide-eyed figure), and dominance (ranging from 1, depicted by a small figure representing being controlled, to 9, a large figure representing being in control).
-
(2)
Basic emotion rating scales: Three basic emotion rating scales—happiness, sadness, and fear—were presented as supplementary evaluations. The ratings were measured from 1 point, for not at all, to 9 points, for extremely, and were shown by words. Both the SAM scales and the basic emotion rating scales were presented in a pseudorandom order, to control for order effects (Castonguay, Sabiston, Crocker, & Mack, 2014; Krosnick & Presser, 2010). All ratings were further analyzed using the statistical package IBM SPSS Version 20.0 software (IBM Corp., US).
Fig. 2 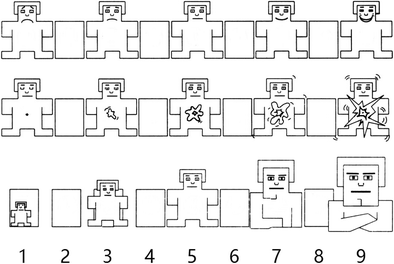
Self-Assessment Manikins (SAMs) for valence (top), arousal (middle), and dominance (bottom).

Measurement of mental state
To identify the participants’ psychological states when they participated in the experiment, the Japanese version (Shimizu & Imae, 1981) of the State–Trait Anxiety Inventory (STAI; Spielberger, Gorsuch, & Lushene, 1970) was used. This questionnaire is used to diagnose and distinguish a participant’s level of anxiety at the time of filling out the questionnaire. The STAI has two parts: state anxiety and trait anxiety. Our study used the state anxiety part (STAI-S), which consists of 20 statements that measure anxiety according to the situation. All items are rated on a four-point scale from almost never to almost always. A higher score indicates a higher level of anxiety.
Procedure
The participants were guided into a soundproof experimental booth and sat in front of a computer monitor at a distance of approximately 70 cm. After receiving a detailed briefing on the experimental purpose and providing informed consent, two online pre-questionnaire investigations, the STAI-S (Spielberger et al., 1970), and the Edinburgh Handedness Inventory (Oldfield, 1971), were administered. The investigations lasted approximately 10 min.
On the affective rating task, first of all, six practice sounds that were excluded from the experimental stimuli but had the same characteristics as the experimental stimuli were used to illustrate the evaluation task and to allow practice making ratings. After participants had listened to each sound, six independent emotional rating scales (the SAM and the basic-emotion rating scales) were provided for ratings. The practice session lasted approximately 3 min and was conducted to ensure that the participants were fully familiar with the experiment task.
During the experimental session, each participant was randomly assigned to one of the nine sound groups. The experimental task was the same as in the practice session. Each trial was conducted at the participant’s own pace. The average duration of one trial was approximately 30 s. Participants were made to rate all 52 sounds in one block at a stretch. The order of the two blocks was counterbalanced among the participants who rated the sounds in the same group. A 5-min break was inserted between the two experimental blocks to reduce the participants’ fatigue. Each experimental session lasted approximately 1 h 10 min.
Results and discussion
Reliability
We calculated the STAI-S scores for all participants. The means and standard deviations of the STAI-S scales by gender were 40.20 (SD = 5.57) for female participants and 41.34 (SD = 6.28) for male participants. Mean scores of STAI-S in this study were in the normal range (32–42 points for male participants and 31–41 points for female participants) of the mental state (Iwata & Higuchi, 2000). These results suggested that none of the participants showed extreme uneasiness on the day of the experiment.
Ratings for each sound of the IADS-E are presented in the first sheet to third sheet of the supplementary materials. The supplementary materials list the mean values (M) and standard deviations (SD) for arousal (Aro), valence (Val), dominance (Dom), fear (Fear), happiness (Hap), and sadness (Sad) for each of the 935 sounds, considering the total sample (All) and the male and female subsamples separately. We calculated the Cronbach’s alpha for all sounds using ratings from 22 participants (α = .95 for valence, α = .92 for arousal, α = .81 for dominance, α = .92 for fear, α = .92 for happiness, and α = .82 for sadness) to validate the internal consistency as the previous studies did (i.e., Drače, Efendić, Kusturica, & Landzo, 2013; Dufey, Fernández, & Mayol, 2011; Suk & Irtel, 2010). The results suggested that the affective ratings for each sound in our study were reliable (Iacobucci & Duhachek, 2003). The coefficient of variation (CV) was also calculated, to evaluate the variability in the affective ratings; the average values of the CVs for the present study across different affective dimensions were CVVal = 31.23%, CVAro = 21.04%, CVDom = 19.95%, which revealed a common pattern with the IADS-2 (CVVal = 36.60%, CVAro = 19.74%, CVDom = 24.66%). We also compared the standard deviations of the ratings for the IADS-2 sounds between this study and the original one (Bradley & Lang, 2007a). The mean standard deviations (SDms) of the IADS-2 sounds in our study (SDmAro = 1.58, SDmVal = 1.46, SDmDom = 2.05) were obviously lower than in the previous research (SDmAro = 1.92, SDmVal = 1.76, SDmDom = 1.91). Thus, even though the number of the participants was smaller than in the original IADS-2 study, the ratings in our study were relatively stable.
Affective Ratings for the IADS-E
-
(1)
Correlation analyses of valence and arousal We calculated the number of sounds in arousal–valence coordinates, with the origin at ratings of 5. The numbers of sounds in the IADS-E from the first to the fourth quadrants were 156, 155, 138, and 486, respectively. Figure 3 more concretely indicates the numbers of sounds in the two-dimensional affective space defined by the mean valence and arousal. As compared to the original version of the IADS-2, the numbers of sounds in all four quadrants are increased. This may make it easier to choose sounds from each emotional condition. Figure 4a illustrates the distributions of the IADS-E stimuli in the two-dimensional affective space defined by the mean valence and arousal of each sound. The valence–arousal distribution of the IADS-E sounds was boomerang-shaped (i.e., sounds rated as either high positive or high negative tended to be rated with high arousal scores), like that obtained in the IADS-2 (Bradley & Lang, 2007a, Fig. 1).

Numbers of sound stimuli in the two-dimensional affective space defined by mean valence and arousal, for (a) IADS-E and (b) IADS-2

Distributions of overall mean values for the IADS-E sounds in the valence–arousal affective dimensions (a), valence–dominance affective dimensions (b), and arousal–dominance affective dimensions (c)
The correlation coefficient analysis showed that the linear correlation between valence and arousal was r = − .40 (R2 = .16, p < .001), and the quadratic correlation between the two dimensions was r = .44 (R2 = .19, p < .001). As compared to the linear correlation, the contribution ratio of the quadratic correlation was higher and was consistent with those from previous studies (Choi et al., 2015; Redondo et al., 2008; Soares et al., 2013). However, in the quadratic correlation, the correlation value in our study was lower than that found for IADS-2 (r = .47, R2 = .22, p < .001; see Bradley & Lang, 2007a). The difference between the two databases could have been caused by the difference in their total numbers of stimuli. Furthermore, as has been observed in studies using visual stimuli (e.g., Bradley & Lang, 2007b; Lang et al., 2008), most of the positive sounds (i.e., sounds with valence ratings above 5 points, the midpoint of the 9-point scale used, which are located in the upper half of Fig. 4a) were distributed evenly along the arousal dimension. For negative sounds (i.e., sounds with valence ratings below 5, which are located in the lower half of the chart), the ratings were more concentrated in the lower right quadrant of the chart. We divided the sounds into positive and negative sounds and conducted a correlation analysis for each. The association between valence and arousal was stronger for negative sounds (r = − .51, p < .001) than for positive sounds, which did not reach the level of statistical significance (r = − .03, p = .66). This indicates that valence was independent of arousal for positive sounds, but there was a strong negative relationship between valence and arousal for negative sounds. For example, sounds 0379 (Transport), 275 (Scream from IADS-2), and 285 (Attack2 from IADS-2) were given low valence scores (MVal = 1.28, 1.38, and 1.48, respectively) and high arousal scores (MAro = 7.80, 7.88, and 7.04, respectively). The same was not observed for positive sounds: Sounds 1073 (Music), 1074_b (Music), and 1085 (Music) had the highest valence scores (MVal = 7.95, 8.05, and 8.09, respectively), but their arousal scores were not equivalent (MAro = 6.77, 3.45, and 7.77, respectively).
-
(2)
Correlation analyses of dominance–valence and dominance–arousal The distributions of the IADS-E ratings in the valence–dominance and arousal–dominance dimensions are showed in Fig. 4b and c, respectively. The correlation coefficient analysis showed a strong positive relationship between valence and dominance (r = .74, R2 = .54, p < .001) and a negative relationship between arousal and dominance (r = − .51, R2 = .26, p < .001). These results indicate that people feel more powerful when they hear positive sounds and feel feeble when they hear high-arousal sounds. Similar trends also occurred in the IADS-2 (r = .94, R2 = .88, p < .001, for valence and dominance; r = − .54, R2 = .29, p < .001, for arousal and dominance; see Bradley & Lang, 2007a).
-
(3)
Ratings for basic emotion rating scales We have categorized each sound into three groups by the elicited emotions’ distribution variabilities based on 90% confidence intervals (CIs), just as in a previous study (Mikels et al., 2005). For a given sound, if the mean for one basic emotion was higher than the mean of the other two emotions, and if there was no overlap between the CIs for the dominant emotion and the remaining emotions, it was assigned to a single basic emotion category. If two basic emotions were higher than the mean of the other one basic emotion and if the CIs of the two higher means overlapped with each other, the sound was assigned to a blended category. If all three CIs overlapped, the sound was assigned as undifferentiated. As it turned out, 663 sounds were categorized as single basic emotions—happiness (254), fear (391), and sadness (18)—154 as blended emotion sounds—happiness and fear (87), fear and sadness (52), and happiness and sadness (15)—and 118 as undifferentiated sounds. For details on the basic emotion classification for each sound, please refer to the supplementary materials. The correlation coefficient analysis showed strong negative relationships between fear and happiness (r = − .71, R2 = .51, p < .001) and sadness and happiness (r = − .49, R2 = .24, p < .001), as well as a positive relationship between fear and sadness (r = .55, R2 = .30, p < .001). The distribution of the IADS-E ratings on the three basic-emotion rating scales can be seen in Fig. 5 (a 3-D scatterplot). The ratings of basic emotions could assist researchers in choosing emotional stimuli more accurately from a discrete categorical perspective according to their research purpose. However, unfortunately, the number of sounds that elicited sadness was particularly small, and we measured only three basic emotions in this study. These issues need to be addressed in future research.
-
(4)
Relationship between the affective dimensions and basic-emotion rating scales To ascertain the relationships between the three dimensions (i.e., valence, arousal, and dominance) and the three basic-emotion rating scales (i.e., fear, happiness, and sadness), Pearson correlation analyses were performed. The results suggested that the ratings of valence (rFear = − .82, p < .001; rSad = − .37, p < .001) and dominance (rFear = − .86, p < .001; rSad = − .43, p < .001) have negative correlations with fear and sadness, but positive correlations with happiness (rVal = .84, p < .001; rDom = .57, p < .001). The ratings of arousal showed a positive correlation with fear (r = .40, p < .001) and a weak negative correlation with sadness (r = − .10, p < .01), but no correlation with happiness. As has been demonstrated in previous studies (Choi et al., 2015; Stevenson & James, 2008), valence and dominance showed positive relationships with happiness but negative relationships with the other basic emotion rating scales (i.e., fear and sadness), whereas the opposite pattern was observed for arousal.

A 3-D scatterplot shows the distribution of overall mean values for the IADS-E in the basic-emotion rating scales
Table 1 shows the descriptive statistics for the sound ratings on all affective ratings scales in each semantic category. The ratings in each semantic category have their unique features; for example, sounds in music tend to have more positive ratings, whereas breaking sounds tend to have more negative and arousing ratings. The correlation coefficients for the affective rating scales in each semantic category are shown in Table 2. Although the correlation values are consistent when using all sounds, some subtle differences exist in each semantic category. Considering these results, researchers could choose sounds from every semantic category in line with their purpose.
According to these results, we considered that all 935 sounds (including those from the IADS-2) provide a new version of the standardized affective auditory stimulus database that is capable of effectively evoking emotion. However, the number of sounds in the low valence–arousal quadrant is particularly scarce relative to the other three quadrants, thus suggesting that negative stimuli would be rated as much more arousing, irrespective of whether they are auditory or visual stimuli.
The ratings of basic emotions could assist researchers in choosing emotional stimuli more accurately, according to their research purpose. Unfortunately, because of the long experimental time, we measured only three basic emotions in this study. Further research should measure other basic emotions, such as disgust, anger, and surprise.
Sex difference in sounds ratings
A multivariate analysis of variance (MANOVA) was conducted with between-subjects factors to determine whether differences existed between the genders (male and female) for all affective rating scales with all sounds. The results suggested that the main effects of gender in the ratings of arousal, F(1, 1868) = 2.61, p = .11, η2 = .001; dominance, F(1, 1868) = 0.28, p = .60, η2 = .00; and fear, F(1, 1868) = 0.23, p = .63, η2 = .00, did not reach statistical significance here, but the ratings of valence, F(1, 1868) = 8.27, p = .004, η2 = .004; happiness, F(1, 1868) = 29.49, p < .001, η2 = .02; and sadness, F(1, 1868) = 31.47, p < .001, η2 = .02, did show significant differences between the genders. Table 3 shows the descriptive statistics for valence, arousal, and dominance for the female and male subsamples in each semantic category separately. The results suggest that Japanese men assessed the sounds as being much more emotional than did the women; however, the difference according to gender was particularly small.
Pearson’s correlations were calculated in order to examine the relationship between the ratings of arousal, valence, and dominance for each semantic category and gender separately (Table 4). The relationship between every two affective dimensions showed differences in each semantic category between males and females. We also identified differences in the affective ratings for each sound between the genders. The distance between male and female participants’ affective ratings in the dimensions of valence and arousal was measured for each of the 935 sounds and converted into a z-score. A large z-score indicates a greater difference in ratings between the male and female participants. Table 5 lists 16 sounds for which the standardized distance was greater than 2.5 standard deviations.
As we mentioned above, even though no pronounced differences were found in gender, there are still some specific individual sounds’ ratings showed big gaps in gender. We should pay attention to these sounds when selecting the experimental materials.
Physical intensity
Correlation analyses were performed to identify the relationship between sounds’ physical intensities and their affective ratings. The Pearson correlation coefficients between a sound’s peak intensity (Lmax) and affective ratings were r = − .31 (p < .001) for valence, r = .47 (p < .001) for arousal, r = − .39 (p < .001) for dominance, r = .32 (p < .001) for fear, r = − .10 (p = .003) for happiness, and r = .18 (p < .001) for sadness. The relationship between valence and the peak intensity across the 935 sounds was inconsistent with Bradley and Lang’s (2000) research, which suggested that there is no correlation between valence and peak sound intensity. On the other hand, arousal had a significant positive relationship with peak sound intensity, and this result is consistent with Bradley and Lang’s (2000) study. To further clarify the relationship between the affective ratings and physical intensity, quadratic correlations were calculated between peak sound intensity and affective ratings. The results showed that only valence (r = .34, p < .001) and happiness (r = .17, p < .001) reached the level of significance; however, these correlations accounted for only 11.5% and 3%, respectively, of the valence and happiness variance. These results revealed that physically intense sounds were more likely to be highly arousing and to cause a fear response, but the relationship between a sound’s physical intensity and valence looks more complex.
To clarify this problem, we first divided the sounds into three conditions according to the valence rating (ratings higher than 6 for positive sounds, greater than or equal to 4 and less than or equal to 6 for neutral sounds, and less than 4 for negative sounds). Then we calculated the percentages of the sounds in three different physical intensity ranges: low intensity (peak intensity ≤ 70 dB), moderate intensity (70 dB < peak intensity < 75 dB), and high intensity (peak intensity ≥ 75 dB) under the three valence types (Table 6). For sounds categorized as having positive or neutral valence, there were more sounds with low and moderate than with high intensities, whereas for negative valence, there were more sounds with high and moderate than with low intensities. This clarifies that the positive sounds are usually mild, whereas the negative sounds are usually perceived as being intense and strong. However, the numbers of sounds in the IADS-2 for each intensity were distributed relatively uniformly. On the basis of the results in Table 6, we suspect that when people make an evaluation for the valence dimension, Americans may focus on both the physical intensity of sounds and the context in which the sound is expressed; Japanese participants, on the other hand, may pay more attention to the content of the sounds. This interpretation should be considered in other subsequent research.
Comparison of affective ratings for the IADS-2 sounds
We compared the affective ratings of the IADS-2 sounds in the original version (Bradley & Lang, 2007a) with the results in our study. Table 7 presents the means, standard deviations, the minimal and maximal values for the ratings of arousal, valence, and dominance from our study and the original study separately. Very high Pearson correlations were obtained for all three ratings, of valence, arousal, and dominance, between the two groups (rVal = .81, p < .001; rAro = .76, p < .001; rDom = .71, p < .001). The results indicate that the two groups of participants rated the IADS-2 sounds in similar manners.
To evaluate the differences in each affective dimension, a MANOVA was conducted with culture as a between-subjects factor and with the affective dimensions as dependent variables. The ratings of arousal, F(1, 332) = 0.002, p = .96, η2 = .00, did not reach the level of statistical significance here, but the ratings of dominance, F(1, 332) = 7.44, p < .01, η2 = .02, and valence, F(1, 332) = 4.58, p < .05, η2 = .01, showed significant differences between the two groups. The Japanese participants rated sounds as less positive and more dominant than did the original participants (Table 7). To clarify in more detail the differences for individual sounds in the IADS-2, we calculated the distances in the dimensions of valence and arousal for each of the 167 sounds between our study and the original version, and then converted each distance into a z-score. Table 8 lists ten sounds for which the standardized distance was greater than two standard deviations. The sounds closely related to human activities, such as erotic sounds (202, 216, 201, 215, and 210), a boy laughing (220), a party (365), a roller coaster (360), and a belch (702), showed no difference in the arousal dimension; however, for valence, the original raters rated them as more positive than in this study. For the sound of a thunderstorm (602), our participants rated it as more negative and higher in arousal than did those in the original version.
Overall, although we must note carefully that our participants evaluated the IADS-2 sounds in a highly similar way to the participants in the original version, it is also true that some slight differences have been found. These differences should not be overlooked, particularly for the sounds closely related to human activities.
Conclusion
In this article, we collected 935 affective sounds based on the IADS-2 and tried to expand and improve the existing affective auditory stimuli database. The results showed that we could successfully provide a larger standardized database of emotional-evocative stimuli, which includes contents across a wider range of semantic categories. Through our research, the new affective sound stimulus standardized database (IADS-E) may enable the comparison of results across various kinds of auditory research.
On the other hand, it is obvious that real-life emotional experiences mostly rely on the presence of combined stimuli coming from multiple sensory modalities (Baumgartner, Esslen, & Jäncke, 2006). Information received may have been transmitted through different modalities and channels. Auditory stimuli can increase the power of affective visual stimuli, and vice versa. The visual and auditory modalities can integrate to provide a complete assessment of the emotional qualities of a situation or an object (Gerdes et al., 2014). Through this article, we expected to be able to provide a reliable auditory stimulus database to examine the mechanism of emotional processing of different modalities and promote this kind of emotional research.
As we mentioned earlier, there are still some limitations to our study. First, as compared with a visual stimulus database such as the IAPS (Lang et al., 2008), although the IAPS did not make the number of stimuli in each arousal–valence quadrant equal either, it is obvious that the IAPS’s distribution is relatively balanced. In response to this study, we are committed to increasing the number of sounds for the quadrants that have few sounds and trying to develop a more practical affective sound stimulus database. Second, though the auditory stimuli were less sensitive than visual stimuli are to gender influences, there were still some individual sound stimuli with large differences in gender. Therefore, when we select experimental stimuli for psychological experiments, it is necessary to pay attention to the specific individual sounds. Third, one might want to argue that the new database is just a local database for Japanese research, because our main participants were Japanese college students. Even though we have determined that the participants in our study and in the original version rated sound stimuli in highly similar manners, whether or not the emotional ratings obtained in this study would be applicable to the elderly, children, or those in other countries remains to be explored in further studies. Fourth, in this study we assessed only three basic emotions (happiness, sadness, and fear); to offer a more complete characterization of the basic emotions aroused by the IADS-E stimuli, further research should measure other basic emotions, such as disgust, anger, and surprise.
References
Armony, J. L., Aubé, W., Angulo-Perkins, A., Peretz, I., & Concha, L. (2015). The specificity of neural responses to music and their relation to voice processing: An fMRI-adaptation study. Neuroscience Letters, 593, 35–39. https://doi.org/10.1016/j.neulet.2015.03.011
Banse, R., & Scherer, K. R. (1996). Acoustic profiles in vocal emotion expression. Journal of Personality and Social Psychology, 70, 614–636. https://doi.org/10.1037/0022-3514.70.3.614
Baumgartner, T., Esslen, M., & Jäncke, L. (2006). From emotion perception to emotion experience: Emotions evoked by pictures and classical music. International Journal of Psychophysiology, 60, 34–43. https://doi.org/10.1016/j.ijpsycho.2005.04.007
Belin, P., Fillion-Bilodeau, S., & Gosselin, F. (2008). The Montreal Affective Voices: A validated set of nonverbal affect bursts for research on auditory affective processing. Behavior Research Methods, 40, 531–539. https://doi.org/10.3758/BRM.40.2.531
Bradley, M., & Lang, P. J. (1994). Measuring emotion: The Self-Assessment Manikin and the semantic differential. Journal of Behavior Therapy and Experimental Psychiatry, 25, 49–59. https://doi.org/10.1016/0005-7916(94)90063-9
Bradley, M. M., & Lang, P. P. J. (1999). International Affective Digitized Sounds (IADS-1): Stimuli, instruction manual, and affective ratings (Technical Report No. B-2). Gainesville, FL: University of Florida, Center for Research in Psychophysiology.
Bradley, M. M., & Lang, P. J. (2000). Affective reactions to acoustic stimuli. Psychophysiology, 37, 204–215. https://doi.org/10.1111/1469-8986.3720204
Bradley, M. M., & Lang, P. J. (2007a). The International Affective Digitized Sounds: Affective ratings of sounds and instruction manual (Technical Report No. B-3). Gainesville, FL: University of Florida, NIMH Center for the Study of Emotion and Attention.
Bradley, M. M., & Lang, P. J. (2007b). Affective Norms for English Words (ANEW): Instruction manual and affective ratings (Technical Report No. C-1). Gainesville, FL: University of Florida, Center for Research in Psychophysiology.
Buodo, G., Sarlo, M., Mento, G., Messerotti Benvenuti, S., & Palomba, D. (2017). Unpleasant stimuli differentially modulate inhibitory processes in an emotional Go/NoGo task: An event-related potential study. Cognition and Emotion, 31, 127–138. https://doi.org/10.1080/02699931.2015.1089842
Castonguay, A. L., Sabiston, C. M., Crocker, P. R. E., & Mack, D. E. (2014). Development and validation of the Body and Appearance Self-Conscious Emotions Scale (BASES). Body Image, 11, 126–136. https://doi.org/10.1016/j.bodyim.2013.12.006
Castro, S. L., & Lima, C. F. (2010). Recognizing emotions in spoken language: A validated set of Portuguese sentences and pseudosentences for research on emotional prosody. Behavior Research Methods, 42, 74–81. https://doi.org/10.3758/BRM.42.1.74
Choi, Y., Lee, S., Choi, I. M., Jung, S., Park, Y. K., & Kim, C. (2015). International Affective Digitized Sounds in Korea: A cross-cultural adaptation and validation study. Acta Acustica United with Acustica, 101, 134–144. https://doi.org/10.3813/AAA.918811
Choi, Y., Lee, S., Jung, S., Choi, I.-M., Park, Y.-K., & Kim, C. (2016). Erratum to: Development of an auditory emotion recognition function using psychoacoustic parameters based on the International Affective Digitized Sounds. Behavior Research Methods, 48, 827. https://doi.org/10.3758/s13428-015-0596-x
Czigler, I., Cox, T. J., Gyimesi, K., & Horváth, J. (2007). Event-related potential study to aversive auditory stimuli. Neuroscience Letters, 420, 251–256. https://doi.org/10.1016/j.neulet.2007.05.007
da Silva, S. P., & Backs, R. W. (2015). Cardiac response during auditory selective attention to tones and affective sounds. Psychophysiology, 52, 1099–1105. https://doi.org/10.1111/psyp.12432
Drače, S., Efendić, E., Kusturica, M., & Landzo, L. (2013). Cross-cultural validation of the “international affective picture system”(IAPS) on a sample from bosnia and herzegovina. Psihologija, 46, 17–26. doi:https://doi.org/10.2298/PSI1301017D
Droit-Volet, S., Ramos, D., Bueno, J. L. O., & Bigand, E. (2013). Music, emotion, and time perception: The influence of subjective emotional valence and arousal? Frontiers in Psychology, 4, 417:1–12. doi:https://doi.org/10.3389/fpsyg.2013.00417
Dufey, M., Fernández, A. M., & Mayol, R. (2011). Adding support to cross-cultural emotional assessment: Validation of the International Affective Picture System in a Chilean sample. Universitas Psychologica, 10, 521–533.
Ekman, P. (1992). Are there basic emotions? Psychological Review, 99, 550–553. https://doi.org/10.1037/0033-295X.99.3.550.
Esslen, M., Pascual-Marqui, R. D., Hell, D., Kochi, K., & Lehmann, D. (2004). Brain areas and time course of emotional processing. NeuroImage, 21, 1189–1203. https://doi.org/10.1016/j.neuroimage.2003.10.001
Fabiani, M., Kazmerski, V. A., Cycowicz, Y. M., & Friedman, D. (1996). Naming norms for brief environmental sounds: Effects of age and dementia. Psychophysiology, 33, 462–475.
Fazio, R. H. (2001). On the automatic activation of associated evaluations: An overview. Cognition and Emotion, 15, 115–141. https://doi.org/10.1080/0269993004200024
Gerdes, A. B. M., Wieser, M. J., & Alpers, G. W. (2014). Emotional pictures and sounds: A review of multimodal interactions of emotion cues in multiple domains. Frontiers in Psychology, 5, 1351:1–10. https://doi.org/10.3389/fpsyg.2014.01351
Iacobucci, D., & Duhachek, A. (2003). Advancing alpha: Measuring reliability with confidence. Journal of Consumer Psychology, 13, 478–487. https://doi.org/10.1207/S15327663JCP1304_14
Iwata, N., & Higuchi, H. R. (2000). Responses of Japanese and American university students to the STAI items that assess the presence or absence of anxiety. Journal of Personality Assessment, 74, 48–62. https://doi.org/10.1207/S15327752JPA740104
Jaquet, L., Danuser, B., & Gomez, P. (2012). Music and felt emotions: How systematic pitch level variations affect the experience of pleasantness and arousal. Psychology of Music, 42, 51–70. https://doi.org/10.1177/0305735612456583
Juslin, P. N., & Laukka, P. (2003). Communication of emotions in vocal expression and music performance: Different channels, same code? Psychological Bulletin, 129, 770–814. https://doi.org/10.1037/0033-2909.129.5.770
Krosnick, J. A., & Presser, S. (2010). Question and questionnaire design. In P. V. Marsden & J. D. Wright (Eds.), Handbook of survey research (pp. 263–314). Bingley, UK: Emerald Group.
Lang, P. J. (1980). Behavioral treatment and bio-behavioral assessment: Computer applications. In J. B. Sidowski, J. H. Johnson, & T. A. Williams (Eds.), Technology in mental health care delivery (pp. 119–137). Norwood, NJ: Ablex.
Lang, P. J., Bradley, M. M., & Cuthbert, B. N. (1997). International Affective Picture System (IAPS): Technical manual and affective ratings (Technical Report No. A-1). Gainesville, FL: University of Florida, NIMH Center for the Study of Emotion and Attention.
Lang, P. J., Bradley, M. M., & Cuthbert, B. N. (2008). International affective picture system (IAPS): Affective ratings of pictures and instruction manual (Technical Report A-8). Gainesville, FL: University of Florida, Center for Research in Psychophysiology.
Lang, P. J., Greenwald, M. K., Bradley, M. M., & Hamm, A. O. (1993). Looking at pictures: Affective, facial, visceral, and behavioral reactions. Psychophysiology, 30, 261–273. https://doi.org/10.1111/j.1469-8986.1993.tb03352.x
Lindquist, K. A. (2010). The brain basis of emotion: A meta-analytic review. Dissertation Abstracts International, B: Sciences and Engineering, 71, 2744. https://doi.org/10.1017/S0140525X11000446
Liu, P., & Pell, M. D. (2012). Recognizing vocal emotions in Mandarin Chinese: A validated database of Chinese vocal emotional stimuli. Behavior Research Methods, 44, 1042–1051. https://doi.org/10.3758/s13428-012-0203-3
Lolli, S. L., Lewenstein, A. D., Basurto, J., Winnik, S., & Loui, P. (2015). Sound frequency affects speech emotion perception: Results from congenital amusia. Frontiers in Psychology, 6, 1340:1–10. https://doi.org/10.3389/fpsyg.2015.01340
Marchewka, A., Zurawski, L., Jednoróg, K., & Grabowska, A. (2014). The Nencki Affective Picture System (NAPS): Introduction to a novel, standardized, wide-range, high-quality, realistic picture database. Behavior Research Methods, 46, 596–610. https://doi.org/10.3758/s13428-013-0379-1
Marin, M. M., Gingras, B., & Bhattacharya, J. (2012). Crossmodal transfer of arousal, but not pleasantness, from the musical to the visual domain. Emotion, 12, 618–631. https://doi.org/10.1037/a0025020
Mikels, J. A., Fredrickson, B. L., Larkin, G. R., Lindberg, C. M., Maglio, S. J., & Reuter-Lorenz, P. A. (2005). Emotional category data on images from the International Affective Picture System. Behavior Research Methods, 37, 626–630. https://doi.org/10.3758/BF03192732
Oldfield, R. C. (1971). The assessment and analysis of handedness: The Edinburgh inventory. Neuropsychologia, 9, 97–113. https://doi.org/10.1016/0028-3932(71)90067-4
Pell, M. D., & Kotz, S. A. (2011). On the time course of vocal emotion recognition. PLoS ONE, 6, e27256. https://doi.org/10.1371/journal.pone.0027256
Redondo, J., Fraga, I., Padrón, I., & Piñeiro, A. (2008). Affective ratings of sound stimuli. Behavior Research Methods, 40, 784–790. https://doi.org/10.3758/BRM.40.3.784
Schindler, S., & Kissler, J. (2016). Selective visual attention to emotional words: Early parallel frontal and visual activations followed by interactive effects in visual cortex. Human Brain Mapping, 37, 3575–3587. https://doi.org/10.1002/hbm.23261
Schirmer, A., & Kotz, S. A. (2006). Beyond the right hemisphere: Brain mechanisms mediating vocal emotional processing. Trends in Cognitive Sciences, 10, 24–30. https://doi.org/10.1016/j.tics.2005.11.009
Shimizu, H., & Imae, K. (1981). Development of Japanese collegiate version of State–Trait Anxiety Inventory (in Japanese). Japanese Journal of Educational Psychology, 29, 62–67.
Shuman, V., Clark-Polner, E., Meuleman, B., Sander, D., & Scherer, K. R. (2015). Emotion perception from a componential perspective. Cognition and Emotion, 31, 47–56. https://doi.org/10.1080/02699931.2015.1075964
Soares, A. P., Pinheiro, A. P., Costa, A., Frade, C. S., Comesaña, M., & Pureza, R. (2013). Affective auditory stimuli: Adaptation of the International Affective Digitized Sounds (IADS-2) for European Portuguese. Behavior Research Methods, 45, 1168–1181. https://doi.org/10.3758/s13428-012-0310-1
Spielberger, C.D., Gorsuch, R. L., & Lushene, R. E. (1970). STAI: Manual for the State–Trait Anxiety Inventory (“Self-Evaluation Questionnaire”). Palo Alto, CA: Consulting Psychologists Press.
Stevenson, R. A, & James, T. W. (2008). Affective auditory stimuli: Characterization of the International Affective Digitized Sounds (IADS) by discrete emotional categories. Behavior Research Methods, 40, 315–321. https://doi.org/10.3758/BRM.40.1.315
Suk, H. J., & Irtel, H. (2010). Emotional response to color across media. Color Research and Application, 35, 64–77. https://doi.org/10.1002/col.20554
Vieillard, S., Peretz, I., Gosselin, N., Khalfa, S., Gagnon, L., & Bouchard, B. (2008). Happy, sad, scary and peaceful musical excerpts for research on emotions. Cognition and Emotion, 22, 720–752. https://doi.org/10.1080/02699930701503567
Zillmann, D. (1988). Mood management through communication choices. American Behavioral Scientist, 31, 327–340.
Author note
This research was supported by the Center of Innovation Program of the Japan Science and Technology Agency (JST). In addition, we thank Syouichi Shiota, Madoca Miyagi, and Shiho Kashihara for their kind advice on the manuscript and analysis. Special thanks to Yuko Sonobe, Shogo Aida, Narumi Yamagata, Masashi Nishijima, Aiko Nagao, and Noriko Miura for their assistance with the experiments and data collection.
Author information
Authors and Affiliations
Corresponding author
Electronic supplementary material
ESM 1
(XLSX 553 kb)
Rights and permissions
About this article

Cite this article
Yang, W., Makita, K., Nakao, T. et al. Affective auditory stimulus database: An expanded version of the International Affective Digitized Sounds (IADS-E). Behav Res 50, 1415–1429 (2018). https://doi.org/10.3758/s13428-018-1027-6
Published:
Issue Date:
DOI: https://doi.org/10.3758/s13428-018-1027-6