
Abstract
Background
Human identification is of a paramount forensic concern. It includes sex determination which becomes extremely complex and tricky especially in fragmentary remains.
Purpose of the study
We aimed to evaluate the accuracy of ten dimensions of foramen magnum (FM) and occipital condyles in determination of sex among 367 subjects (204 females and 163 males), their ages ranged between 18-75 years. Multislice Computed Tomography images of skulls of the studied patients were obtained from the Radiology Department. Ten different anatomical variables of the FM were measured by two independent experienced radiologists blinded to the study.
Results
FM dimensions are unique and show significant sexual dimorphism in the studied Egyptian population especially with application of discriminant function analysis. These landmarks include foramen magnum length and width (FML, FMW), FM index, FM area, length of the right and left occipital condyles (LROC, LLOC), width of the right occipital condyle (WROC), maximum bicondylar distance (MBD) and minimum intercondylar distance (MnICD). LROC and FMW are highly significant discriminating variables predicting sex.
Conclusions
It is concluded that all the studied FM parameters showed significant differences between males and females except the left occipital condylar width with higher male values when compared to females. Additionally, the right occipital condylar length and FM width are highly significant discriminating variables which are strongly beneficial in prediction of sex. FM dimensions would provide a reliable additional tool for identification of sex among adult population and could be specific for Egyptians in case of fragmentary remains or damaged skulls.
Introduction
Sex determination is an essential biological trait of human identification process which becomes extremely complex and tricky in case of dispersed and fragmentary remains especially with minimum forensic evidence (Tambawala et al., 2016). In forensic context, sexual determination is directly related to the quantity and quality of bone remains. The more bones available, the better opportunity will be for reliable sex assessment results (González-Colmenares et al., 2019). With intact corpse, sex can be determined based on the morphological characteristics of the pelvis with about 95% accuracy, followed by 92% for the cranium (Ekizoglu et al., 2016); meanwhile, with fragmented corpse, sex estimation will be more challenging and based on different bony parts (Toneva et al., 2018).
The most reliable sexually dimorphic bones of the human skeleton are the innominate bones (Tambawala et al., 2016). From a forensic point of view, the basicranium has a resistant nature and is a commonly preserved part of human skeleton in disastrous injuries or due to the effects of inhumation and taphonomic processes compared to other craniofacial bones owing to its distinguishable location in the base of the skull, its thickness and the large volume of soft tissues covering it (Chovalopoulou & Bertsatos, 2017). One of the important landmarks of the basicranium is the Foramen Magnum (FM) that attracted considerable interest and has various scientific and legal applications especially in sexual dimorphism mainly in the context of having significantly large number of fragmentary remains such as victims of mass disasters or with decomposed skeletonized bodies (Toneva et al., 2018).
Radiologically, the skull is one of the most useful bones for accurate morphometric determination of sex. The use of radiological methods such as X-ray, computed tomography (CT) and magnetic resonance imaging, is striking and provides data that is consistent with measurements derived through using calipers in estimation of dry skull diameters (Zheng et al., 2018). Previous morphometric cranial analyses using CT imaging measuring the accuracy rates have been conducted in different populations (Ekizoglu et al., 2016; Chovalopoulou & Bertsatos, 2017; RaghavendraBabu et al., 2012; Edwards et al., 2013; Abdel-Karim et al., 2015; Omer et al., 2015; Tellioglu et al., 2018; Vidisha et al., 2019).
Despite its forensic potential in the identification of skeletal remains, only a few morphometric studies of the foramen magnum region have been published so far in the Arab region (Madadin et al., 2017).To the best of our knowledge, there is very scarce data regarding dimensions of foramen magnum in the Egyptian population. Those studies included a small unrepresentative sample size and did not investigate the whole FM metric parameters. Thus, the aim of this work is to assess the accuracy of foramen magnum dimensions to determine sexual dimorphism in a sample of Egyptian population, and to build a reliable discriminant function tool for sex estimation when only a fragment of base of the skull is brought for identification of adult population using CT radiological scanning.
Material & methods:
Study population
The work is a retrospective study which comprised the analysis of cranial CT images. They were enrolled with patients records and were randomly collected from the database registered at the Radiology department during the period between January 2018 and December 2018.
Inclusion criteria
-
a.
Normal scans of human skulls (18-75 years of both sexes and matched ages) for those who had computed tomography for various diagnostic medical or surgical indications.
-
b.
High quality reconstructed CT images.
Exclusion criteria
-
a.
Low quality blurred images or those with artifacts and those do not cover the entire extent of the foramen magnum.
-
b.
Scans of subjects with history of trauma, surgery or, any other pathological abnormalities either congenital or with acquired focal brain lesions that may be causing deformities in the skull base region.
Ethical consideration
The study was approved by the Institutional Review Board of Mansoura University (R/18.03.107), Faculty of Medicine.
Imaging procedure
Multislice Computed Tomography (MSCT) scans of the skull (bone window) were retrieved from the database of the Radiology department. All MSCT images were prescribed by GE optima 16 slice,USA),and the digital images were obtained at 120 kV, 300 mA, with an exposure time of 12 s. The field of examination was12 cm (0.5 per slice); using Optima CT 520 series (14BW25.15_SP1-9-1KL_S_KLDOD16_G_HLT) software. A bone preset was used to emphasize the bone details in the image; the window width was automatically set to 800.0 and the window center to 600.0.The occipital condyles and foramen magnum were viewed in the axial plane at a level horizontal to that of the image window. A slab thickness of 10.0 mm was applied to incorporate the series of CT images taken to the foramen magnum and to allow the points of maximum distance along the length and width of the feature to be established.
Methods
Cranial measurements of foramen magnum and occipital condyles
The following descriptive and metric measurements (as shown in Fig. 1) were taken (in cm.) according to Uysal et al. (2005) and Chovalopoulou and Bertsatos (2017).
- 1.
Maximum internal length of the foramen magnum (FML) measured in an anteroposterior direction along the principal axis of the FM in mid-sagittal plane (the basion–opisthion distance).
- 2.
Maximum internal width of the foramen magnum (FMW) measured approximately perpendicular to the FML and recorded at the widest transverse diameter of the FM (the greatest distance between the lateral borders of the foramen magnum; perpendicular to the mid-sagittal plane).
- 3.
The measured length and width will be inserted into two different reported formulae to estimate:
The foramen magnum index (FMI), it is the quotient of the anteroposterior and transverse diameters; FMI = WFM/LFM X 100.
The foramen magnum area (FMA), according to Routal et al. (1984): Area=¼ Xπ X FML X FMW.
- 4.
The maximum length of the right occipital condyle (LROC): measured along the long axis from the edges of the articular surface.
- 5.
The maximum length of the left occipital condyle (LLOC): measured along the long axis from the edges of the articular surface.
- 6.
The maximum width of the right occipital condyle (WROC): measured from the articular edges along a line perpendicular to the long axis.
- 7.
The maximum width of the left occipital condyle (WLOC): measured from the articular edges along a line perpendicular to the long axis.
- 8.
Maximum bicondylar distance (MBD): The distance between the lateral edges of the articular surfaces of the condyles.
- 9.
Minimum intercondylar distance (MnICD): direct distance from the most medial point on the margin of the left occipital condyle to the most medial point on the margin of the right occipital condyle.
Fig. 1 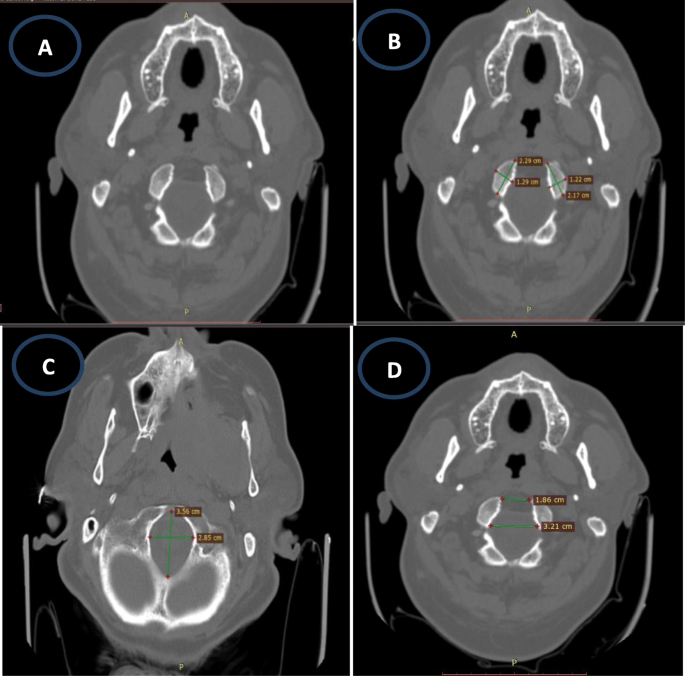
CT scan images of foramen magnum (FM) showing the studied parameters in axial cross sectional views: (A) bony window of the FM and occipital condyles; (B) shows the length and width of occipital condyles on both sides; (C) shows the length and width of FM; (D) shows maximum bicondylar distance and minimum intercondylar distance

Measurements of chosen variables:
The skull base was scanned using MSCT-GE optima at 120 kV. The measurements were taken from axial plane cuts (bone window) with high resolution oblique MPR (multi-planar resolution) images using Optima CT 520 series (14BW25.15_SP1-9-1KL_S_KLDOD16_G_HLT) software. The measurements were recorded by two independent experienced radiologists; both were blinded to the details of age and sex of the subjects.
Statistical analyses
Data were analyzed using the Statistical Package of Social Science (SPSS) program for Windows (Standard version 21). The normality of data was tested with one-sample Kolmogorov-Smirnov test. Continuous variables were presented as mean ± SD (standard deviation). The two groups were compared with student-t test while paired t-test was used to compare paired groups. Correlation between all measured FM dimensions was analyzed by Pearson test.
Sensitivity and specificity at different cut off points were tested by ROC curve. Significant variables on univariate analysis were entered into Logistic regression model or using enter technique test to predict the most significant determinants and to control for possible interactions and confounding effects. Fisher's linear and canonical discriminate functions analysis were performed to identify sex predictor variables. Coefficients and constants were calculated to derive discriminate function equation. We adopted this parameter for the stepwise method as it was considered to be the most effective for distinguishing two groups. A sectioning point was calculated by adding the two group centroids and dividing by two to discriminate between the sexes. A 'leave-one-out' classification was performed to measure the effectiveness of the functions. This classified each individual parameter by the functions derived from all cases other than that case itself and thus cross validated the accuracy of measurements to either male or female. The results were considered significant when p-value is ≤ 0.05.
Results
Computed tomography scans of a total number of 367 adult subjects were eligible for inclusion in the study. They comprised 163 males and 204 females with their ages ranged between 18–75 years. All data were normally distributed according to Shapiro-Wilk test. As shown in Tables (1 and 2), significant differences were found between male and females as regard all studied foramen magnum parameters (p˂0.05) except LOCW. Paired t-test was conducted to ascertain whether any bilateral asymmetry exists regarding the dimensions of the occipital condyles for sex differentiation, ROCW, LOCW showed significant differences in both males and females while ROCL and LOCL were significantly different in females. Additionally, OCL showed insignificant differences in males.
Pearson's correlation was applied for all craniometric measurements among both sexes. Tables (3 and 4) showed the strongest and the weakest correlations between different craniometric parameters. In both sexes, the strongest correlations were found between FMW/FMA and FML/FMA (r= 0.842, 0.869 respectively in males; r= 0.899, 0.903 respectively in females).
As illustrated in Fig. 2, receiver operating characteristic curve was applied to examine the predictability of each variable in estimation of sex. ROCL, FMW, FMA demonstrated strong potential to predict sex (0.725, 0.682, 0.664 respectively); with accuracy up to 67%, 61.3% and 61.4% respectively.

Receiver operating characteristic curve (ROC) for the significant variables (ROCL=0.725, LOCL=0.642, FMW=.682, FMA=.664) among all the measured parameters of foramen magnum and occipital condyles in the studied Egyptian population (n=367). ROCL: right occipital condylar length, LOCL: left occipital condylar length, FMW: foramen magnum width, FMA: foramen magnum area
Table 5 showed the regression analysis done to the estimated parameters. First, univariate regression analysis was applied and it was found that ROCL (OR= 26.2); ROCW (OR= 13.2); FMW (OR= 9.35) are the most independent measurements for prediction of male sex. On entering the significant variables into a stepwise discriminant function analysis, multivariate regression analysis and controlling the confounding factors, only ROCL (OR=20.6) and FMW (OR= 5.86) were selected in the analysis as the most significant independent predictors. An equation is provided by the model to calculate D score aiming to predict sex by substituting the values of the specific measurements in the equation. D-score was set as follows: D= (ROCL x 3.026) + (FMW x 1.768) + -28.857.
Then, the canonical discriminant coefficients for various variables were entered as illustrated in Table (6), with the standardized coefficients indicating how a particular dimension contributed to the classification. The sectioning point was calculated to be 0.055, and then sex determination is determined by comparing the discriminant score with the sectioning point. A value of calculated D greater than the sectioning point indicates male sex, while a value less than the sectioning point indicates female sex. The more extreme the calculated D value from the sectioning point, the higher the probability that the predicted sex is correct. The percentages of correct sex identification by original classification and cross validation were 70.9% and 69% respectively.
Discussion
In medicolegal practice, sex determination is considered the foremost step in identification process solving many of its problems; hence paving the way to determine other parameters such as age and race (Ramamoorthy et al., 2016). Challenges of sex identification may rise especially in high energy mass disasters where only small pieces of human skeleton are the only clue for diagnosis (Tellioglu et al., 2018). Skull morphometric models specifically the basicranium and the area around foramen magnum were evaluated for their accuracies in sexing an unknown skeleton owing to its nature of being composed largely of indestructible hard tissue, the robusticity of the occipital bone and its protective anatomical position (Vidisha et al., 2019; Seifert et al., 2017). It provides a helpful tool for sex differentiation that could be used prior to performing destructive forms of testing studies like DNA analysis; or when such testing is not possible due to degradation as in cases of extensive heat-damage (Akay et al., 2017; Kanchan et al., 2013).
To the best of our knowledge, scarce studies were conducted to evaluate dimorphic characteristics of FM, with only a few parameters taken into consideration. Thus, in the present study, a new set of discriminant measurements of FM and occipital condyles that must be robust against partially broken skulls, were assessed using CT scans of skulls of adult population using discriminant function analysis to determine the best dimorphic variables.
Since the characteristics of skeletal development in childhood and adolescence state that the length of FM attains its adult dimensions by the 5th year of life, whereas the growth in breadth continues until the end of the first decade, with no statistically significant changes in dimensions of skull throughout life (Toneva et al., 2018), thus age categorization was considered neither necessary nor beneficial for the development of sex determination models. In the present study, a sample of 367 adult subjects (204 females and 163 males) was investigated regarding ten FM and occipital condyles dimensions and age was not considered as a target in the study design.
All the studied parameters showed significant differences between males and females (p<0.05) except LOCW; as well, male values were higher than females in all parameters. Comparing these results with those recorded by Abdel-Karim et al. (2015), nearly similar findings were observed as shown in Table 7 apart from the measurements of occipital condyles length, maximum distance and FM width and length which were slightly higher than those recorded in our work. These differences may be due to smaller sample size and the different statistical methods used for the analysis.
In accordance with the present results, it was previously declared that there were significant differences between males and females regarding FM dimensions with higher male values compared to females (Vidisha et al., 2019). In Table 8, the means of FM and occipital condyles measurements obtained in our work are shown in comparison with those published in other international CT imaging studies. As seen, the measurements of the studied population are not similar to their peers in other researches. The length of occipital condyles and MBD in our sample are smaller than Sudanese, Saudi Arabian, Indian populations in both males and females. Meanwhile, the width of occipital condyles in males and females are larger than Sudanese and smaller than Indians. In addition, MnICD is larger than Sudanese and Indian individuals. Concerning FM measurements, its width in the studied sample is nearly equal to Turkish, Sudanese and Saudi Arabians and larger than Iraqi and Indian populations in males, while in females, it is larger than Iraqi and Indians and smaller than Sudanese and Saudi Arabians. For the length of FM in males, it is larger than Iraqi and Indian populations and smaller than Turkish, Sudanese and Saudi Arabian people; and in females it is larger than Turkish, Iraqi and Indian and smaller than Sudanese and Saudi Arabians. Such variation could be due to ethnic differences of the tested populations; various methodological and statistical analytical tools used; differences between the anatomic and radiographic techniques used, as well as sample size in each study.
With respect to mean values of MBD and MnICD in the present study, it was found that males have higher MBD than those recorded by Abdel-Karim et al. (2015) while females had lower values, meanwhile both measurements were significantly lower when compared to those reported in other studies (Table 8). Concerning the mean values of FMI, a significant difference was observed between males and females in the present work, a finding that differs from Vidisha et al. (2019) who claimed the absence of significant difference in FMI between males and females among Indian population.
Interestingly, significant correlations were demonstrated in our research between LOCL/ROCL, LOCW/ROCW, MBD/MnICD, FML/FMW, FML/FMI, FML/FMA, FMW/FMI and FMW/FMA among both sexes, as well MBD/FMW in females, indicating a homogenous growth of males and females in our population. The strongest correlations were noticed between FMW/FMA and FML/FMA in both sexes. Meanwhile, the weakest were those MnICD/MBD in males and MBD/FMW in females. These findings go in accordance with the previous studies conducted by Murshed et al. (2003); Uthman et al. (2012) and El- Barrany et al. (2016).
For more analysis of the studied parameters, we apply ROC curve for ROCL, FMW and FMA which are found to be the highest variables predicting sex in the studied adult population (AUC=0.725, 0.682, 0.664 respectively). This finding differs from that noted by previous studies. For instance, RaghavendraBabu et al. (2012) investigated 90 dry Indian skulls and found that the anteroposterior diameter is the most reliable variable for sex estimation followed by the area of FM, while transverse diameter showed the least predictability in sex determination. Meanwhile, Toneva et al. (2018) found that FMW achieved the highest prediction potential attaining 75% predictability to diagnose sex in their study conducted on 140 Bulgarian adults using CT imaging. Indeed, different ethnicity and varied sample sizes account for these differences.
By performing logistic regression function analysis of independent predictors among the studied population, ROCL and FMW proved to be highly significant discriminating variables to predict sex with OR = 20.6 and 5.86 respectively. That finding is in partial agreement with Abdel-Karim et al. (2015), who stated that the two significant measurements for sex determination in their study were LLC and WFM using binary logistic regression (BLR).
On the other hand, these findings contradict previous studies, for example, Uysal et al. (2005) and El-Barrany et al. (2016) stated that LRC, MnID and WFM emerged as the most significant parameters for the determination of sex in Sudanese population. Additionally, Gobbur et al. (2013) found that the left occipital condylar length and the maximum medial intercondylar distance are the best discriminators for sex. While, Edwards et al. (2013) found that the FM length and width are the best predictors of sex. Furthermore, Madadin et al. (2017) demonstrated that LROC was found to be the best individual parameter in discriminating sex with an accuracy up to 65.5% followed by LLOC and WFM (both having an accuracy of 65%).
Tellioglu et al. (2018) observed that the AP diameter was the most reliable variable using univariate discriminant function test (69% discriminating rate) and when a multivariate discriminant function analysis was performed, this variable was able to detect 64% of women and 70% of men. Meanwhile, Toneva et al. (2018) reported that multivariate functions achieved higher accuracy rates by adding all FM measurements to a discriminant model providing an overall accuracy of almost 82% in modern Iraq population, explaining that by a high collinearity which is confirmed by the strong correlations between the FM measurements.
Despite that most of the previous literatures denied the ability of having a conclusion of sexing accuracy of FM, meanwhile, other substantial studies contradict this view (Kamath et al., 2015). This impresses to develop population specific set of morphometric measures that may help as aiding tool in sexual identification especially in cases of mass disasters and having fragmentary pieces of bones as the only clue to solve the forensic problems of identification (Toneva et al., 2018).
In the present study, the accuracy of predicting the sex of the studied population was 59.3% for males and 80.2 % for females with mean value of 70.9% for both. There was a fall in the percentage of accuracy on applying the cross validation method to the results of multivariate analysis to be 58% for males and 77.7% for females, with overall average of 69% for both, that yield the most reliable classification percentages owing to the distribution cross-checks of subjects allocated to the groups to ensure their validity. Comparing the results of the present work with those published by Abdel-Karim et al. (2015), they declared that according to BLR, the probability of the case to be a male or a female could be detected with an overall accuracy of 90.0% (91.3% and 87.5% in males and females respectively). This difference in the value of accuracy rates may be due to their small sample size or different analytical statistics used. Several studies demonstrated variability of identification accuracy rates between different studied populations, as illustrated in Table 8.
The strength points for the present study include the following: (1) as declared by Ramamoorthy et al. (2016), the more the number of variables used to determine sex by discriminant function analysis, the more the percentage of correct sex classification; we investigate the ten most reliable sexually dimorphic parameters of FM and occipital condyles, (2) The relatively large sample size compared to the previously conducted studies, (3) Since it is clear that discriminatory functional and logistic regression analysis are known as objective techniques that select least number of traits and maximum discriminatory effectiveness (Ekizoglu et al., 2016), for estimation of sexual dimorphism from skull morphometric measurements, this study applied this technique to get a reliable outcome. Despite that Seifert et al. (2017) mentioned that CT scan has its own limitations as regards:(1) similarity of tissue density of ligaments and bones in the region, (2) sample orientation, (3) craniometric landmarks definition and (4) various techniques used for image processing, the present work showed a high degree of agreement when the inter observer reliability was examined.
Conclusion
The present work demonstrated that the following cranial dimensions show significant sexual dimorphism in the studied adult Egyptian population: maximum internal length and width of the foramen magnum (FML, FMW), FM index, FM area, maximum length of the right and left occipital condyles (LROC, LLOC), maximum width of the right occipital condyle (WROC), maximum bicondylar distance (MBD) and minimum intercondylar distance (MnICD). Logistic regression function analysis of independent predictors showed that LROC and FMW are highly significant discriminating variables to predict sex. These findings would be interrogated as reliable indicators in sex determination of unknown skulls. Data should be only used as a corroborative finding in predicting sex in case of fragmented cranial bases and not recommended as sole indicators for sexing complete skulls. More research on wider scale of adult population is warranted to validate such specific discriminatory functions, estimate their classification accuracy and to update them periodically so as to avoid human secular trends among populations.
Availability of data and materials
All authors declare that the data and material published in the manuscript are available at the data registry of the radiology department, Faculty of Medicine, Mansoura University.
Abbreviations
- AUC:
-
Area under the curve
- BLR:
-
Binary logistic regression
- CT:
-
Computed Tomography
- FM:
-
Foramen magnum
- FMA:
-
Foramen magnum area
- FMI:
-
Foramen magnum index
- FML:
-
Foramen magnum length
- FMW:
-
Foramen magnum width
- LOCL:
-
Left occipital condylar length
- LOCW:
-
Left occipital condylar width
- MBD:
-
Maximum intercondylar distance
- MnICD:
-
Minimum intercondylar distance
- ROCL:
-
Right occipital condylar length
- ROCW:
-
Right occipital condylar width
References
Abdel-Karim RI, Housseini AM, Hashish RK (2015) Adult sex estimation using three dimensional volume rendering multislice computed tomography of the foramen magnum and occipital condyles: a study in Egyptian population. Int J Adv Res 3:1212–1215
Akay G, Güngör K, Peker İ (2017) Morphometric analysis of the foramen magnum using cone beam computed tomography. Turk J Med Sci. 47:1715–1722. https://doi.org/10.3906/sag-1607-127
Chovalopoulou M-E and Bertsatos A. (2017) Estimating Sex of Modern Greeks Based on the Foramen Magnum Region. Journal of Anthropology, Article ID 9129801, 7 pages. https://doi.org/10.1155/2017/9129801
Edwards K, Viner MD, Schweitzer W, Thali MJ (2013) Sex determination from the foramen magnum. J Forensic Radiol Imaging:186–192
Ekizoglu O, Hocaoglu E, Inci E, Can IO, Solmaz D, Aksoy S, Buran CF, Sayin I (2016) Assessment of sex in a modern Turkish population using cranial anthropometric parameters. Legal Medicine 21:45–52
El-Barrany UM, Ghaleb SS, Ibrahim SF, Nouri M, Mohammed AH (2016) Sex Prediction using Foramen Magnum and Occipital Condyles Computed Tomography Measurements in Sudanese Population. Arab J Forensic Sci Forens Med 1(4). https://doi.org/10.12816/0033135
Gobbur AR, Rai SPV, Nagesh KR, Kharoshah MA, Madadin M, Luis NA, Baral P, Arathisenthil SV, Choudhary N (2013) Morphometric evaluation of the foramen magnum: A study on computerized tomographic images of South Indian adults. Int J A J Ins Med Sci 2:65–72
González-Colmenares G, Sanabria-Medina C, Rojas-Sánchez MP, Leóna K, Malpud A. (2019) Sex estimation from skull base radiographs in a contemporary Colombian population. J Forensic Legal Med. 62:77–81. https://doi.org/10.1016/j.jflm.2019.01.006
Kamath VG, Asif M, Shetty R, Avadhani R (2015) Binary Logistic Regression Analysis of Foramen Magnum Dimensions for Sex Determination. Anatomy Res Int:1–9. https://doi.org/10.1155/2015/459428
Kanchan T, Gupta A, Krishan K (2013) Craniometric analysis of foramen magnum for estimation of sex. Int Sch Sci Res Innov. 7:252–254
Madadin M, Menezes RG, Al Saif HS, Abu Alola H, Al Muhanna A, Gullenpet AH, Nagesh KR, Kharoshah MA, Al Dhafery B (2017) Morphometric evaluation of the foramen magnum for sex determination: A study from Saudi Arabia. J Forensic Legal Med 46:66–71
Murshed KA, Üekcübaþi AE, Tuncer I (2003) Morphometric Evaluation of the Foramen Magnum a variations in its Shape: A Study on Computerized Tomographic Images of Normal Adults. Turk J Med Sci. 33:301–306
Omer, A.M.S.; Caroline, E.; Eyad, K. 2015. Characterization of Foramen Magnum and Occipital Condyles in Adult Sudanese by using Computed Tomography. PhD Thesis Sudan University of Science and Technology, Khartoum, Sudan, 2015.
RaghavendraBabu YP, Kanchan T, Attiku Y, Dixit PN, Kotian MS (2012) Sex estimation from foramen magnum dimensions in an Indian population. Journal of Forensic and Legal Medicine 19:162–167
Ramamoorthy B, Pai MM, Prabhu LV, Muralimanju BV, Rai R (2016) Assessment of craniometric traits in South Indian dry skulls for sex determination. J Forensic Legal Med 37:8–14
Routal RR, Pal GP, Bhagawat SS, Tamankar BP (1984) Metrical studies with sexual dimorphism in foramen magnum of human crania. J Anatomical Soc India. 33:85–89
Seifert Z, Fried L, Chaumoitre K, Bružekd J (2017) Applicability and limitations of sex assessment based on foramen Magnum. Forensic Sci Int 271 126.e1–126.e9
Tambawala SS, Karjodkar FR, Sansare K, Prakash N, Dora AC (2016) Sexual dimorphism of foramen magnum using Cone Beam Computed Tomography. J Forensic Legal Med (44):29e–34e
Tellioglu AM, Durum Y, Gok M, Karakas S, Polat AG, Karaman CZ (2018) Suitability of foramen magnum measurements in sex determination and their clinical significance. Folia Morphol. https://doi.org/10.5603/FM.a2017.0070
Toneva D, Nikolovaa S, Harizanov S, Georgiev I, Zlatareva D, Hadjidekov V, Dandov A, Lazarove N (2018) Sex estimation by size and shape of foramen magnum based on CT imaging. Legal Med 35:50–60
Uthman AT, Al-Rawi NH, Al-Timimi JF (2012) Evaluation of foramen magnum in gender determination using helical CT scanning. Dentomaxillofac Radiol 41(3):197–202
Uysal S, Gokharman D, Kacar M, Tuncbilek I, Kosa U (2005) Estimation of sex by 3D CT measurements of the foramen magnum. J Forensic Sci 50:1310–1314
Vidisha G, Ravi Prakash SM, Sangeeta M, Nagaraju K, Sumit G, Swati G (2019) Sexual Dimorphism of Foramen Magnum between Two Different Groups of Indian Population: A Cross-Sectional Cone-Beam Computed Tomography Study. J Forensic Sci Med (4):150–155
Zheng J, Ni S, Wang Y, Zhang B, Teng Y, Jiang S (2018) Sex determination of Han adults in Northeast China using cone beam computer tomography. Forensic Sci Int 289:450.e1–450.e7
Acknowledgments
Authors would like to thank Dr. Haytham Abdel Aziz shebl, for his scientific contribution. As well as, many thanks for Mr. Mohamed Ali Baraka and Ms. Hend Hamed Abdel-Rahman for their cooperation and assistance throughout the practical parts of the study.
Funding
All authors disclose that there is no role for funding and no financial influence that could affect the outcome of this work.
Author information
Authors and Affiliations
Contributions
1. Dr HMHA contributed in conceptualization; Data collection and analysis; Methodology construction; Supervision; Writing the original draft. 2. Dr RHA contributes in conceptualization; Data revision and analysis; Methodology construction, Writing - review & editing of the original draft and submission of the final manuscript for publication. 3. Dr GE contributed in Data analysis; Investigation; Methodology suggestion; Resources and Software; Visualization and interpretation of data. 4. Dr HMA contributed in Data analysis; Visualization and review of the results and interpretation of data. All authors have reviewed the final draft of the manuscript before submission. All authors read and approved the final manuscript.
Corresponding author
Ethics declarations
Ethics approval and consent to participate
The work has been approved by the Institutional Review Board (R/18.03.107). It comprised the analysis of cranial CT images recruited from patients records at the database registery in the Radiology department, Faculty of Medicine, Mansoura University. All participants have given informed consent to do radiological examination for different diagnostic reasons.
Consent for publication
All authors declare that the manuscript has been read and approved by all the named authors and that there are no other persons who satisfied the criteria for authorship to be listed. We further confirm that the order of authors listed in the manuscript has been approved by all of us.
We understand that the Corresponding Author: Professor Dr/Rania Hamed Abdel-Rahman is the sole contact for the Editorial process (including Editorial Manager and direct communications with the office). She is responsible for the publication process and communication with other authors about progress, submissions of revisions and final approval of proofs.
Competing interests
All authors disclose that there are no known conflicts of interest associated with this publication or any kind of relationships with other people or organisations that could inappropriately bias this work.
Additional information
Publisher’s Note
Springer Nature remains neutral with regard to jurisdictional claims in published maps and institutional affiliations.
Rights and permissions
Open Access This article is distributed under the terms of the Creative Commons Attribution 4.0 International License (http://creativecommons.org/licenses/by/4.0/), which permits unrestricted use, distribution, and reproduction in any medium, provided you give appropriate credit to the original author(s) and the source, provide a link to the Creative Commons license, and indicate if changes were made.
About this article

Cite this article
Abo El-Atta, H.M., Abdel-Rahman, R.H., El-Hawary, G. et al. Sexual dimorphism of foramen magnum: An Egyptian study. Egypt J Forensic Sci 10, 1 (2020). https://doi.org/10.1186/s41935-019-0167-x
Received:
Accepted:
Published:
DOI: https://doi.org/10.1186/s41935-019-0167-x