
Abstract
Background
Large rivers are ecological treasures with high human value, but most have experienced decades of degradation from industrial and municipal sewage, row-crop agricultural practices, and hydrologic alteration. We reviewed published analyses of long-term fish diversity publications from three intensively managed large river ecosystems to demonstrate the conservation potential of large river ecosystems.
Results
We show how the incorporation of recent advances in river concepts will allow a better understanding of river ecosystem functioning and conservation. Lastly, we focus on the Wabash River ecosystem based on high conservation value and provide a list of actions to maintain and support the ecosystem. In the Wabash River, there were originally 66 species of freshwater mussels, but now only 30 species with reproducing populations remain. Although there were multiple stressors over the last century, the largest change in Wabash River fish biodiversity was associated with rapid increases in municipal nutrient loading and invasive bigheaded carps.
Conclusions
Like similarly neglected large river systems worldwide, the Wabash River has a surprising amount of ecological resilience and recovery. For instance, of the 151 native fish species found in the 1800s, only three species have experienced local extinctions, making the modern assemblage more intact than many comparable rivers in the Mississippi River basin. However, not all the changes are positive or support the idea of recovery. Primary production underpins the productivity of these ecosystems, and the Wabash River phytoplankton assemblages shifted from high-quality green algae in the 1970s to lower less nutritional blue-green algae as nutrient and invasive species have recently increased. Our recommendations for the Wabash River and other altered rivers include the restoration of natural hydrology for the mainstem and tributaries, nutrient reductions, mechanisms to restore historical hydrologic patterns, additional sediment controls, and improved local hydraulics.
Background
Large river ecosystems have under-appreciated socio-economic importance because they are key sources of water for agriculture and society, are transportation highways for large volumes of goods, and provide a myriad of ecosystem services including flood protection to millions of people worldwide (Thorp et al. 2010; Ward et al. 1999; Sparks 1995). However, to monitor, manage, and conserve these services and functions can be both expensive and conceptually difficult because of their size and complexity (Erős et al. 2019). High species richness and productivity of large rivers result from their geologic history, size, and connectivity of their complex lateral and longitudinal habitat mosaic (Sparks 1995; Ward et al. 1999). This is especially true of large rivers with north-south orientations like the Wabash River in the US Midwest that retained biodiversity by acting as refugia during periods of glaciations (Jacquemin and Pyron 2011). Large rivers are also important for maintaining productivity through their role as corridors for movement: migratory fishes like the iconic sturgeon utilize them to connect critical but disjunct reproductive, nursery, and feeding resources (Pracheil et al. 2013). Large rivers also support high productivity through regular annual spring flood pulses that provide access to critical nutrient sources, limited habitat, sediment sinks, and attenuation of excess flood water (Thorp et al. 2010; Bayley 1995). Large river ecosystems have additional simultaneous but seldom quantified values including nutrient and carbon sequestration and flood risk reduction. Yet, restoration of large river ecosystems is uncommon (Jacobson and Galat 2006). The same spatial and temporal complexity that are key to large river ecological and economic functions are major challenges to incorporate into policy, management, and engineering (Erős et al. 2019). Despite this portfolio of benefits, efforts to inform stakeholders and stimulate funding for large river conservation and restoration have been limited (Palmer et al. 2005; Lamouroux et al. 2015). When these efforts are successful, the focus tends to be on a narrow set of economic benefits rather than ecological values and outcomes (Jacobson and Galat 2006; Palmer et al. 2005) and often occurs at the local, site-specific spatial scale (Gore and Shields Jr. 1995). We review research on three adjacent large river watersheds with similar issues. Our final focus is to bring attention to the recovery potential for rehabilitation of the Wabash River as an example to stimulate additional interest in the study and restoration of large rivers worldwide.
Prior to their development large rivers contained high biodiversity and productivity as well as other valuable non-commercial services including recreation, drinking water supply, and flood risk reduction (Johnson et al. 1995). Following the rapid expansion of industrial agriculture in the 1950s, a more limited set of non-ecological services including irrigation, sewage disposal, power generation, and navigation predominated in many highly modified floodplain rivers like those of the US Midwest. The typical ecological response pattern to this degradation is a corresponding decline in biodiversity, including in some cases reduced ecological functions such as productivity (DeBoer et al. 2019). This is a worldwide-wide phenomenon: construction of dams for water development began in the US in the nineteenth century resulting in more than 79,000 dams that altered hydrologic regimes, natural interactions and functions, and associated biota (Magilligan and Nislow 2005; Nilsson et al. 2005). Dams and inland navigation led to a cascade of developmental pressures, and over the first half of the twentieth century in midwestern large rivers; this included steadily increasing industrial and municipal point source pollution that degraded the diversity and function of most aquatic ecosystems. This progression continued into the twenty-first century until the cumulative impact finally affected human health and livelihood at a national scale after which society required change (Carson and Mitchell 1993). The subsequent ecological recovery due to federal policies including the U.S. Clean Water Act of 1972, which focused mainly on point source pollutants, was a demonstration of the ability of many freshwater ecosystems in general and large river ecosystems to recover following reductions in point source pollution (Pyron et al. 2006, 2008, 2019; Gibson-Reinemer et al. 2017). However, non-point source pollution from agriculture and urbanization as well as other non-chemical degradation like stream dewatering, and floodplain/wetland modifications remain significant impediments to greater ecological recovery (Cosens and Stow 2014). The remaining challenge for the conservation of large river systems is to clearly demonstrate their potential for continued recovery while developing a toolbox of effective actions and policies for achieving that conservation potential (Palmer et al. 2005).
A large river conservation toolbox requires establishing a timeline and expectations for the potential status the ecosystem could achieve. Many US rivers suffered from similar problems as most of the tributaries of the Mississippi River basin: well-documented progression of human activities from shifts in land-use and agricultural practices, point and non-point source nutrient loads, hydrologic alterations from dam and reservoir construction, and the establishment of invasive species (Pyron et al. 2019; DeBoer et al. 2019). Ultimately, for the evaluation of the links between stressors and expectations for potential policy and conservation responses—a timeline can be a first tool. In addition to a documented history of ecological response, the Wabash River also has attributes that improve the likelihood of successful restoration and conservation efforts, especially recovery from many anthropogenic pressures that long-term monitoring has demonstrated. Our objectives are to (1) describe the history and ecology of the Wabash River fish ecosystem, (2) compare ecological trends in two midwestern US rivers using published sources, and (3) suggest potential steps for protecting and conserving the Wabash River that could be applied to other large river ecosystems.
The Wabash River: history
The Wabash River is the largest tributary of the Ohio River with a length of 764 km, a watershed area of 85,340 km2 and mean annual discharge of 1000 m3/s (Benke and Cushing 2005, Fig. 1). Although there are numerous reservoirs on its tributaries and one mainstem reservoir at river 662 km, the lower two-thirds is still the longest undammed reach east of the Mississippi River. The Wabash River watershed was historically dominated by beech-maple forest, prairies, and wetlands (Küchler 1966) that were converted prior to and during the twentieth century to allow row-crop agriculture. European immigrants also expanded large-scale agriculture whereby they also altered runoff patterns by installing tile drains that connect to channelized ditches and streams. Together, this resulted in an estimated 62% of the watershed being converted into intensive row-crop agriculture, despite the basins poorly drained soils with high clay content (US Army Corps of Engineers 2011). Although agriculture dominates the Wabash River landscape, industrial development was also extremely successful in the state of Indiana during the twentieth century, with many wastes piped directly into tributary streams. Further impacts on the ecosystem include dam construction throughout the watershed during the 1960s and 1970s, subsequently creating barriers to aquatic animal movements, altering river hydrology, connectivity, and changing sediment erosion, transport, and deposition patterns. The earliest records of the biodiversity and ecology of the fishes of Wabash River are from the more pristine period prior to significant development (Jordan 1890). However, even before 1900, the Wabash River became noticeably more turbid likely due to the elevated sediments and nutrients generated by the rapid expansion of agriculture in the watershed (Jordan 1890). Currently, the river downstream from the single reservoir is turbid, but the water color is brown or yellow-green from a mixture of sediments and diatoms. Thus, during the twentieth century, the setting of the Wabash River shifted from a less impacted frontier basin to experiencing most of the ills associated with large rivers around the world.
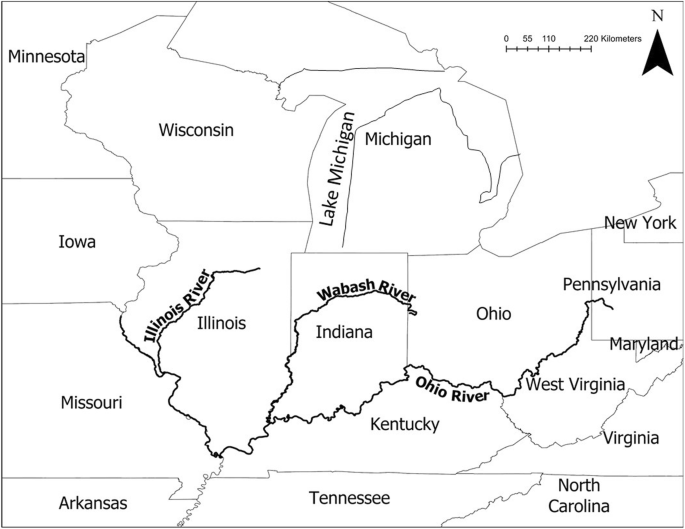
Illinois River, Ohio River, and Wabash River map
Hydrologic alterations to the Wabash River
One of the largest yet least understood changes in large rivers during the rapid expansion of Europeans in North America was the radical alteration of river hydrology for navigation and water supply (Graf 1999). Hydrologic alterations occur with dams, dyke fields, and underground tile drains that rapidly transport water off fields and into stream channels. These engineering approaches to water management modified many aspects of annual hydrographs, and especially the magnitude, duration, and frequency of high and low water events (Poff et al. 1997). Fish and mussel life histories are finely tuned to hydrology attributes. Although ecological responses to altered hydrology are chronic and cumulative and profoundly negative, they are not as obvious as acute exposure to high profile agricultural and industrial chemicals (Poff et al. 1997). Further, the natures of these impacts are idiosyncratic and can vary substantially with geography, geomorphology, land-use, and engineering practices for each specific river. In the Wabash River example, 80 USGS gaging stations measured altered hydrographs due to dam construction (Pyron and Neumann 2008). Resulting hydrographs in the Wabash River watershed tend to have statistically significant increased minimum flows, decreased maximum flows, increased fall rate, decreased summer monthly flows, and decreased high pulse counts, compared to historic flows (Fig. 2, Pyron and Neumann 2008). Watersheds with row-crop agriculture land-use resulted in an increased number of zero flow days, increased low pulse counts, and decreased high flows during Oct and Apr, compared to historic flows. Frequencies of large flood events for the Wabash River were historically rare (four events from 1928-1985), however are more common in recent decades (four events from 1985 to 2005) (Pyron et al. 2010). Rahman and Bowling (2018) further found that reservoir management in the Wabash River basin resulted in decreased annual maximum discharge and flashiness (rapid flow increases following rain events) and increased annual minimum discharge. Thus, in the Wabash River basin, early twentieth century development culminated in a more compressed hydrograph with, paradoxically, more variable and extreme conditions in low flow months.

3-day minimum flow by year calculated by Indicators of Hydrologic Alteration software (Richter et al. 1996) for the Montezuma USGS gaging station on the Wabash River (top), fall rate by year for the Valley City USGS gaging station on the Illinois River (middle), and fall rate by year for the Louisville USGS gaging station on the Ohio River (bottom)
Wabash river water quality and the clean water act
During the late twentieth and early twenty-first centuries, there was a steady reversal in some of the anthropogenic stresses, especially the discharge of point-source pollutants to the river. Prior to the Clean Water Act of 1972, summer fish kills were frequent, occurring when dissolved oxygen concentrations were low, the water temperature was high, and river discharge was low (Gammon 1998). Those summer kill conditions were ultimately driven by the increases in the amount of largely untreated municipal sewage at the same time as wetlands were being converted to row-crop agriculture in the early to the late twentieth century. The combination of the Clean Water Act point-source controls through the National Pollution Discharge Elimination System along with the adoption of agricultural best management practices including no-tillage, filter strips, and winter cover crops that help reduce non-point source pollution led to water quality improvements, yet some problems remained. In particular, mineral phosphorus inputs and suspended sediment loads that result from agricultural practices have become a water quality issue (Muenich et al. 2016). Similar patterns of changing nutrient speciation were observed in other agricultural midwestern rivers and around the world (Powers et al. 2016). The result has become, instead of fish kills, eutrophication and potential for reduced fish productivity with both increased phytoplankton abundance and a simultaneous rising dominance of lower quality pelagic blue-green, diatom, and euglenoid algae (Minder and Pyron 2017). Thus, the benefits of fewer summer fish kills were offset by a shift in the food base that led to a change from the historically warm water fish assemblage that favors recreational and commercial species like catfish and buffalo, to a modern assemblage dominated by planktivores including the rising threat of invasive bigheaded carps. Thus, instead of the conservation potential leading to a state resembling the clear-water conditions of the pre-development nineteenth century, we are faced with an ecosystem that appears to have shifted to a new and alternate high-productivity but a turbid state.
Changes in Wabash River biodiversity: fishes, mussels, and David Starr Jordan
Early assessment of the biodiversity was begun in the late nineteenth century by the pioneering ichthyologist in North America, David Starr Jordan in 1878. Despite the initial impacts of altered hydrology and increased pollution, Jordan found the Wabash River still contained high biodiversity with 151 native fish species, including key regional species like sturgeon, Blue Catfish, and Redhorse suckers (Gammon 1998; Simon 2006). The hardiness of these species is evidenced by the relatively few local extinctions with the exception of Alligator Gar (Atraclosteus spatula), Popeye Shiner (Notropis ariommus), and Crystal Darter (Crystallaria asprella). At the height of the degradation in the 1970s through the 1980s fish assemblages were strongly impacted and dominated by less desirable Gizzard Shad (Dorosoma cepedianum). The recent fish assemblage (1990-present) is characterized by resurgent populations of native river specialists like River Carpsucker (Carpiodes carpio) and Freshwater Drum (Aplodinotus grunniens) alongside declining invaders like Common Carp (Cyprinus carpio, Fig. 3). Recent surveys showed increased species richness and relative abundances of sensitive species such as Blue Sucker (Cycleptus elongatus), Redhorse suckers, and Shovelnose sturgeon (Scaphirhyncus platorhyncus) that were recorded by David Starr Jordan (Pyron et al. 2006).

Relative abundance CPUE of four common fish species by collection year in the Wabash River. Data from Pyron et al. (2017)
The twentieth century, especially the 1960s through 1980s, was a nadir for both environmental conditions and biodiversity in the Wabash River. Effluent from multiple industries, sewage treatment plants along the Wabash River, and row-crop agriculture throughout the watershed contributed to pollution and increased nutrients. Evidence of the impact of these problems was easily observed with frequent large fish kill events when river discharge was low and the air temperature was high (Gammon 1998). This was the period when DePauw University faculty member James Gammon followed in the footsteps of David Starr Jordan with annual fish collections in the Wabash River (Gammon 1998). His collections and observations are summarized in his textbook, The Wabash River Ecosystem (Gammon 1998). The book includes a history of the Wabash River, descriptions of the dominant fish species, and general patterns of the fish assemblages during this time period following the Clean Water Act. Gammon’s goal was to use the fish community to assess water quality and identify problem discharge locations. Gammon’s efforts were at the forefront of utilizing the results of natural history surveys to effectively communicate the links to pollution to agencies and society at large. Gammon (1998) included an innovative fish-based tool, the Index of Well-Being (IWB) that incorporated fish biomass, abundance, and diversity to gauge the level of impairment, which proceeded with other indices developed in the region like the influential Index of Biotic Integrity. The IWB data collected during his 1970 to 1998 career and again beginning in 2001 by a new team from Ball State University demonstrated continually improving fish assemblages (Pyron and Lauer 2004). Standardization in collection and data analysis included collections at sites where Gammon made his collections, and boat electrofishing at 500-m distances in a downstream direction. Combining these early and recent collections was key to building the long-term trends we present to establish the status and conservation potential of the Wabash River ecosystem (Broadway et al. 2015; Pyron et al. 2017).
Freshwater mussels represent taxon another which, unfortunately, has not recovered. Mussel species richness decreased from a high of 66 species in the twentieth century to only 30 species with reproducing populations (Fisher 2006). Likely causes of mussel losses include overharvesting by commercial shelling (Cummings et al. 1992), direct exposure to sewage and wastewater, local extinctions of their fish hosts (Unioinidae mussels require a fish or other host for larvae.), and indirect effects of altered hydrology that degraded adult habitat including sedimentation, hypoxia, or lethal summer water temperatures (Box and Mossa 1999; Fisher 2006). The twenty-first century has brought improving environmental conditions, increases in host species abundances, and greater interest in population enhancement and reintroductions (Indiana Department of Wildlife Resources 2017 Wildlife Science Report, indianawildlife.org). However, despite losses of more than 50% of the species and on-going anthropogenic threats from agriculture and development, the mussel assemblage of the Wabash River is still among the most intact large river mussel assemblages remaining in the midwestern region (Page et al. 1997).
Ecological stressors to aquatic ecosystems are evolving but tend to be chronic stresses whose impacts are felt decades after the stress was initiated. We suggest that to create conservation strategies for chronic problems like anthropogenic, demographic, or climate changes, we need to be able to test a range of hypothesized solutions. Long-term ecological research like the work carried out on the Wabash River since David Starr Jordan’s time produces relevant data for long-term hypothesis testing (Dodds et al. 2012; Strayer et al. 2014). Pyron et al. (2008) identified a temporal decrease in a multimetric score (Index of Biotic Integrity, IBI) from 1974 to 1998, and IBI scores increased with an upstream river location. For instance, long-term data resulted in the detection of a regime shift from planktivore-detritivores that dominated between 1960 and 1980, to benthic invertivores, that was attributed to reductions in pollution with the Clean Water Act (Broadway et al. 2015; Pyron et al. 2017; Fig. 3). More recent (1990–present) modifications to the fish assemblages included further reductions in gizzard shad, caused perhaps by nutrient loading modifications (Muenich et al. 2016) and/or increased abundances of invasive Silver Carp (Hypopthalmichthys molitrix, Pyron et al. 2017). However, Silver Carp abundances in the Wabash River did not approach extreme densities as in the Illinois River (McClelland et al. 2012). Evidence that nutrients impacted the ecosystem includes changes in the phytoplankton assemblages that were dominated by high-quality green algae in the 1970s and recently are dominated by diatoms and lower nutrition-quality blue-green algae (Minder and Pyron 2017). However, a lack of continuous long-term nutrient monitoring data to examine with fish assemblage data prevents further conclusion. Despite the decades of ecological stress, the fish assemblage of the Wabash River contains multiple sensitive species that increased in abundance during the past several decades (Pyron et al. 2006). Examples of sensitive but recovering fish include the following:
Shovelnose Sturgeon (Scaphirhynchus platorynchus) have a strong Wabash River population (Fig. 4) that supports a commercial caviar harvest (Kennedy et al. 2007). Although Thornton et al. (2018) found the shovelnose sturgeon population was healthy, condition, weight of roe-per-fish, and size-at-maturity were decreasing from 2009 to 2016. Shovelnose sturgeon life history characteristics of high age of maturity and infrequent reproduction result in susceptibility to over-harvest (Thornton et al. 2018).

CPUE for sensitive fishes by collection year in the Wabash River. Data from Pyron et al. (2017)
Blue Sucker (Cycleptus elongatus) is a large-river specialist with decreased abundance during recent decades throughout its range in the Mississippi River basin (Bacula et al. 2009). Abundances in the Wabash River were low during the 1970s and increased recently likely following water quality improvements (Gammon 1998). We found increased abundance as catch per unit effort (CPUE) of blue sucker from 1974 to 2017 (Fig. 4).
Redhorse suckers (Moxostoma spp.) are an emblematic large river species (Simon 2006) that were in low abundances in the Wabash by the 1970s (Fig. 4). Subsequently, several Moxostoma increased in abundance, likely following water quality improvements (Gammon 1998). Trautman (1981) stated that redhorse suckers are intolerant to pollution and siltation, which are products of industrial point source pollution and agriculture in the Wabash River watershed. Catch per unit effort of Shorthead Redhorse (Moxostoma macrolepidotum) did not change significantly from 1974 to 2017 in the Wabash River (Fig. 4).
Smallmouth Buffalo (Ictiobus bubalus) and Freshwater Drum (Aplodinotus grunniens) increased in abundance (Fig. 4) during this same time period.
Although many large-river-adapted species have improved abundances, additional conservation problems remain for the Wabash River. Sauger (Sander canadensis), Bowfin (Amia calva), and American Eel (Anguilla rostrata) which all have large river linked life histories, declined between 1974 and 2017, but are also still present in the system (MP unpubl. data). Taken together, the presence of robust populations of these sensitive fish species suggests that the ingredients of a healthy large river assemblage are still present. This is a primary reason that restoration and conservation efforts in the Wabash River have a high likelihood of success.
Ohio River: hydrologic alterations, fish, and mussel assemblages
The Ohio River has a larger watershed than either the Wabash or Illinois rivers (Fig. 1). Unlike the watersheds of the Wabash and Illinois rivers, agricultural land use in the Ohio River watershed has decreased while forest cover has increased since the 1960s (Tayyebi et al. 2014; Pyron et al. 2019). Land-use in the Ohio River watershed was dominated by row-crop agriculture in the 1930s, but conservation reserve programs from 1970 to the present resulted in shifts from agriculture to the forest (Tayyebi et al. 2014). Percent urban use more than doubled during the same time period (Tayyebi et al. 2014). Although increased forest cover in the watershed likely contributes to improvements in water quality, geochemical signatures from past land-uses remain (Harding et al. 1998). Like many rivers of the developed basins of the US Midwest, historic hydrology patterns in the Ohio River watershed were significantly altered by a system of 20 low-head navigation dams (Thomas et al. 2005). Hydrological alterations included 10 variables encompassing ecologically important attributes of discharge magnitude, duration, high- and low-pulse frequencies, fall rate, and rise rate (Fig. 2, Pyron et al. 2019).
As across North America, invasive species such as Common Carp and Bigheaded carps and zebra mussels are a significant problem in the Ohio River (Angradi et al. 2011). Zebra mussels are in the Wabash River and are a potential threat to native mussels (Schneider et al. 1998) but are currently at low abundances (MP pers. obs.). However, despite their influence, Thomas et al. (2005) identified improvements in fish assemblage metrics over the last 50 years, especially noticeable since the implementation of the 1972 Clean Water Act. Like the post-CWA era in the Illinois and Wabash rivers, there were increases in fish abundance, a tripling of species richness, and increased trophic diversity of the fish fauna with time in the Ohio River, with the trend accelerating with each year (Pyron et al. 2019). Pyron et al. (2019) further hypothesized that the shift in the early 1900s from benthic to pelagic fish dominance observed throughout the Ohio River coincided with declines in water clarity and quality as urban, agricultural, and industrial inputs became significant. The accompanying declines in diversity and secondary production of benthic invertebrates then cascaded up to declines in the invertivore and piscivore fishes observed by Bowes (2016).
The Ohio River historically supported high species richness of freshwater mussels and with species richness of individual pools up to 63 (Watters and Flaute 2010). Mussel diversity decreased the past century with high variation in losses among Ohio River pools. Watters and Flaute (2010) identified the causes of mussel extirpations as water quality, existing dams, and invasive zebra mussels.
Illinois River: a history of pollution and hydrologic alterations
The Illinois River whose basin is immediate to the west of the Wabash River has many similarities to its neighbor such as the domination of their watersheds by row-crop agriculture, a history of untreated industrial and municipal sewage pollution, and dramatic alteration from pre-European hydrologic baselines. However, there are also important differences that may explain the divergence in the conservation history of the two rivers—sewage originated from a much larger urban-industrial center (Chicago) in the headwaters of the Illinois River (Delong 2005). Prior to the twentieth century, hypoxia and acute toxicity were common more than 100-km downstream. The subsequent construction of the Chicago Sanitary and Ship Canal diluted the polluted river with water diverted from Lake Michigan while also expanding commercial navigation. While this successfully lowered lethal hypoxia events and pollutant concentrations, this effort ultimately swung the pendulum in the other direction when the oligotrophic lake water began to account for between 10 and 25% of the discharge in the upper third of the river after the canal opened (Delong 2005). Additionally, commercial navigation expanded dramatically on the Illinois River: the original low-head wicket dams that were constructed in the late 1800s were upgraded in the 1930s to create a deeper navigation channel year-round (Gibson-Reinemer et al. 2017). This meant greater minimum flows, fewer high flow pulses, a less well-defined flood season, and a highly variable rate of rise/fall during any flood event than the pre-1930s river hydrograph (Lian et al. 2012). Analysis of historical discharge records showed that since the 1930s, there are at least 11 key hydrologic variables that are still significantly altered (Table 1) including fall rate (Fig. 2). There were dramatic rises in the suspended sediment load and subsequent sedimentation rates, especially in the once diverse and productive floodplain backwaters (Bhowmik and Demissie 1989). These combined factors significantly limit native fish diversity recovery from point-source pollution-related stresses.
Fish assemblages of the Illinois River
The fish assemblage in the upper Illinois River reached its environmental low point in the 1950s with low abundances of generalist species (common carp and goldfish, Carassius auratus). However, following the implementation of the Clean Water Act, there was a doubling in native species richness, increase abundances of commercially harvested species by more than 25%, while the relative abundance of the pollution-tolerant common carp fell to a mere 2% of the community (Gibson-Reinemer et al. 2017). The recovery of the Illinois River in the decade after the CWA is celebrated as a victory for conservation and restoration. In addition to demonstrating the power of national policy to have profound local benefits, this also demonstrated that even the most stressed ecosystems may be capable of recovery. However, by the twenty-first century, a new type of pollution emerged—zebra and quagga mussels. These invaders expanded downstream into the Illinois River from the Great Lakes in the 1980s and, arguably a bigger threat, the bigheaded carps moved upriver from the lower Mississippi River in the 1990s (Stoeckel et al. 1997; Sass et al. 2010). There is a sad irony that the decades of improvements in water quality from the CWA that helped recover native species may now also benefit these recent invasive species.
Similarities and differences among large midwestern US rivers
Similarities in the influences shaping fish assemblages of the Wabash, Illinois, and Ohio rivers include a large proportion of the watershed in row-crop agriculture, concentrated urbanization, and alteration of hydrology from damming (Table 2). However, despite the similarities among the drivers, the response patterns and trends in fish assemblages do not mirror each other. These rivers had varied responses to the staggered arrival of invasive bigheaded carps. Fish assemblages in the upper third of the Illinois River closest to the headwaters had not recovered as much as the lower river before the bigheaded carp invasion (Gibson-Reinemer et al. 2017). In contrast, the fish assemblages of the Wabash River recovered from the pre-1970s pollution due to the CWA prior to invasive bigheaded carp establishment (Pyron et al. 2019). However, in the Wabash River, invasive bigheaded carps never successfully established, with no measurable impact during the same period bigheaded carps negatively influenced the Illinois River fish assemblage (Broadway et al. 2015; DeBoer et al. 2018).
Bigheaded carp populations are higher in abundance in the Illinois River ecosystem than in the Wabash River, while the body condition and abundance of the native competitors Gizzard Shad and Bigmouth Buffalo, and even Silver Carp simultaneously decreased (Solomon et al. 2016; Pendleton et al. 2017). In contrast, Wabash River Silver Carp abundance is lower and body condition is higher. Several authors attributed lower abundances of the bigheaded carp in the Wabash River to less altered hydrology which may suppress carp diet and reproduction, while fostering a more intact assemblage of native predators and competitors (Stuck et al. 2015; Coulter et al. 2018). Love et al. (2017) reinforced the idea that strong competitive interactions can constrain bigheaded carp by showing a rapid rebound in Gizzard Shad body condition in Illinois River after the targeted harvest of Silver Carp began. In the Wabash River, the gizzard shad population crashed between 1974 and 2008, prior to the arrival of the bigheaded carps, meaning that despite the lower plankton productivity of the Wabash, there was still less competition during their establishment (Pyron et al. 2017). Thus, although invasive bigheaded carp are present in both the Illinois River and the Wabash River, the difference in invasion trajectory suggests that the ecological constraints of the invader are very different.
The Ohio River watershed apparently benefitted from the twentieth century increases in forest cover, likely contributing to the recovery of the fish assemblages in conjunction with the Clean Water Act (Pyron et al. 2019) especially since no measurable impact of bigheaded carps was yet detected in this large river. The CWA also benefitted the Wabash River fish assemblages as shown by a similar increase in species richness and recovery of sensitive taxa (Gammon 1998; Pyron et al. 2006). While the Wabash River did not entirely escape the added stresses of dams and navigation, the amount of infrastructure and traffic is substantially less than either the Illinois or Ohio river experiences. The only mainstem dam and reservoir on the Wabash River was designed for flood retention and control rather than promoting navigation. Its major impact is the combined reduction of discharge during spring high-flow periods and discharge variation in the stable, low-flow summer months, along with allowing a more rapid rate of fall and rise of flood pulses (Table 1, Fig. 2). Despite the similarity with the Illinois River, the Wabash River is still less severely impacted than the more variable and seasonally unstable flow regime of the Illinois River. While the biota of all three of these rivers benefitted from improving water quality, the altered hydrology of the Illinois and Ohio rivers have replaced poor water quality as major limiting factors. This is another attribute of the Wabash River situation that increases its potential conservation value. Thus, we can conclude that one of the attributes of the Wabash River that make it a good regional candidate for conservation is that it receives all the benefits of improving land-use practices and environmental legislation while, unlike the Illinois and Ohio rivers, it has not been as severely degraded by invasive species like the bigheaded carps.
Several large U.S. rivers resulted in significant temporal and spatial trends, all with multiple stressor effects including catchment disturbance, pollution, and water resource development (Counihan et al. 2018). Despite their widely divergent environments, socio-economic settings, and ecological responses, the main stressors for all the large rivers studied were consistently dams and land-use modifications. Counihan et al. (2018) noted that while improvements in water quality associated with the post-CWA (Clean Water Act) era affected all the systems, they varied in the initiation and the magnitude of improvement.
Placing large river conservation into a theoretical context
The theory has firmly established hydrology, geomorphology, and human development as key drivers of river structure and function (Poff et al. 1997; Thorp et al. 2010; Gibson-Reinemer et al. 2017). However, the lack of a flexible, adaptable framework for use in divergent systems has been one practical limitation to conservation in large rivers. Two recent advances in theory can provide an example solution: Riverscapes (Fausch et al. 2002) and Macrosystems (McCluney et al. 2014). The riverscape perspective integrates ecological processes and spatial complexity by increasing the spatial and temporal scale of research (Fausch et al. 2002). Fausch et al. (2002) recommended sampling designs that allow testing at multiple spatial scales and time intervals appropriate to the life history attributes of target fishes or other organisms. For example, long-term analyses of Wabash River fish assemblages that included variation in traits (Beugly and Pyron 2010) and body size variation (Broadway et al. 2015) provided new information about ecosystem effects. Fish assemblages of the Wabash River Beugly and Pyron 2010) and in addition to embracing the Riverscape scales, expanding to larger spatial and temporal scales, allows river ecology to incorporate a macrosystem view (McCluney et al. 2014). The macrosystem view of river ecosystems is of watershed-scale networks containing distinct patches that are connected and interacting. The River Ecosystem Synthesis model (Thorp et al. 2006) predicts that river geomorphology and hydrology result in unique reaches or functional process zones, which have unique ecosystem characteristics and can repeat with river distance. Thorp et al. (2010) further concluded that river ecosystem functioning is primarily caused by its hydrologic pattern (Poff et al. 1997), and understanding can come from linking hydrogeomorphology of a river with its biocomplexity and ecosystem services (Williams et al. 2013). Defining river ecosystems by hydrogeomorphological gradients is an advance over the river continuum concept, which includes only river distance attributes (Vannote et al. 1980). Defining distinctive geomorphologic reaches or functional process zones (FPZ) for the Wabash River can provide a start to diagnosing potential conservation issues and opportunities (Fig. 4). A quantitative method to define functional process zones using GIS data is currently available. For instance, Robbins and Pyron (in review) used a quantitative approach (Williams et al. 2013) to identify three distinct functional process zones (FPZ) for the Wabash River (Fig. 5); FPZ A has a narrow channel width and wide floodplain, FPZ B has a wide channel and wider floodplain, and FPZ C has a wide channel width and constrained, narrow floodplain. Robbins and Pyron (in review) then demonstrated that Wabash River fish assemblages varied by FPZ (Fig. 5). This approach is especially useful for large river assessment because it clearly demonstrates strong links between species composition and FPZ characteristics (DeBoer et al. 2019). The take-home message for conservation is that theoretical models can be tailored to the specific limitations or opportunities of a river (e.g., flow modifications in erosional zones below dams versus habitat enhancement in depositional areas of the lower river), thus increasing the success and efficiency of the effort and funds expended across the basin.

Three functional process zones for the Wabash River, defined by geomorphology. FPZ A has a narrow channel width and wide floodplain, FPZ B has wide channel and wider floodplain, and FPZ C has wide channel width and constrained, narrow floodplain (Robbins and Pyron in review)
Recommendations for moving from theory to practice in the Wabash River
James Gammon (1998) began a long-term record of fish abundances for the Wabash River in the 1970s. Continuation of this long-term effort requires permanent funding and supplemental data collection similar to other long-term monitoring programs. Examples of programs are the Long-Term Resource Monitoring program on the Upper Mississippi River (Gibson-Reinemer et al. 2017) and the Ohio River Valley Sanitation Commission (ORSANCO). To maximize the insights and benefits, a monitoring program should include the key drivers identified by theory, water quality, nutrient flux, hydrology, and sediment transport, and plankton monitoring. The roadmap to restoration and conservation of Wabash River biodiversity would be a case study for aquatic conservation in general and large river conservation in particular. Specific examples for inclusion in the effort would include:
-
1)
Experimental modification of the release regime from upstream flood-control reservoirs in to mimic the natural flow regime with concurrent monitoring of ecological and sediment responses (Konrad et al. 2011).
-
2)
Incentives for modification of cover crops in agricultural subwatersheds to reduce peak flow runoff and subsequent nutrient spikes (Babbar-Sebens et al. 2013) with monitoring of resulting changes in both sediment and nutrient exports, and primary producers.
-
3)
Partnerships and policies like the proposed National Fish Habitat Conservation Through Partnerships Act which engage the public and politicians to arrest on-going degradation and promote important habitat restoration (Crawford et al. 2016).
-
4)
Reframing of our perception of habitat in river basins—especially the recognition that the distribution of habitats are often determined by reach scale hydrogeomorphological attributes like functional process zones rather than simply by local site conditions.
-
5)
Develop detailed fluvial hydrogeomorphology studies of the mainstem Wabash River to identify high-quality habitat remnants or to guide rehabilitation. This might include the characterization of sediment distribution and flux, erosion, and sedimentation patterns, linked to local hydrology variation (Baranya et al. 2018).
-
6)
Map geomorphological variation and identify locations that are most appropriate for an action (e.g., cover crop incentives, instream habitat construction) and policy (e.g., conservation easements) where flood frequency is changing and increasing impacts are expected to human structures or land-use.
-
7)
Restore floodplains by allowing natural seasonal flooding.
-
8)
Build a watershed partnership with representation from resource users, agriculture interests, and management agencies whose goal is to identify and promote potential conservation, land-use modifications, policy, and mitigation that will protect or improve watersheds in all rivers (Garvey et al. 2010). An example of a watershed partnership for a large river is the Upper Mississippi River Conservation Committee (https://www.umrcc.org/umrcc-history).
Outcomes: the future of the Wabash River ecosystem
Several successful examples of conservation improvement in river-floodplain habitats exist. For example, The Nature Conservancy’s Emiquon Preserve adjacent to the Illinois River (Lemke et al. 2017). While the primary goal at Emiquon has always been to improve the river basins diversity and productivity by connecting a high-quality source habitat, the project embraces the presence of agricultural levees by the installation of gated structure that permits export of material and fishes to the river while preventing extreme flooding, excessive backwater sedimentation, and limiting invasive species in the floodplain. In addition, the local society benefits through increased recreational hunting and fishing, tourism, and the potential for flood risk reduction. Modifying this approach to the opportunities available in Wabash River could include a combination of reduced nitrogen and phosphorus fertilizer application rates that consider legacy soil nutrients, application methods that maintain nutrients in the soil, and improved application timing (such as considering the potential for rain near-future), creation of wetlands to enhance nutrient uptake, restoration of riparian zones, and modification of flood control management to allow natural flooding into wetlands and backwaters (Mitsch et al. 2001). Additional nutrient reduction approaches include best management practices that reduce the loss of sediments and nutrients and two-stage ditch constructions (Mahl et al. 2015) that are effective with targeted approaches. Reduced nutrient loading to the Wabash River is predicted to result in modifications of the ecosystem including the fish assemblages. Potential changes to fish assemblages with decreased primary productivity include reduced abilities for bigheaded carps to forage on phytoplankton, the ability for gizzard shad to switch from planktivory to detritivory, and modifications of food webs. Increased water clarity may result in increased benthic primary productivity and subsequent secondary benthic productivity and increased abundances of benthic invertivore fishes. Impacts on mussels are unknown with decreased phytoplankton in the water column. However, these modifications are costly and politically difficult to implement at sufficient levels. Local activism to educate politicians and citizens may provide impetus to invest resources in conservation.
The early twentieth century agricultural and industrial development of river basins often focused on optimizing one or two aspects of management (e.g., irrigation supply, rapid field drainage) while, for ease or economics, discounting other potential ecological or cultural uses. However, more recently, water and land management and planning as a discipline is moving towards recognition of the value of a portfolio of these resource uses in conservation to broaden the appeal and thus support of projects and goals (Horne et al. 2017). Flow experiments provided evidence that small inexpensive modification of hydrology to mimic natural flow regimes can improve ecosystems (Olden et al. 2014). Flood control dams are designed to capture water during high-flow situations and subsequently release it gradually. The resulting altered hydrology has loss of peak flows, elimination of small floods, and artificially elevated flows (Richter and Thomas 2007). Dam release modifications for environmental flows are relatively simple. Richter et al. (2003) used the Green River, Kentucky, as a case study. A reservoir was constructed in 1963 by the US Army Corps of Engineers for flood control and recreation. Dam releases were modified to allow steady low flows in the fall season and avoid large releases in short periods. A similar modification of the flow regime of the Wabash River might be initiated with designed ecological releases from the upstream flood control dams. If this is implemented as an experiment with before and after components, it could be a robust test of ecological flow effects (Olden et al. 2014).
Human impacts that contribute to hydrologic alterations include deforestation, channel-bed reconfiguration, floodplain development, drainage, agricultural intensification, and urbanization (Wheater and Evans 2009). All of these impacts are present and even expanding in the Wabash River watershed. In addition, activities that promote channelization and alterations designed to move water downstream more rapidly appear to be expanding (Nilsson et al. 2018). Nilsson et al. (2018) described lowland agricultural rivers that are similar to the Wabash River as rivers where extreme flooding has hazardous consequences to human populations. The flooding frequency of the lower Wabash River is less altered from historical flows (Pyron and Neumann 2008), likely because the river is mainly free-flowing. However, row-crop agriculture impacts caused altered flows that resulted in incised channels where the loss of permanent riparian vegetation and has led to an increase in bank slumping. Many of the tributaries are supplying a significant and increasing amount of sediments to both the local channel habitats as well as to downstream backwater and channel habitats (Odgaard 1987; Magner and Steffen 2000; Sekely et al. 2002) resulting in habitat simplification or loss of appropriate habitat for fishes and macroinvertebrates (Blann et al. 2009). In addition, precipitation is increasing in the Wabash River watershed (Pyron and Neumann 2008) and further climate change may contribute by increasing the magnitude while decreasing the predictability of discharge patterns and their nutrient and sediment loads in both the mainstem and tributaries (Knox 2000, 2006).
Restoring river hydrology to approach a “naturalized” flow regime is possible and includes restoration of channel geomorphology with appropriate sediment transport and habitat creation (Newson and Large 2006). Nilsson et al. (2018) recommended ecological restoration to attenuate floods by increasing channel roughness, increasing in-stream habitat complexity with large boulders or large woody debris, or increasing wetland construction. Restoration of natural hydrology in tributaries contributes to the successful restoration of the mainstem hydrology. These approaches function to improve stream habitats by increasing water retention capacity. Successful conservation for the Wabash River is possible and begins with nutrient reductions, mechanisms to restore historical hydrologic patterns, additional sediment controls, and improved local hydraulics. We recommend similar approaches for other impacted large river ecosystems.
Availability of data and materials
Not applicable.
References
Angradi TR, Bolgrien DW, Jicha TM, Pearson MS, Taylor DL, Moffett MF, Blocksom KA, Walters DM, Elonen CM, Anderson LE, Lazorchak JM, Reavie ED, Kireta AR, Hill BH. An assessment of stressor extent and biological condition in the North American mid-continent great rivers (USA). River Syst. 2011;19:143–63.
Babbar-Sebens M, Barr RC, Tedesco LP, Anderson M. Spatial identification and optimization of upland wetlands in agricultural watersheds. Ecol Eng. 2013;52:130–42.
Bacula TD, Daugherty DJ, Sutton TM, Kennedy AJ. Blue sucker stock characteristics in the Wabash River, Indiana-Illinois, USA. Fish Manag Ecol. 2009;16:21–7.
Baranya S, Fleit G, Józsa J, Szalóky Z, Tóth B, Czeglédi I, Erős T. Habitat mapping of riverine fish by means of hydromorphological tools. Ecohydrology. 2018;11:e2009.
Bayley PB. Understanding large river—floodplain ecosystems. Bioscience. 1995;45:153–8.
Benke AC, Cushing CE. Rivers of North America. New York: Elsevier; 2005.
Beugly J, Pyron M. Temporal and spatial variation in the long-term functional organization of fish assemblages in a large river. Hydrobiologia. 2010;654:215–26.
Bhowmik NG, Demissie M. Sedimentation in the Illinois River valley and backwater lakes. J Hydrol. 1989;105:187–95.
Blann KL, Anderson JL, Sands GR, Vondracek B. Effects of agricultural drainage on aquatic ecosystems: a review. Crit Rev Envir Sci Technology. 2009;39:909–1001.
Bowes RE. Temporal analysis of river food webs. Dissertation, University of Kansas, Lawrence; 2016.
Box JB, Mossa J. Sediment, land use, and freshwater mussels: prospects and problems. J N Am Benth Soc 1999;18:99–117.
Broadway KJ, Pyron M, Gammon JR, Murry BA. Shift in a large river fish assemblage: body-size and trophic structure dynamics. PlosOne. 2015. https://doi.org/10.1371/journal.pone.0124954.
Carson RT, Mitchell RC. The value of clean water: the public’s willingness to pay for boatable, fishable, and swimmable quality water. Wat Res Research. 1993;29:2445–54.
Cosens BA, Stow CA. Resilience and water governance. In: Garmestani AS, Allen CR, editors. Social-ecological Resilience and Law. New York: Columbia University Press; 2014. p. 142–75.
Coulter DP, MacNamara R, Glover DC, Garvey JE. Possible unintended effects of management at an invasion front: reduced prevalence corresponds with high condition of invasive bigheaded carps. Biol Conserv. 2018;221:118–26.
Counihan TD, Waite IR, Casper AF, Ward DL, Sauer JS, Irwin ER, Chapman CG, Ickes BS, Paukert CP, Kosovich JJ, Bayer JM. Can data from disparate long-term fish monitoring programs be used to increase our understanding of regional and continental trends in large river assemblages? PLoS One. 2018;13:e0191472.
Crawford S, Whelan G, Infante DM, Blackhar, K, Daniel WM, Fuller PL, Birdsong T, Wieferich DJ, McClees-Funinan R, Stedman SM, Herreman K, Ruhl P. Through a Fish's Eye: The Status of Fish Habitats in the United States 2015. National Fish Habitat Partnership. 2016. http://assessment.fishhabitat.org/.
Cummings KS, Meyer CA, Page LM. Survey of the freshwater mussels (Mollusca: Unionidae) of the Wabash River drainage. Final Report to the Nongame and Endangered Wildlife Program. Indianapolis: Division of Fish & Wildlife, IDNR; 1992. p. 201.
DeBoer JA, Anderson AM, Casper AF. Multi-trophic response to invasive silver carp (Hypophthalmichthys molitrix) in a large floodplain river. Freshw Biol. 2018;63:597–611.
DeBoer JA, Thoms MC, Casper AF and MD Delong. The response of fish diversity in a highly modified large river system to multiple anthropogenic stressors. J Geophys Res: Biogeo 2019;DOI:10.1029/2018JG004930.
Delong MD. Upper Mississippi River basin. New York: Elsevier; 2005. p. 327–74.
Dodds WK, Robinson CT, Gaiser EE, Hansen GJA, Powell H, Smith JM, Morse NB, Johnson SL, Gregory SV, Bell T, Kratz TK, McDowell WH. Surprises and insights from long-term aquatic data sets and experiments. Bioscience. 2012;62:709–21.
Erős T, Kuehne L, Dolezsai A, Sommerwerk N, Wolter C. A systematic review of assessment and conservation management in large floodplain rivers—actions postponed. Ecol Indic. 2019;98:453–61.
Fausch KD, Torgerson CE, Baxter CV, Li HW. Landscapes to riverscapes: bridging the gap between research and conservation of stream fishes. Bioscience. 2002;52:483–98.
Fisher BE. Current status of freshwater mussels (Order Unionoida) in the Wabash River drainage of Indiana. Proc Indiana Acad Sci. 2006;115:103–9.
Gammon JR. The Wabash River Ecosystem. Bloomington:Indiana University Press;1998.
Garvey J, Ickes B, Zigler S. Challenges in merging fisheries research and management: the Upper Mississippi River experience. Hydrobiologia. 210;640:125–44.
Gibson-Reinemer DK, Sparks RE, Parker JL, DeBoer JA, Fritts MW, McClelland MA, Chick JH, Casper AF. Ecological recovery of a river fish assemblage following the implementation of the Clean Water Act. Bioscience. 2017;67:957–70.
Gore JA, Shields FD Jr. Can large rivers be restored? Bioscience. 1995;45:142–52.
Graf WL. Dam nation: a geographic census of American dams and their large-scale hydrologic impacts. Wat Resources Res. 1999;35:1305–11.
Harding JS, Benfield EF, Bolstad PV, Helfman GS, Jones EBD. Stream biodiversity: the ghost of land use past. Proc Natl Acad Sci. 1998;95:14843–7.
Horne AC, O’Donnell EL, Acreman M, McClain ME, Poff NL, Webb JA, Stewardson MJ, Bond NR, Richter B, Arthington AH, Tharme RE, Garrick DE, Daniell KA, Conalin JC, Thomas GA, Hart BT. Moving forward: the implantation challenge for environmental water management. In: Horne AC, Webb JA, Sewardson MJ, Richter B, Acreman, editors. Water for the Environment: from policy and science to implementation and management. London: Academic Press; 2017.
Jacobson RB, Galat DL. Flow and form in rehabilitation of large-river ecosystems: an example from the Lower Missouri River. Geomorphology. 2006;77:249–69.
Jacquemin SF, Pyron M. Impacts of past glaciation events on contemporary fish assemblages of the Ohio River basin. J Biogeogr. 2011;38:982–91.
Johnson BL, Richardson WB, Naimo TJ. Past, present, and future concepts in large river ecology. Bioscience. 1995;45:134–41.
Jordan DS. Report of explorations made during the summer and autumn of 1888, in the Alleghany region of Virginia, North Carolina and Tennessee, and in Western Indiana, with an account of the fishes found in the river basins of those regions. Bull US Fish Comm 1888, 1890;8:97-173.
Kennedy AJ, Daugherty DJ, Sutton TM, Fisher BE. Population characteristic of shovelnose sturgeon in the Upper Wabash River, Indiana. North Amer J Fish Manage. 2007;27:52–62.
Knox JC. Sensitivity of modern and Holocene floods to climate change. Quat Sci Rev. 2000;19:439–57.
Knox JC. Floodplain sedimentation in the Upper Mississippi Valley: natural versus human accelerated. Geomorphology. 2006;79:286–310.
Konrad CP, Olden JD, Lytle DA, Melis TS, Schmidt JC, Bray EN, Freeman MC, Gido KB, Hemphill NP, Kennard MJ, McMullen LE, Mims MC, Pyron M, Robinson CT, Williams JG. Large-scale flow experiments for managing river systems. Bioscience. 2011;61:948–59.
Küchler AW. Potential natural vegetation of the conterminous United States. New York: American Geographic Society; 1966.
Lamouroux N, Gore JA, Lepori F. Statzner B. The ecological restoration of large rivers needs science-based, predictive tools meeting public expectations: an overview of the Rhône project. Freshw Biol 2015;60:1069-1084.
Lemke MJ, Walk JW, Lemke AM, Sparks RE, Blodgett KD. Introduction: the ecology of a river floodplain and the Emiquon preserve. Hydrobiologia. 2017;804:1–17 https://doi.org/10.1007/s10750-017-3335-8.
Lian Y, You J-Y, Sparks R, Demissie M. Impact of human activities to hydrologic alterations on the Illinois River. J Hydrol Eng. 2012;17:537–46.
Love SA, Lederman NJ, Haun RL, DeBoer JA, Casper AF. Does aquatic invasive species removal benefit native fish? The response of gizzard shad (Dorosoma cepedianum) to commercial harvest of bighead carp (Hypophthalmichthys nobilis) and silver carp (H. molitrix). Hydrobiologia. 2017. https://doi.org/10.1007/s10750-017-3439-1.
Magilligan FJ, Nislow KH. Changes in hydrologic regime by dams. Geomorphology. 2005;71:61–8.
Mahl RH, Tank JL, Roley SS, Davis RT. Two-state ditch floodplains enhance N-removal capacity and reduce turbidity and dissolved P in agricultural streams. J Amer Wat Res Assoc. 2015;51:923–40.
McClelland MA, Sass GC, Cook TR, Irons KS, Michaels NN, O’Hara TM, Smith CS. The long-term Illinois River fish population monitoring program. Fisheries. 2012;37:340–50.
McCluney KE, Poff NL, Palmer MA, Thorp JH, Poole GC, Williams BS, Williams MR, Baron JS. River macrosystems ecology: sensitivity, resistance, and resilience of whole river basins with human alterations. Front Ecol Environ. 2014;12:48–58.
Minder M, Pyron M. Dietary overlap and selectivity among silver carp and two native filter feeders in the Wabash River. Ecol Freshw Fish. 2017;27:506–12.
Mitsch WJ, Day JW, Gilliam JW, Groffman PM, Hey DL, Randall GW, Wang N. Reducing nitrogen loading to the Gulf of Mexico from the Mississippi River Basin: strategies to counter a persistent ecological problem: ecotechnology—the use of natural ecosystems to solve environmental problems—should be a part of efforts to shrink the zone of hypoxia in the Gulf of Mexico. Bioscience. 2001;51:373–88.
Muenich RL, Chaubey I, Pyron M. Evaluating potential water quality drivers of a fish regime shift in the Wabash River using SWAT. Ecol Model. 2016;340:116–25.
Newson MD, Large ARG. ‘Natural’ rivers, ‘hydromorphological quality’ and river restoration: a challenging new agenda for applied fluvial geomorphology. Earth Surf Proc Landforms. 2006;31:1606–24.
Nilsson C, Reidy CA, Dynesius M, Revenga C. Fragmentation and flow regulation of the world’s large river systems. Science. 2005;308:405–8.
Nilsson C, Riis T, Sarneel JM, Svavarsdóttir K. Ecological restoration as a means of managing inland flood hazards. Bioscience. 2018;68:89–99.
Odgaard AJ. Streambank erosion along two rivers in Iowa. Wat Res Research. 1987;23:1225–36.
Olden JD, Konrad CP, Melis TS, Kennard MJ, Freeman MC, Mims MC, Bray EN, Gido KB, Hemphill NP, Lytle DA, McMullen LE, Pyron M, Robinson CT, Schmidt JC, Williams JG. Are large-scale flow experiments informing the science and management of freshwater ecosystems? Front Ecol Environ. 2014;12:176–85.
Page LM, Pyron M, Cummings KS. Impacts of fragmentation on midwestern aquatic organisms. In: Schwartz MW, editor. Conservation in Highly Fragmented Landscapes. New York: Chapman and Hall; 1997.
Palmer MA, Bernhardt ES, Allan JD, Lake PS, Alexander G, Brooks S, Carr J, Clayton S, Dahm CN, Follstad Shah J, Galat DL, Loss SG, Goodwin P, Hart DD, Hassett B, Jenkinson R, Kondolf GM, Lave R, Meyer JL, O’Donnell TK, Pagano L, Sudduth E. Standards for ecologically successful river restoration. J Appl Ecol. 2005;42:208–17.
Pendleton RM, Schwinghamer C, Solomon LE, Casper AF. Competition among river planktivores: are native planktivores still fewer and skinnier in response to the silver carp invasion? Environ Biol Fish. 2017;100:1213–22.
Poff NL, Allan JD, Bain MD, Karr JR, Prestegaard KL, Richter B, Sparks R, Stromberg J. The natural flow regime. Bioscience. 1997;47:769–84.
Powers SM, Bruulsema TW, Burt TP, Chan NI, Elser JJ, Haygarth PM, Howden NJ, Jarvie HP, Lyu Y, Peterson HM, Sharpley AN. Long-term accumulation and transport of anthropogenic phosphorus in three river basins. Nat Geosci. 2016;9:353–6.
Pracheil BM, McIntyre PB, Lyons JD. Enhancing conservation of large-river biodiversity by accounting for tributaries. Front Ecol Environ. 2013;11:124–8.
Pyron, M, Lauer TE. Hydrological variation and fish assemblage structure in teh middle Wabash River. Hydrobiologia. 2004;525:203–14.
Pyron M, Becker JC, Broadway KJ, Etchison L, Minder M, Decolibus D, Chezem M, Wyatt KH, Murry BA. Are long-term fish assemblage changes in a large US river related to the Asian Carp invasion? Test of the hostile take-over and opportunistic dispersal hypothesis. Aquat Sci. 2017;79:631–42.
Pyron M, Beugly JS, Pritchett JM, Jacquemin SJ, Lauer TE, Gammon JR. Long-term fish assemblages of inner bends in a large river. River Res Appl. 2010;27:684–92.
Pyron M, Lauer T, Gammon JR. Stability of the Wabash River fish assemblage from 1974 to 1998. Freshw Biol. 2006;51:1789–97.
Pyron M, Lauer TE, Leblanc D, Weitzel D, Gammon JR. Temporal and spatial variation in an index of biotic integrity for the middle Wabash River, Indiana. Hydrobiologia. 2008;600:205–14.
Pyron M, Minder MM, Shields RC, Chodkowski N, Artz CC, Mims MC. Long-term fish assemblages of the Ohio River: altered trophic and life history strategies with hydrologic alterations and landuse modifications. PLOS ONE. 2019. https://doi.org/10.1371/journal.pone.0211848.
Pyron M, Neumann K. Hydrologic alterations in the Wabash River watershed. River Res Appl. 2008;24:1175–84.
Rahman S, Bowling L. Streamflow impacts of management and environmental change in the upper Wabash River basin. J Hydrol Eng. 2018;24:05018034.
Richter B, Thomas GA. Restoring environmental flows by modifying dam operations. Ecol Soc. 2007;12:12. http://www.ecologyandsociety.org/vol12/iss1/art12/.
Richter BD, Baumgartner JV, Powell J, Braun DP. A method for assessing hydrologic alteration within ecosystems. Conserv Biol. 1996;10:1163–74.
Richter BD, Mathews R, Harrison DL, Wigington R. Ecologically sustainable water management: managing river flows for ecological integrity. Ecol Appl. 2003;13:206–24.
Sass GG, Cook TR, Irons KS, McClelland MA, Michaels NN, O’Hara TM, Stroub MR. A mark-recapture population estimate for invasive silver carp (Hypophthalmichthys molitrix) in the La Grange Reach, Illinois River. Biol Invasions. 2010;12:433–6.
Schneider DW, Ellis CD, Cummings KS. A transportation model assessment of the risk to native mussel communities from zebra mussel spread. Conserv Biol. 1998;12:788–800.
Sekely AC, Mulla DJ, Bauer DW. Streambank slumping and its contribution to the phosphorus and suspended sediment loads of the Blue Earth River, Minnesota. J Soil Water Conserv. 2002;57:243–50.
Simon TP. Biodiversity of fishes in the Wabash River: status, indicators, and threats. Proc Indiana Acad Sci. 2006;115:136–48.
Solomon LE, Pendleton RM, Chick JH, Casper AF. Long-term changes in fish community structure in relation to the establishment of Asian carps in a large floodplain river. Biol Invasions. 2016;18:2883–95.
Sparks RE. Need for ecosystem management of large rivers and their floodplains. Bioscience. 1995;45:168–82.
Stoeckel JA, Schneider DW, Soeken LA, Blodgett KD, Sparks RE. Larval dynamics of a riverine metapopulation: implications for zebra mussel recruitment, dispersal, and control in a large-river system. J N Am Benthol Soc. 1997;16:586–601.
Strayer D, Cole JJ, Findlay SEG, Fischer DT, Gephart JA, Malcom HM, Pace ML, Rosi-Marshall EJ. Decadal-scale change in a large-river ecosystem. Bioscience. 2014;64:496–510.
Stuck JG, Porreca AP, Wahl DH, Colombo RE. Contrasting population demographics of invasive silver carp between an impounded and free-flowing river. N Am J Fish Manag. 2015;35:114–22.
Tayyebi A, Pijanowski BC, Pekin BK. Land use legacies of the Ohio River Basin: using a spatially explicit land use change model to assess past and future impacts on aquatic resources. Appl Geogr. 2014;57:100–11.
Thomas JA, Emery EB, McCormick FH. Detection of temporal trends in Ohio River fish assemblages based on lock chamber surveys (1957-2001). Am Fish Soc Symp. 2005;45:431–50.
Thornton JL, Vaskar Nepal KC, Frankland LD, Jansen CR, Hirst J, Colombo RE. Monitoring demographics of a commercially exploited population of shovelnose sturgeon in the Wabash River, Illinois/Indiana, USA. J Appl Ichthy 2018. https://doi.org/10.1111/jai.13749.
Thorp JH, Flotermersch JE, Delong MD, Casper AF, Thoms MC, Ballantyne F, Williams BS, O’Neill BJ, Haase CS. Linking ecosystem services, rehabilitation, and river hydrogeomorphology. Bioscience. 2010;60:67–74.
Thorp JH, Thoms MC, Delong MD. The riverine ecosystem synthesis: biocomplexity in river networks across space and time. River Res Appl. 2006;22:123–47.
Trautman MB. The fishes of Ohio. Columbus, Ohio: The Ohio State University Press; 1981.
US Army Corps of Engineers. Wabash River Watershed Section 729 Initial Watershed Assessment. 2011. www.lrl.usace.army.mil/Portals/64/docs/CWProjects/WabashStudy.pdf.
Vannote RL, Minshall GW, Cummins KW, Sedell JR, Cushing CE. The river continuum concept. Can J Fish Aquat Sci. 1980;37:130–7.
Ward JV, Tockner K, Schiemer F. Biodiversity of floodplain river ecosystems: ecotones and connectivity1. Reg Riv Res Manage. 1999;15:125–39.
Watters GT, Flaute CJM. Dams, zebras, and settlements: the historical loss of freshwater mussels in the Ohio River mainstem. Am Malacol Bull. 2010;28:1–12.
Wheater H, Evans E. Land use, water management and future flood risk. Land Use Policy. 2009;265:S251–64.
Williams BS, D’Amico E, Kastens JH, Thorp JH, Flotemersch JE, Thoms MC. Automated riverine landscape characterization: GIS-based tools for watershed-scale research, assessment, and management. Environ Monit Assess. 2013;185:7485–99.
Acknowledgements
We are grateful to multiple students and scientists who collected fishes or collaborated with us for data. Thanks to Kristen Bouska for editorial suggestions on an earlier draft.
Funding
Funding for earlier collections was from Eli Lilly and Company, Duke Energy, and U.S. Fish and Wildlife Service.
Author information
Authors and Affiliations
Contributions
All authors designed the study and drafted the manuscript. The authors read and approved the final manuscript.
Corresponding author
Ethics declarations
Ethics approval and consent to participate
Not applicable
Consent for publication
Not applicable
Competing interests
The authors declare that they have no competing interests.
Additional information
Publisher’s Note
Springer Nature remains neutral with regard to jurisdictional claims in published maps and institutional affiliations.
Rights and permissions
Open Access This article is licensed under a Creative Commons Attribution 4.0 International License, which permits use, sharing, adaptation, distribution and reproduction in any medium or format, as long as you give appropriate credit to the original author(s) and the source, provide a link to the Creative Commons licence, and indicate if changes were made. The images or other third party material in this article are included in the article's Creative Commons licence, unless indicated otherwise in a credit line to the material. If material is not included in the article's Creative Commons licence and your intended use is not permitted by statutory regulation or exceeds the permitted use, you will need to obtain permission directly from the copyright holder. To view a copy of this licence, visit http://creativecommons.org/licenses/by/4.0/.
About this article

Cite this article
Pyron, M., Muenich, R.L. & Casper, A.F. Conservation potential of North American large rivers: the Wabash River compared with the Ohio and Illinois rivers. Fish Aquatic Sci 23, 15 (2020). https://doi.org/10.1186/s41240-020-00160-z
Received:
Accepted:
Published:
DOI: https://doi.org/10.1186/s41240-020-00160-z