
Abstract
Color information plays an important role in the color image segmentation and real-time color sensor, which affects the result of video image segmentation and correct real-time temperature value. In this paper, a novel real-time color image segmentation method is proposed, which is based on color similarity in RGB color space. According to the color and luminance information in RGB color space, the dominant color is determined at first, and then color similarity can be calculated with the proposed calculation method of color component, which creates a color-class map. Next, the information of the corresponding color-class map is utilized to classify the pixels. Due to the characteristic that thermal inks feature color values that change in real time as the temperature changes, the segmentation results of thermal ink can be used as a real-time color sensor. Then, we also propose a method of color correction and light source compensation for the sake of potential inaccuracy of its measures. We discuss the proposed segmentation method application combining with color sensor (thermal ink) in real-time color image segmentation for Cyber physical system (CPS) by the application in fire detection and summarize a new method in identifying fire in a video based on these characteristics. The experiments showed that the proposed method in vision-based fire detection and identification in videos was effective; the results were accurate and can be used in real-time analysis.
1 Introduction
Cyber physical systems (CPS), as a computing process and the physical process of unity, is integrated computing, communication, and control in one of the next generation of intelligent systems. It interacts with the physical process through the human-computer interaction interface and uses the network space to manipulate a physical entity in a remote, reliable, real-time, secure, and cooperative way.
CPS includes future ubiquitous environment awareness, embedded computing, network communication, and network control system engineering that enable physical system with computing, communication, precise control, remote collaboration, and autonomous capabilities. It focuses on computing resources and physical resources in close integration and coordination, mainly for some intelligent systems such as robots, and intelligent navigation. At present, the information physics system is still a relatively new research field.
With the continuous development of computer technology, network technology, and mathematical theory, the research of digital image processing in real-time systems which has become an important component of CPS has been widely applied in various fields, such as biomedicine, satellite remote sensing, and image communication. As a part of the image processing, image segmentation plays an important role. Image segmentation in real-time systems is a technology and process of which divides image into a number of specific and unique section and extracts the interested section. Video image segmentation is an important issue in the field of computer vision and also a classic puzzle [1, 2]. Its researches have been applied in face identification system, fingerprint identification system, fire detection and identification system, machine vision, and medical imaging, and so on. As is known to all, CT (computed tomography) is widely used in hospitals, which uses the result of image segmentation to help diagnose patients effectively and rapidly in real time. Now, face identification system and machine vision are the most concern of scholars.
There are many video image segmentation algorithms of different applications. But so far, there is no uniform solution or standard for video image segmentation, and there is also no complete theory for guidance on how to select the appropriate segmentation method based on image characteristics. Under normal conditions, in order to more effectively solve a specific problem in the field of image segmentation, it is combined with the knowledge of the relevant areas.
According to the image gray level, image segmentation can be divided into gray scale image segmentation and color image segmentation. Compared to the gray scale images, color images include not only the brightness but also the color information, such as hue and saturation. In many cases, we can not extract the target information from the image by simply using the gray information while the human eye can recognize thousands of colors, so we can quickly obtain the segmentation with color information [3, 4]. Therefore, it is essential to study the color image segmentation which has broad prospects.
There are many splitting methods in color image segmentation, such as histogram threshold-based method, region-based methods, and fuzzy clustering segmentation and edge detection methods [5–8]. These methods also combine different color spaces according to the needs of segmentation [9, 10]. Therefore, in the process of color image segmentation, we should firstly determine the color space, then select the appropriate segmentation method.
The image is very vulnerable to the effects of light and noise, so not only the noise but also the light changes should be taken into consideration when segmenting. Image color appearance would change when the light was changed. It will lead to inaccuracy of segmentation by only using the color information, regardless of the brightness information. In order to obtain the good segmentation, it uses the color information and the brightness information concurrently. In this paper, a novel image segmentation method is proposed which can segment the foreground and background in RGB color space by using the color information and the brightness information. The segmentation result of this method is better.
With modern industrial production develops toward the high speed and automatic direction, color recognition has been widely used in various industrial detection and automatic control field. And the work of color identification which is led by the human eye in the long-term production has been replaced by more and more color sensors. Color sensor detects color with comparison the object color with the reference color, and if they are consistent in a certain error range, then output the detection results. Color sensor can be applied in many fields, such as monitoring the production process and product quality in the industry [11]; the realization of the true color copy without affected by environmental temperature, humidity, paper and toner influence in the electronic reproduction aspects; a disease indicator to study a sickness in the Medical; and automatic control in detection two adjacent label colors of a paper and automatically count the number of all sorts of color by auto-counter in the commodity packaging [12]. There are many kinds of color sensors so far. The typical color sensor is TCS230 color sensor [13], the latest color sensor of TAOS Company. It can recognize and detect colors and has many good new features in comparison with other color sensors. It is adequate for colorimeter measurement applications, such as medical diagnosis, color printing, computer color monitor calibration, and cosmetics, paint, textile and the process control of printing materials.
According to the working principle of color sensor and image segmentation method, we will design a similar color sensor function by using the thermal ink characteristic in this paper. The characteristic of thermal ink is that its color value will change in real time as the temperature changes. Therefore, the segmentation results of thermal ink can be used as a real-time color sensor. We get the color information from the segmentation area (thermal ink); through the ink color value of correction and the comparison of the standard color, the right color value is concluded, and finally, temperature is output by the relevance of the thermal ink color and temperature. This design can be used for measuring the indoor, outdoor temperature, and food labels, etc. It can also be used to control the temperature of greenhouse plants. We identify the change of temperature through real-time monitoring of the color change, thereby adjust the temperature to obtain a better yield. This method is real time and fast and without multiple sensor nodes.
The rest of the paper is organized as follows. Section 2 analyzes the color space, video image capture, recognition and segmentation, existing algorithms, and color sensor. Section 3 describes the proposed method and color correction. Section 4 analyzes the experimental results of the proposed method and put forward its application. Section 5 draws the conclusion and finally gives the suggestions.
2 The analysis work
2.1 Color space
In the color image segmentation, the first step is to choose a color space. The color model we know contains RGB, HSI, HSV, CMYK, CIE, YUV, and so on. RGB model is the most commonly used for hardware color model while the HSI model is the most commonly used color model for color processing. They are often used in image processing technology [14, 15].
RGB space is represented by the three primary colors of red, green, blue; other colors are made up with the three primary colors. The RGB model is represented by the Cartesian coordinate system, as shown in Fig. 1. The three axes stand for R, G, B, respectively, and every point in the three-dimensional space means the three components of brightness value. The brightness value is between one and zero.

RGB color model
In Fig. 1, the origin is black, which value is (0,0,0); while the farthest vertex with a value of (1,1,1) from the origin is white. The straight line between black and white called gray line means that the gray value changes from black to white. The remaining three corners represent the complementary color of the three primary colors - yellow, cyan, magenta.
The three components in the RGB color space, which is highly relevant. And it will be changed accordingly as long as the brightness is changed. RGB is a non-uniform color space, so the perception of differences (color) between the two colors cannot stand fort the distance that between two points in the color space. Thus, the RGB color space is often converted to the other color spaces, such as HSI, HSV, the CIE, and Lab, by using linear or nonlinear transform in image processing. However, the original image we have collected usually is the RGB space, color space conversion will increase the amount of computation. And there are many segmentation methods using RGB color space, for example, license location [16] gets the license plate area accurately by calculating the contrast in the RGB components, reducing the calculated amount.
HSI color model is put forward by Munsell, which is suitable for human visual characteristics. The H (hue) means the different colors, S (saturation) means the depth of color, and I (brightness) mean the light and shade of color. This model has two important characteristics: (1) I component has nothing to do with the color information of the image and (2) H and S component are closely linked to the feelings. They are suitable for image processing with the visual system to perceive the color characteristics, and we often take advantage of the H component to segment the color image. The model shows in Fig. 2.

HSI color model
To deal with the image in the HSI space, image must be converted to the HSI mode. The conversion formula (geometric derivation method) as follows Eq. (1):
In the conversion Eq. (1), transformation from the RGB model to the HSI model needs more computation. When brightness was zero, saturation was meaningless and when the saturation was zero, hue made no sense. In the conversion, the hue will generate a singularity that cannot be eliminated [17]. The singularity may lead to the discontinuous of the nearby tonal value in value, which will ignore the low saturation pixels in the image processing and lead to the incorrect segmentation [18]. As is known to us, HSI is suitable for human visual characteristics. Therefore, many scholars have put forth a lot of research for color image segmentation in the HSI model. Reference [19] used the saturation and brightness information of HSI model to get texture image segmentation, which is a combination of fractal theory and BP neural network.
2.2 Video image capture
Generally, there are two ways in video image capture: (1) the use of video capture card with the SDK development tools. This method relies on the Video capture card and the type of camera, not flexible and universal and (2) the use of Microsoft’s Windows operating system and VFW (Video For Window) software Development Kit of Visual C++. It is a pure software way to realize the collection of video streaming, input, and output. This method does not depend on the type of vision sensors, with better flexibility and versatility [20, 21].
This paper uses OpenCV’s CVCAM technology to realize the collection of video stream of visual sensor, processing, and playback (display) at the same time, and realize the file streaming reading, processing, and broadcasting (display).
-
The introduction of the open source Computer Vision Library (OpenCV)
OpenCV is an open source computer vision library that was funded by Intel, composed of a series of C functions and the C++ class, and provides easy-to-use computer vision framework and rich library. The functions include the field of image processing, computer vision, pattern recognition, and artificial intelligence. With the realization of image processing, signal processing, structure analysis, motion detection, camera calibration, computer graphics, 3D reconstruction, and machine learning, a large number of generic algorithms have higher efficiency.
-
OpenCV library has the following advantages:
-
1.
The cross-platform: Windows, Linux, Mac OS, iOS, Android, independent of the operating system, hardware and graphics manager;
-
2.
Free: open source, does not matter if for business applications or for non-commercial applications;
-
3.
The high speed: uses the C/C++, suitable for the development of real-time applications;
-
4.
Easy to use: has a general image/video to load and a save and retrieve module;
-
5.
Flexible: has good scalability, with low-level and high-level application development kit.
-
1.
-
OpenCV 1.0 version consists of the following six modules:
-
1.
The CXCORE module: basic data structures and algorithmsfunction;
-
2.
The CV module: main OpenCV functions;
-
3.
CVAUX module: experimental auxiliary functions;
-
4.
The HighGUI module: graphics interface functions;
-
5.
The ML module: machine learning function;
-
6.
CVCAM modules: camera interface function.
-
1.
Because the OpenCV library functions by optimizing the C code, not only is the code simple and efficient but also can make full use of the advantages of multi-core processors. Therefore, this paper uses Visual C++ development environment and OpenCV technology for video image capture, processing and display.
2.3 Video recognition
Video recognition mainly includes three links: front-end video information collection and transmission, video retrieval, and back-end analysis processing. Video recognition requires front-end video capture camera to provide a clear and stable video signal as video signal quality will directly affect the effect of video identification, then through embedded intelligent analysis module to detect, analyze, identify the video screen, and filter out interference, then make targets and track marks to the video screen in abnormal situations. In which, the intelligent video analysis module is based on the principles of artificial intelligence and pattern recognition algorithms. Its researches have been applied in fire recognition system [22].
Segment algorithms of a flame object is a key problem in fire recognition based on video sequences applications and have a direct impaction improving fire recognition accuracy [23]. In segmentation of flame object, its procedure is precisely based on analyzing fire image characteristic. This paper introduces a new segmentation method of a flame goal based on threshold value of the area using digital image processing technology and pattern recognition technology. Further, it can judge whether fire occurs from the characteristic information such as the fire color, spreading area, the similarity change, and fire smoke. Experiments prove that the method has better robustness. It can segment the image of flame effectively from a sequence of images and reduce the false and missing alarms of the fire surveillance system. So it is very effective to the complex large outdoors occasion.
Using video recognition technology, through effective analysis of surveillance video images of discrimination, may well detect a fire and treated as early as possible to reduce the economic losses, safeguard people’s life, and property safety! Either economically or technically video, fire recognition technology has a distinct advantage. It will also be an important research direction for future identification of fire.
Currently, due to different research directions of hardware devices, video fire recognition technology is divided into the following several research ideas: only analysis of static characteristics of the flame, such as the shape, color, and texture of the flame, analysis of the dynamic characteristics such as similarity, spread trend, edge changes, the whole mobile, layered changes, or in the process of dynamic analysis with some simple area characterized criterion [24]. Dynamic characteristics are focused on by comparing two or more adjacent images in the video to judge the fire flame. An analysis of the properties of a single image of flame is relatively lacking; static characteristics are focused on single picture by precise analysis of the geometric properties of flame to arrive at a determination result. This analysis is faster, but ignoring the analysis of trend of the flame between several consecutive frame pictures; judgment result is inevitable errors.
In order to improve the defects and based on the analysis of the fire and the image features, this paper proposes a new segmentation method of flame goal based on threshold value of the area. The method can not only remove noise but also rapidly and accurately extract the target object. Further, it can judge whether fire occurs from the characteristic information, such as the fire flame color, spreading area and the similarity change, and fire smoke. Experimental results show that the method greatly improves the reliability of the fire judging and accuracy and reduces the false alarm and the omission of the fire recognition, shortening the recognition time of fire.
2.4 Video segmentation
The so-called video segmentation is to separate the object or objects in video sequences that are important or people are interested in (Video Object; VO) from the background, or that is to draw respectively consistent attributes of each area and, at the same time, to distinguish the background and foreground regions. Video images can be regarded as a kind of 3D image. In other words, the video image is composed of a series of time-continuous 2D images. From the perspective of spatial segmentation, video image segmentation is mainly the use of both the spatial and temporal information to pick out the independent motion regions of the video image in a frame by frame detection [25]. Video segmentation is the premise and foundation of other video image processing, such as video coding, video retrieval, and video database operation. The segmentation quality has a direct impact on the work of the late. So, the research of video segmentation technology is important and challenging.
The main purpose of video segmentation is to segment the moving foreground that people are interested in from the background. At present, there are many splitting methods in video segmentation, such as image difference method, time difference method, and optical flow method. Image difference method is the use of the original image and the reconstructed background image to make differences to realize video segmentation. Time difference method is based on the different images, introducing the relationship between hot and cold time-space domain. Optical flow method is based on the moving object optical flow characteristics with time’s change to efficiently extract and track the moving object [26]. Comparing these methods, image difference method with low computational complexity, less affected by the light and low requirement to the hardware, detected better in most cases. The key of image difference method is how to reconstruct a complete video image background. Background reconstruction method mentioned in the literature requires at least 25 video images of unified coordinate pixel values to reconstruct the background image. This method takes a long time and is not conducive to the implementation of segmentation. Since each frame video image of moving foreground region in the same coordinate point have different gray value in general, i.e., frame difference should be a large difference in the foreground area than in the stationary background area. Therefore, by calculating the gray scale value between successive frames can be obtained foreground motion region.
At present, the general steps of video segmentation are the following: first, the original video image data is simplified and eliminated the noise in order to facilitate the segmentation, which can be accomplished by low-pass filtering, median filtering, and morphological filtering; next, extract the features of the video image, which including color, texture, motion, frame difference, and so on; then, based on certain standards of uniformity, determine the split decision according to the feature extraction to classify the video image, and finally, the post-treatment to achieve filtering noise and accurately extract the boundary, getting accurate segmentation results.
2.5 The analysis of segmentation algorithms
Threshold segmentation method [27] is one of the most commonly used parallel regional technologies; it is one of the largest number used in image segmentation. Actually threshold segmentation method is that transform image G to the output image F as follow:
T is the threshold value. If it is the object, then image element G(i,j)=1 or image element G(i,j)=0. Thus, the key of threshold segmentation algorithm is to determine the threshold value. When threshold is determined, we compare the threshold with the gray value of the pixel and divide every pixel concurrently; segmentation result will output the image area directly. Threshold segmentation has the advantage of simple calculation, high efficiency operation, and high speed. It has been widely used in applications that focus on operation efficiency, such as hardware implementation. Scholars have studied all kinds of threshold processing technologies, including global threshold value, adaptive threshold value, and the best threshold value.
In the color image segmentation, we also consider the color value of pixels, i.e., the color information and brightness, which influence the segmentation result. And many scholars have made a lot of research of this problem.
Cheng and Quan [18] puts forward a model color image background difference method based on HSI. According to chromaticity (H), saturation (S), and brightness (I), independent characteristics of the HSI model, it creates the brightness information by the H component and the S component and extracts the precise prospects with using a dynamic threshold of the brightness information. The change of the light will influence accuracy of detection of moving objects, so this paper eliminates it with HSI. The results show that this method is robust for noise and light changes and can well solve the problems of brightness changes. This method can well solve the influence of light, but it would increase the amount of computation when the color space was transformed to HSI space.
Huang et al. [28] describes an algorithm in traffic sign segmentation. It considers the influence of light and the transformations in the color space and analysis of a lot of traffic sign pictures and researches the relationship between the color pixels in the RGB color space; the paper puts forward a traffic sign segmentation method based on an RGB model. This method can be very good in dealing with traffic sign segmentation of the impact of the noise and light; the segmentation result is precise and can be real-time processed, but it needs a lot of research of traffic to get the experience threshold.
In this paper, we seriously discussed the influence factors of the image segmentation, including light, noise, and color space. An algorithm of color image segmentation base on color similarity in the RGB color space is presented; we calculate the pixels’ similarity by color similarity and form classification map, and obtain the segmentation finally.
2.6 Color sensor and color correction
2.6.1 Color sensor
Color has always played an important role in our life and production activities. The color of an object contains a lot of information, so it is easily affected by many factors, such as radiation light and reflections, light source azimuth, observation orientation, and the performance of the sensor [29]; the change of any parameter will lead to a change in the observed color.
The standard method of color measurement is that measures the sample tristimulus values by making use of spectrophotometric color measurement instrument and obtains the color of the sample. At present, there are two basic types sensor based on the principle of all kinds of color identification:
-
RGB color sensor (red, green, blue) mainly detects tristimulus values;
-
Chromatic aberration sensor detects the chromatic aberration of the object to be tested and the standard color. This kind of device contains diffuse type, beam type, and optical fiber type, and is encapsulated in various metals and polycarbonate shells.
RGB color sensor has two kinds of measurement modes: one is to analyze the proportion of red, green, blue. No matter how detection distance changes, it just only cause the change of light intensity but not the proportion of the three kinds of color light. Therefore, it can be used even in the target mechanical vibration occasions. The other mode is to use the reflected light intensity of the primary colors of red, green, and blue to detect. It can detect the tiny color discrimination, but the sensor will be affected by the impact of the target mechanical position. Most RGB color sensors have a guide function that makes it very easy to set up. This kind of sensor mostly has a built-in chart and a threshold value which can determine the operating characteristics. It can more accurately measured color using panchromatic color sensitive devices and means of correlation analysis. Typically, in order to obtain the color tristimulus values, it requires at least three photodiodes as well as three corresponding filters [30], so the structure and circuits are complicated.
2.6.2 Partial color detection
In the color sensor, the main point is how to detect a color. We know that there is a disparity between the real color of the object surface and the acquisition image color by imaging device. This is a partial color, which is caused by the surrounding environment, such as light and noise. And the degree of color cast has a deal with the color temperature of the outside light. Color temperature [31] to the color of the light source is the description of a color measurement. When a light color from a light source and the radiation color of a black body in a certain temperature phase is the same, we call it light color temperature.
Under the different light sources, such as natural light, tungsten filament lamp, and halogen lamp, the same kind of color is not the same. The difference is caused by different sources of the “color temperature.” Generally, the image color shows slanting blue when the light color temperature is higher. And the image color shows slanting red when the light color temperature is lower. So how to make the collected images to correctly reflect the real color is a key of research.
Before correcting the color, we should know if the image exists a partial color and how to detect it and its degree. At present, there are some representative partial color detection methods, including histogram statistics [32], gray balance method [33], and white balance method [33]. They can detect images whether there are partial colors.
Histogram statistics can show the whole color performance of the image. It will give the average brightness of three channel of RGB color space. We can judge whether the color of initial image is partial by the average brightness of R, G, and B channels. If the brightness of any component is the highest value, then the whole image color will be the color of this component representative. That is, if the brightness value of component G is the biggest, the whole image displays red. But the cause of the partial color is complex for different applications, so this method is difficult to get comprehensive and accurate judgment.
Gray balance method assumes the mean of the R, G, and B is equal in the whole image, which embodies as neutral “ash.” It uses statistics to average the brightness of every channel, converts it into Lab color space, obtains the homogeneous Lab coordinates relatively, calculates the color lengths to the neutral point, and judges whether there is partial color. But when the environment is lighter or darker, or the color of the image is more single, the mean of the R, G, and B is not equal.
White balance method deals with the existing mirror reflection image; it considers that the specular part of the mirror or the white area reflection can reflect the light color of light source. We count the max brightness value of every channel, convert it into Lab color space, obtain the homogeneous Lab coordinates relatively, calculate the color lengths to the neutral point, and judge whether there is partial color. But the result is distorted when the shooting objects has no white or specular part.
All these methods are just only suitable for a certain scope but not all. Therefore, it is limited just to the average image color or brightness max value to measure partial color degree. So, people develop other detection methods for well detection.
2.6.3 Color correction
After color cast detection, the next step is color correction. Color correction is how to describe object intrinsic color under different lighting conditions, and it has been applied in medical image, remote sensing images, mural images, licenses, and many other images. There are some classic methods for color correction, such as gray world color correction [34] and perfect reflection color correction [35].
Gray world color correction meets a hypothesis of the film image which is colorful, namely the statistics mean value of every channel should be equal and the color shows gray scale. We calculate the mean average of the filmed image, keep component G unchanged, and let the mean value of component R and B as the basis of color correction. But this method cannot be used in an image with a large single color.
Perfect reflection color correction. The object itself has no color; it shows color through a different wavelength of light absorption, reflection, and projection. If the object is white, all the light is reflected. The white object or area is called the perfect reflector. Perfect reflection theory is based on the hypothesis that it consider the perfect reflector as a standard white in an image. No matter what light it is, a white object, the R, G, and B of its image are of great value. Based on the perfect reflector, it corrects other colors.
The two kinds of color correction method are suitable for most color corrections, and the calculation is relatively simple, but sometimes can not come back to the real object color.
With various application scenarios of color correction, many scholars have proposed novel methods for color correction. Luz et al. propose a method based on Markov Random Field (MRF) which is used to represent the relationship between color depleted and color image to enhances the color of the image for the application of underwater image [36]. The parameters of the MRF model are learned from the training data and then the most likely color distribution for each pixel in the given color-depleted image is inferred by using belief propagation (BP). This allows the system to adapt the color restoration algorithm to the current environmental conditions and also to the task requirements. Colin et al. propose a method for correcting the color of multiview video sets as a preprocessing step to compression [37]. Distinguished from a previous work, where one of the captured views is used as the color reference, they correct all views to match the average color of the set of views. Block-based disparity estimation is used to find matching points between all views in the video set, and the average color is calculated for these matching points. A least-squares regression is performed for each view to find a function that will make the view most closely match the average color. Rizzi et al. propose a new algorithm for digital images unsupervised enhancement with simultaneous global and local effects, called ACE for Automatic Color Equalization [38]. It is based on a computational model of the human visual system that merges the two basic “Gray World” and “White Patch” global equalization mechanisms. Similar with the human visual system, ACE adapts to a wide range of lighting conditions and effectively extracts visual information from the environment. It has shown promising results in achieving different equalization tasks, e.g., performing color and lightness constancy, realizing image dynamic data driven stretching, and controlling the contrast. Yoon et al. use the temporal difference ratio of HSV color channels to compensate of color distortion between consecutive frames [39]. Experimental results show that the proposed method can be applied to consumer video surveillance systems for removing atmospheric artifacts without color distortion.
3 Methods
In this section, we firstly introduce the calculation method of the color similarity traditionally and put forward an improve method for this method, then give the way of extraction of flame target and judgment of fire. Finally, the paper will describe the realization of the proposed algorithm. We also describe the measures for the fill light of the image and color correction and draw the correction model.
3.1 The calculation of the color similarity
We introduce a scale invariance and semantics of mathematical model, called SIMILATION [40], which calculates color similarity. Given a set, the SIMILATION is defined as the harmonic mean and arithmetic mean of the proportion of the set. The harmonic mean (3), the arithmetic mean (4), and the SIMILATION (5) are defined as follows [40]:
In the concept, SIMILATION represents the similarity level of a set of values, and its range is from the positive infinitesimal to one. When the value of SIMILATION equals one, it means that each value of the set is equal. When the value of SIMILATION is positive infinitesimal (note: according to the Eqs. (3) and (4), SIMILATION value could not be 0), it means that each value of the set is variety. So, we can describe the similarity of a set of values by SIMILATION, because a low similarity is equivalent to a high diversity.
The SIMILATION is scale invariance, and it reflects the diversity from the proportional relationship. In Table 1, the SIMILATION still is a constant, as long as the proportional relationship between the data of a set has not changed. The standard deviation is a description of a set of data similarity. Although the ratio between data is invariant, the standard deviation has changed. More specifically, scaling of R, G, B values simultaneously with the same degree is equivalent to brightness changing in color spaces. Thus, the scale invariant property is fit for achieving brightness invariance in color segmentation.
The color similarity between two colors (R1,G1,B1) and (R2,G2,B2) is measured as below:
-
1.
Compute (R0,G0,B0) as shown in Eq. (6).
-
2.
Substitute (V1,V2,V3) with (R0,G0,B0) as in Eq. (4) to calculate the SIMILATION.
The Eq. (5) shows that any one could not be zero, so any component of the two sets of color does not equal to zero in the Eq. (6). Therefore, this measure could not deal with some color value which equal to 0, such as (255,0,0). In the coordinate system of RGB model, there is a lot of color value, for example, yellow (255,255,0) or black (0,0,0).
In the RGB color space, when the color shows red, it declares the component red is a bigger number than the other components relatively. While the color shows yellow, it declares the component red is a smaller number than the other components relatively and the gap of the other two components is small. Thus, we modify the color similarity method as follows:
-
1.
Determine a reference color according to a certain rule (it will be described in the next section), the component value of this color does not contain a value of 0;
-
2.
Firstly, check the consulted color by comparing the three components for 0, if it does not, please calculate the color similarity with the SIMILATION;
-
3.
If the three components contain 0, we calculate the color similarity as follows:
-
(a)
Only one component equals to 0, such as (R,G,0). Check the value of (R−B) for a positive number; if the value is a positive number, it indicates that the color is rendered as red; otherwise, it is rendered as green. Similarly, other color combinations can also be calculated on the basis of the method.
-
(b)
Only two components equal to 0, such as (R,0,0). The (R,0,0) means the color is rendered as red. Similarly, the colors (0,G,0) and (0,0,B) are rendered as green and blue respectively.
-
(c)
The black (0,0,0) remains without any further processing.
-
(a)
Finally, the results are compared with the reference color; if they belong to the same color, then the two colors are similar.
In Table 2, the SIMILATION measures the similarity of the two sets of color well. The first row shows that the SIMILATION equals to one, only the brightness is different in two colors, and it is equal in the value of two sets of R0,G0,B0. On the other hand, if two colors are not equal in hue (the brightness is different), we also calculate their similarity coefficient by SIMILATION, (i.e., either second or third row of Table 2); the similarity of the two colors is 90%. The fourth line of Table 2, although we could not directly calculate the similarity by SIMILATION, we draw the similarity of two colors information by comparing the color components. The rest of the lines in Table 2 describe the coefficient of similarity of a pixel value and other pixel values.
3.2 Extraction of flame target
Extraction and segmentation of the flame object is the key technology of fire recognition; the accuracy of flame segmentation and extraction is prerequisite to improve accuracy and robustness of the whole detection system. In the ideal image, one can use hollow out method combined with an edge tracking technology to design the algorithm to achieve, but in the practical engineering application, where there are a lot of noise in the captured image, the existing edge detection algorithm, usually with the aid of Roberts Cross [41], Prewitt, and Sobel edge detection operators, is according to the gray value jump or not to detect the image edge, and these methods to measure outline are usually irregular and edge discontinuity, will cost a lot of time to refine the outline and to connect these discontinuous outline, which cannot be allowed in the practical application.
This paper proposes a flame target contour extraction algorithm based on area threshold. The algorithm idea is that at first use, the difference method judges whether there is a target object, and if so, get the area of the target object and the image of the region through a 2D maximum entropy threshold binarization processing, which can get the block of the connected regions in the image. These regions are part of some object, while the others are noise, then put each connected white area as a set, and for a concrete analysis of each set, eliminate the noise and get the outline of the object; the algorithm process is as follows:
A reference image is f0(x,y), sequence image of digital image is f i (x,y),i=0,1,2,⋯,N. (x,y) is the coordinates of the pixel in the each image. N is the number of frames in consecutive image sequences.
Δf i (x,y) is the difference of the two images and f i (x,y) is a current image; f0(x,y) is a reference image. In order to highlight the target (fire), Th1 selects the 2D maximum entropy threshold of the image; it can separate the target and the surrounding background points as far as possible, to facilitate the next step for extraction of the flame and to eliminate the noise points.
-
1.
Scan Δf i (x,y) binary image, all white pixels in this binary image will be added to the linked list that take PixelLink as the head node.
-
2.
To classify the pixels in the PixelLink list, produce a set corresponding to each connected regions (for each set to create a linked list). Begin from a certain point, plus the similar neighboring points forming a region. The similarity criterion can be in gray scale, color, and shape or other characteristics. The test of similarity can be determined by the threshold. It means that start from the point that meet the detection standards, growing area in all directions; if the proximal point meet the detection criterion, add it into the small area, and when the new points are merged, repeat the process to a new region, Until there is no acceptable adjacent point, generation process will to come to an end.
-
3.
Calculate the area of each connected region, which represented a list, then select the appropriate value of area as threshold for image filtering. The connected regions that exceed the area threshold will remain intact, and the smaller ones as noise are eliminated.
-
4.
Using the method of hollow out can get a single pixel width continuous contour of the object, and there will be no outline of the cross. Suppose m is the target contour in the image f i (x,y), denoted as Ai,1,Ai,2,⋯,Ai,m.
After finding flame-suspicious areas, then according to the fire’s features such as color of fire, the size of spread area, similarity, and smoke, make a judgment, to further test whether the suspicious area is the flame.
3.3 The steps of proposed algorithm
In this paper, in order to reduce the calculation amount color space conversion, we choose the RGB model. The proposed method that based on the RGB model of color image segmentation is shown in Table 3.
The process is done in the following steps:
-
1.
Given a color image (it is RGB space), determine the dominant color and quantity.
The dominant color (i.e., the reference color) is determined on the basis of segmentation need. If we just split the foreground and background, then we need to choose two dominant colors; or determine a dominant color if we only need to split the image of a region of color consistency, such as leaves or traffic signs. This paper focuses on the segmentation of foreground and background, so two dominant colors are enough.
Read a color image (the size of the image size is m×n×3); the color space is RGB space. Calculate the probability of each color in this image.
We know that the foreground color and background of every image are made up of a lot of the same or similar color. In the RGB space, every color is composed of components R, G, and B. Let the number of each appearing color as a function value and RGB component as a variable and find the two of the largest probability of the appearing color as the dominant color. Calculation is as follows:
-
(a)
Scan the image according to row m, save the color value that is firstly scanned with the format (R,G,B) and set the number as 1.
-
(b)
Continue to scan, compare the color value that meets with the saved color value, and test the RGB components for equality. If equal, add number one; or save it and set the number as 1.
We can get the number of each color in the image in accordance with the above approach and would determine the dominant color by comparing the number of every color. The dominant color is the reference of the SIMILATION, so any component of the dominant color cannot be zero, and if its value is zero, plus one.
-
(a)
-
2.
Calculate the SIMILATION value and form color information map.
After we have determined the dominant colors (two), we calculate the similarity between each color and the two dominants respectively by the modified computing method. There are two cases:
-
(a)
When every RGB component is not zero, the SIMILATION that we calculate has two values, which stand for the similarity with the two dominant colors respectively. Comparing the two similarity coefficients, the similarity coefficient that is bigger will divide into the collection of the dominant color.
-
(b)
If any one of RGB component is zero, we will judge the similarity of the color component of the final show between each color and the two dominant colors and divide into the corresponding collection when they are similarity. Ultimately, a color-class map is formed.
-
(a)
-
3.
Divide the image pixels and output results.
Pixels are divided into the one collection of these two types based on pixel color and color information map, so foreground and background are segmented. The extracted section will be clear and the boundaries will not be fuzzy, if the colors of the image are obvious. However, the division of pixels refers to the standard of the color similarity measure, which will lead to inaccurate segmentation in some images. For example, some sections belonging to the background may be divided into the foreground region while others belonging to the foreground is divided into the background region. Therefore, it needs other ways to divide the foreground or background for the poor segmentation results.
3.4 The step of judgment of fire
The fire in the formation process, follow certain characteristics and laws.Familiar with the fire formation rules, select and use some unique characteristics of fire flame, it is a vital role to identify fire as soon as possible. In general, the fire in the video has the following characteristics.
For the continuous acquisition of the two images, there must be some regional similarity between the previous frame and the next frame, but this does not cause a similar region turn into a complete overlap. This feature is particularly obvious at the beginning of the fire. The gray of the flame core is greater than the other parts in the image. And after the infrared attenuation, in the video signal, the performance mode of the interference signal is mainly fixed fast moving spot, and the large area of infrared illumination changes.
Therefore, in recognition of the flame, firstly, the flame can be divide into interference pattern and non-interference patterns, and then in the non-interference image pattern to identify the characteristics of the flame to judge is the flame or not. Thus, the video fire recognition includes two aspects, the flame object extraction and according to the flame color and size and other characteristics to judge. The main process is shown in Fig. 3.

The flow chart of segmentation algorithm
-
1.
The judgment of the fire colors
In a real-world environment, a fire may have two possible phenomena: the initial stage had a lot of smoke and the direct flame. In these two phenomena, the color model is completely different and should be dealt separately.
-
(a)
The flame model
Generally, the distribution of the color between the flame and the illuminator is different. To flame, from the flame core to the outer flame, a general trend is to move its color from white to red, according to the characteristics. You can identify the flame.
-
(b)
The smoke model
In reality, the fire does not necessarily have to produce flame, it can be a billowing smoke. Therefore, smoke is also one of the main characteristics of fire, but smoke is not like flame that have attributes which is relatively easy to distinguish with other objects.But this is not to say that the smoke would have no effect in a fire recognition; on the contrary, the features of smoke can be combined and be of good use that can greatly improve the accuracy of the system alarms, which naturally improves the usability of the system.
At the time of the fire, the most obvious characteristic of smoke is that the area is constantly expanding. Therefore, according to the color and shape features of a smoke, one can identify a suspected smoke area. Given the following definition:
$$ r=\frac{R}{R+G+B} $$(8)$$ g=\frac{G}{R+G+B} $$(9)$$ Y=0.30R+0.59G+0.11B $$(10)In the above equations, R, G, and B are the original pixels. After extracting a lot of information about the characteristics of smoke, statistical analysis showed that the following condition is satisfied:
$$ \begin{cases} 0.304264<r<0.335354, \\ 0.318907<g<0.337374, \\ r<g. \end{cases} $$(11)It is a flame region. Calculate the area of the region, then extract the adjacent image, using the same method for processing and analysis. Finally, compare the area of the two processed images, if the area is, change the alarm.
-
(a)
-
2.
The judgment of fire area feature
Flame appears as a bright region in the image acquisition, but if only on the basis of this bright region one can determine fire, it is easy to take some light, sunlight, and other high-temperature objects mistakenly as fire. When a fire happened in the early stage, there is a very significant feature is that of spread, and performance in the area is the area of the expanded, so is the size of the same suspicious areas of adjacent frames, which means the size of the area will change. To further verify that the suspicious region is a flame, calculate for the object contour of five consecutive frames separately. fi+1(x,y),fi+2(x,y),fi+3(x,y),fi+4(x,y),fi+5(x,y) and then calculate the area difference and overlap degree of the area between A i,p , P and suspicious region Ai,1, and area, denoted as Δ i,p and ε,ε i,p , respectively.
$$ \Delta_{i,p}=\sum_{(x,y)\in A_{n}}^{}A_{i+p}(x,y)-A_{i}(x,y) $$(12)$$ \varepsilon_{i,p}=\frac{\sum_{(x,y)\in A_{n}}^{}A_{i+p}(x,y)\bigcap A_{i}(x,y)}{\sum_{(x,y)\in A_{n}}^{}A_{i+p}(x,y)} $$(13)In the above equations, p=i+1,⋯,i+5. Use statistics for the mean of each Δ i,p and ε i,p respectively, denoted as \(\Delta =\sum _{p=1}^{5}\Delta _{i,p}/5\) and \(\varepsilon =\sum _{p=1}^{5}\varepsilon _{i,p}/5\), then given the threshold Th2 and Th3, if Δ≥Th2 and 1>ε≥Th3, the change area is a suspicious fire area.
3.5 The measure of fill light
When without or short of natural light, light output from the thermal ink of the drawing board area can not move toward the camera, so it is difficult to capture the image of this area. If more shades are placed next to the drawing board, clearer images can be obtained on a rainy day or evening. Light source compensation is applicable to many situations, such as VIN recognition and mixed color detection system of glass bottles. The light source in this article is in connection with thermal ink, i.e., the light source refers to light intensity of the normal fluorescent light. It is shown in Fig. 4.

Schematic diagram of compensation light
Color block means thermal ink (herein referred to as the sensing zone) and the center part is the standard color area. The sensing area is surrounded by the same fluorescent lamps; power is provided by solar cells and windmills. The camera is unable to capture where fluorescent lights are, and the intensity of the fluorescent light can not cause a color change of the thermal ink. Therefore, the intensity of fluorescent lights should be determined by several tests. In daytime, solar panels convert light to electricity; wind power also generates electricity, which is stored in the battery. The battery becomes a power supply to the fluorescent lamps, which can be lit continuously. It is an environmentally friendly way, because both solar energy and wind power are renewable, with neither pollution nor drying up.
3.6 The method of color correction
The color value would be changed by light, temperature, and any other environmental factors, so the image should be color corrected after shooting to get accurate color values. In this paper, we will discuss the correction of standard color and thermal ink color.
-
1.
The correction of standard color
The standard color is mainly influenced by light and has nothing with temperature. But the color will change after a long time, this is a common problem. We do not consider it.
Assuming that the size of standard color card is N pixels and the value of every pixel P i is f(i)=(R i ,G i ,B i ),i=1,2,⋯,N, so the average color intensity of the whole standard color card is \(I=\sum _{i=1}^{N}f(i)/N\). Maybe the value of some pixels in the standard color card is too big or too small by the influence of light. These pixel points are not so many but it will affect the overall color intensity values. So, we calculate an accurate color intensity value as follows:
-
(a)
For every color intensity value f(i), we judged this condition |f(i)−I|≥βI, where β is a coefficient.
-
(b)
If (a) is true, the “white spots” (a pixel point whose color value is too big or too small) plus 1 and the total number of pixels minus 1.
-
(c)
The color intensity values of the white points after scanning complete f(j)=(R j ,G j ,B j ),j=1,2,⋯,n, n is the sum of the white points, f(i) the average value of the color intensity of the white point.
-
(d)
The final color intensity \(\bar {I}=\frac {\sum _{i=1}^{N}f(i)-\sum _{j=1}^{n}f(j)}{N-n}\).
We can infer the model of calculating the average intensity value of the colors in the standard color card by a different light \(f(L,\bar {I})\) and the average value of the color intensity in the standard color card f(I), so the influence of light is \(f(L,\bar {I})-f(I)\).
-
(a)
-
2.
The correction of thermal ink
The size of the thermal ink sensing area is thought as M pixels, the value of each pixel point P i is g(i)=(R i ,G i ,B i ),i=1,2,⋯,M. So, the average value of the color intensity in the entire sensing area \(R=\sum _{i=1}^{M}g(i)/M\), which is the color intensity value of the thermal ink region affected by light. We know that an essential color change of the thermal ink is a temperature change of environment. Thermal ink features non-correspondent value of color intensity and temperature, which is not a linear relation. When temperature changes in a specific period, the value of color intensity does not increase linearly, nor increase steadily, so it is necessary to identify a functional relation between temperature and the value of color intensity. In general, T=f(R) can stand for the relation between temperature and the value of color intensity, but it is an exceptional. Figure 5 shows that the curve is not a straight line but segmentations.
Fig. 5 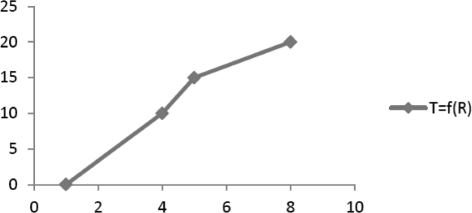
A char of function T=f(R)
It indicates that the change of color intensity and temperature is not the same. The function T=f(R) is adjusted as below:
$$ T=\begin{cases} \partial 1 f(R), \\ \partial 2 f(R), \\ \partial 3 f(R). \end{cases} $$(14)∂1 is a relation coefficient of the temperature and the color intensity value from temperature 0 to T i , so ∂2 from temperature T i to Tn−i and ∂3 from temperature Tn−i to T n .
The three coefficients should be obtained via experimental data. Since the value of color intensity is easily affected by temperature and light, the relationship of the three can be denoted as R=S(T,L), where T is symbolic of temperature, R typical value of color, and L the effect of light.
-
3.
The calculation of temperature area
In order to calculate the value of sensing area, firstly, it should be borne in mind that standard color card and thermal ink are easily affected by light and temperature. The effect of light on standard color card and sensing area is the same as well as the few influences of temperature on a standard color card and, finally, the typical value of color intensity in the sensing area at a given temperature \((S(T,L)-(f(L,\bar {I})-f(I)))\).

4 Results and discussion
4.1 The result of color similarity segmentation
In this experiment, we choose Microsoft visual studio 2010 platform and a software library Opencv (Open Source Computer Vision Library) for image segmentation. Microsoft visual studio 2010 is a development platform with a powerful function, which can improve the working efficiency and flexibility of the programmer and support for multiple development application. Opencv is a computer vision library based on open source issue of the cross-platform and run on several operating systems of Linux, Windows, and Mac OS. It is lightweight and has high efficiency that is composed of a series of C function and a small amount of C + + class structure. It also provides an interface for Python, Ruby, and MATLAB language to implement many generic algorithms of image processing and computer vision. We choose several color images to do an experiment, pictures a–d, the experimental results as shown in Fig. 6.

a–d Fire segmentation results (from left to right is the original image, the foreground, and the background) will have a corresponding change; it can be easy for recognition and segmentation, so it can be used for fire protection systems in real-time analysis
4.2 The results of fire segmentation
In this experiment, we simulate an indoor fire happening, and the camera to capture the video then have a series of processing. We choose several images in the same scene to do the experiment, pictures a–d, the experimental results as shown in Fig. 6.
Video image segmentation results (from left to right is original image, the foreground and the background), the background is almost the same. From the experimental results, these four sets of images can well separate foreground and background in accordance with the proposed algorithm. In Fig. 6a, b, the foreground is smoke. The only difference is the area of the smoke is constantly expanding. Though in (a) and (b), a small portion of background is divided into the foreground, it does not affect the segmentation results. In Fig. 6c, d, where the foreground is smoke and flame, it is easy to see the area of fire and smoke as both are changing from (c) to (d), the flame area was expanded and the smoke area was reduced. In Fig. 6d, the background is similar to the flame. But the flame is divided into the foreground well.
5 Conclusions
This work presents a new color image segmentation algorithm based on color similarity in real-time color image segmentation for cyber physical systems. We firstly determine the dominant color. And then, we use a mathematical model called SIMILATION, which takes the hue and the brightness into account at the same time to calculate the color similarity in the RGB color space. After that, we combine the proposed methods of calculation of the image color components to form a color map. Furthermore, pixels are divided based on color map and the segmentation is completed. Besides, this paper also discuss its application in fire detection and propose a new method in identify fire in video based on these characteristics. First, analyze the characteristics of colors of the fire regions and extract the potential fire regions. Then, analyze its features such as fire flame color, spreading area, the similarity change, and fire smoke. They are very commonly observed in fire; so, that achieves automatic feature extraction. The results were accurate and can be used in real-time analysis. The experimental results show that the proposed method has better robustness for the brightness variations and lower computational complexity in real-time systems. However, there is a lack in this algorithm; for instance, some section belonging to the background may be divided into the foreground region. Therefore, we should use other methods to deal with a certain type of video image for accurate segmentation.
In this paper, we have described the characteristics of thermal ink and fire, then do some experiments. Although the real-time system has not been coming out, we can use thermal ink characteristics and image processing technology to identify the temperature by the method in this paper and use fire characteristics and video processing technology to identify the fire. It can be applied in food temperature control and tag identification, fire detection, and identification system, etc.
References
NR Pal, SK Pal, A review on image segmentation techniques. Pattern Recog. 26(9), 1277–1294 (1993).
VA Shapiro, PK Veleva, VS Sgurev, in Proceedings., 11th IAPR International Conference on Pattern Recognition. Vol. III. Conference C: Image, Speech and Signal Analysis. An adaptive method for image thresholding. (IEEEThe Hague, 1992), pp. 696–699.
QT Luong, in eds. by, CH Chen, LF Pau, PS Wang, Color in Computer Vision (World Scientific, Singapore, 1993).
A Trémeau, S Tominaga, K Plataniotis, Color in image and video processing: most recent trends and future research directions. EURASIP J. Image Video Process. 2008(1), 581371 (2008).
K Lin, LJ Wu, LH Xu, A survey on color image segmentation techniques. J. Image Graph.10:, 1–10 (2005).
A Mishra, Y Aloimonos, Active segmentation. Int. J. HR.6(3), 361–386 (2009).
CH Lin, CC Chen, Image segmentation based on edge detection and region growing for thinprep-cervical smear. Int. J. Pattern Recognit. Artif. Intell.24(7), 1061–1089 (2010).
T Chaira, AK Ray, O Salvetti, in Proceedings of the Sixth International Conference on Advances in Pattern Recognition. Intuitionistic fuzzy c means clustering in medical image segmentation (Springer SingaporeKolkata, 2007), pp. 226–230.
S Jay, S Schmugge, MC Shin, in Proceedings of the 2004 IEEE Computer Society Conference on Computer Vision and Pattern Recognition. Effect of colorspace transformation, the illuminance component, and color modeling on skin detection (IEEEWashington, 2004), pp. 813–818.
DT Sang, DM Woo, DC Park, in Eds. by, J Lei, FL Wang, H Deng, D Miao, Color Image Segmentation Using Centroid Neural Network (Springer, Germany, 2012).
JW Oestreich, WK Tolley, DA Rice, The development of a color sensor system to measure mineral compositions. Miner. Eng.8:, 31–39 (1995).
Z Liu, Research development of color sensor technique. J. Transducer Technol.22:, 1–4 (2003).
X Lu, Y Xu, Y Li, M Lu, Development of a new double-path color sensor based on TCS230. Appl. Electron. Tech.8:, 89–91 (2007).
M Mignotte, Segmentation by fusion of histogram-based k-means clusters in different color spaces. IEEE Trans. Image Process.17:, 780–787 (2008).
S Li, J Xu, J Ren, T Xu, A Color Image Segmentation Algorithm by Integrating Watershed with Region Merging (Springer, Germany, 2012).
C Zheng, A novel license plate location method on rgb color space. journal of image and graphics. J. Image Graph.11:, 1623–1628 (2010).
M Chapron, in Proceedings of 11th IAPR International Conference on Pattern Recognition. A new chromatic edge detector used for color image segmentation (IEEELos Alamitos, 1992), pp. 311–314.
X Cheng, Y Quan, Color image background difference based on his model. J. Comput. Appl.S1:, 231–232235 (2009).
H Li, Z Liu, S Zhan, A segmentation method of color texture image. Chin. J. Comput.9:, 965–971 (2001).
B Gary, The opencv library. Dr. Dobb’s J. Softw. Tools Prof. Programmer. 25:, 120–123 (2000).
K Pulli, A Baksheev, K Kornyakov, K Kornyakov, V Eruhimov, Real-time computer vision with opencv. Commun. ACM. 55:, 61–69 (2012).
W Phillips, M Shah, N Da Vitoria Lobo, Flame recognition in video. Pattern Recogn. Lett.23:, 319–327 (2002).
G Qiu, S Liu, D Cao, J Bao, Flame recognition based on video image. Appl. Mech. Mater.687-691:, 3604–3607 (2014).
Y Yao, R Chellappa, Tracking a dynamic set of feature points. IEEE Trans. Image Process.4:, 1382–1395 (1995).
Z Lei, W Chou, J zhong, CH Lee, in Proceedings of 2000 IEEE International Conference on Multimedia and Expo. Video segmentation using spatial and temporal statistical analysis method (IEEENew York, 2000), pp. 1527–1530.
J Chen, G Zhao, M Salo, E Rahtu, M Pietikainen, Automatic dynamic texture segmentation using local descriptors and optical flow. IEEE Trans. Image Process.22:, 326–339 (2012).
OJ Tobias, R Seara, Image segmentation by histogram threshing using fuzzy sets. IEEE Trans. Image Process.11:, 1457–1465 (2002).
Z Huang, G Sun, F Li, Traffic sign segment based on RGB vision model. Microelectron. Comput.10:, 147–148152 (2004).
SD Buluswar, BA Draper, Color machine vision for autonomous vehicles. Eng. Appl. Artif. Intell.11:, 245–256 (1998).
H Stiebig, D Knipp, P Hapke, F Finger, Three color piiin-detector using microcrystalline silicon. J. Non-Cryst. Solids.227-230:, 1330–1334 (1998).
S Tang, Colorimetry (Beijing Institute of Technology Press, Beijing, 1990).
J Zheng, C Hao, F Lei, Y Fan, Automatic illuminations detection and color correction of image using chromatic histogram characters. J. Image Graph.9:, 1001–1007 (2003).
Z Li, Color reconstruction theory and practice in color image. Master’s thesis, Wuhan University, Wuhan, China (2005).
F Gasparini, R Schettini, in Proceedings of 12th International Conference on Image Analysis and Processing. Color correction for digital photographs (IEEEMantova, 2003), pp. 646–651.
F Gasparini, R Schettini, Color balancing of digital photos using simple image statistics. Pattern Recognit.37:, 1201–1217 (2004).
A Luz, T Mendez, G Dudek, in Energy Minimization Methods in Computer Vision and Pattern Recognition, ed. by A Rangarajan, B Vemuri, and AL Yuille. Color correction of underwater images for aquatic robot inspection eds. by (SpringerBerlin, 2005), pp. 60–73.
C Doutre, P Nasiopoulos, Color correction preprocessing for multiview video coding. IEEE Trans. Circ. Syst. Video Technol.19(9), 1400–1406 (2009).
A Rizzi, C Gatta, D Marini, A new algorithm for unsupervised global and local color correction. Pattern Recogn. Lett.24(11), 1663–1677 (2003).
I Yoon, S Kim, D Kim, MH Hayes, J Paik, Adaptive defogging with color correction in the HSV color space for consumer surveillance system. IEEE Trans. Consum. Electron.58(1), 111–116 (2012).
S Wang, in Proceedings of 2009 International Conference on Computational Intelligence and Software Engineering. Color image segmentation based on color similarity. (IEEEWuhan, 2009), pp. 1–4.
H Gong, L Hao, Robert edge detection algorithm based on GPU. J. Chem. Pharm. Res.6:, 1308–1314 (2014).
Acknowledgements
The authors would like to appreciate all anonymous reviewers for their insightful comments and constructive suggestions to polish this paper in high quality. This research was supported by Shanghai Universities Distinguished Professor Foundation (Eastern scholar) in 2014 with Project number 10-15-302-014 and the Youth Science Foundation of Jiangxi Province: Dependable and Automatic Resource Management Research in Cloud computing Networks (ID: 20122BAB211022).
Abbreviations
Not applicable.
Funding
Not applicable.
Availability of data and materials
Not applicable.
Author information
Authors and Affiliations
Contributions
For this article with several authors, CW and NX conceived and designed the experiments and the theory analysis. YS performed the experiments. KY analyzed the data. CL contributed reagents, materials, and analysis tools. NX wrote the paper. All authors agree with the above contribution details. All authors read and approved the final manuscript.
Corresponding author
Ethics declarations
Ethics approval and consent to participate
Not applicable.
Consent for publication
Not applicable.
Competing interests
The authors declare that they have no competing interests.
Publisher’s Note
Springer Nature remains neutral with regard to jurisdictional claims in published maps and institutional affiliations.
Rights and permissions
Open Access This article is distributed under the terms of the Creative Commons Attribution 4.0 International License (http://creativecommons.org/licenses/by/4.0/), which permits unrestricted use, distribution, and reproduction in any medium, provided you give appropriate credit to the original author(s) and the source, provide a link to the Creative Commons license, and indicate if changes were made.
About this article

Cite this article
Xiong, N., Shen, Y., Yang, K. et al. Color sensors and their applications based on real-time color image segmentation for cyber physical systems. J Image Video Proc. 2018, 23 (2018). https://doi.org/10.1186/s13640-018-0258-x
Received:
Accepted:
Published:
DOI: https://doi.org/10.1186/s13640-018-0258-x