
Abstract
In cognitive radar network, a parallel algorithm can allocate idle spectrum to cognitive radars, but it often ignores the user’s requirement. According to the graph theory, the topology of the network is divided into two different groups. In the process of distributing spectrum, each group summarizes the distributed information after completing a distribution. When a user’s demand is satisfied, every group is informed to not allocate the spectrum for the user anymore and deletes it from the topology at the same time. As a result, by deleting the node which the user’s requirement has already been met, the other nodes which are interfered with the node on the same channel can participate into spectrum allocation. The improved algorithm can ensure high spectrum utilization taking a little time that is spent on the spectrum allocation. The simulation result shows that the spectrum utilization of the improved algorithm is higher than that of the traditional parallel algorithm, and the user’s satisfaction increases greatly. Therefore, this paper aims to attempt to explore an improved parallel algorithm to resolve the problem by considering user’s requirement.
1 Introduction
With increasing application of spectrum, it is becoming more and more scare [1]. Radar/communications sharing has been a recurring topic herein. The growing demand for ‘beachfront’ mobile spectrum to assure economic growth and provide for key wireless public safety systems require a reexamination of the large exclusive allocation for ‘radiolocation’ - radar in spectrum policy jargon.
Traditionally, radars were given large exclusive bands as primary allocations and the owner of the radar was able to make design tradeoffs between system cost/complexity and the amount of spectrum utilization they achieved. Since spectrum was a free cost to the designer there were few incentives to minimize spectrum footprint. However, with the growing interests on radar networks [2,3], spectrum allocation in radar network needs to be explored. However, the fixed spectrum management which allocates certain spectrum to the user leads to the low spectrum utilization rate. As a new kind of intelligent spectrum sharing technology, cognitive radar has emerged recently. In cognitive radar networks, spectrum allocation can be established based on the spectrum detection.
At present, there are three main spectrum allocation models for cognitive radar, including graph coloring model, game theory model, and auction bidding model, which could benefit our approach on radar network spectrum allocations. Among them, graph coloring model is commonly used. Based on graph coloring model, a lot of spectrum allocation algorithms have been studied. However, list coloring algorithm [1] does not distinguish the different channels. Coloring sensitive graph algorithm (hereafter referred to CSGC) [4,5] not only overcomes this weakness by checking the channel condition, but also puts forward several different label rules based on different target function. Nevertheless, the CSGC also has drawbacks that only one spectrum can be allocated in single distribution cycle. A parallel spectrum allocation algorithm distributes many spectrums in single distribution cycle improving the spectrum efficiency. Literature [2] and [3] refer to the parallel algorithm as well. In order to get higher channel multiplexing rate, the literature [6] improved the parallel algorithm which make other users share the same channel with the user that have the largest label. But neither these two algorithms consider the user’s requirement, which leads to the waste of spectrum. To enhance the spectrum utilization ratio, aggregation distribution algorithm aggregates small spectrum fragment into a larger one [7-9]. The algorithm allocates the spectrum to users according to their demands, and considers the limitation of hardware equipment. Compared with the traditional way of continuous spectrum allocation, it significantly improves the spectrum utilization, but it is no doubt that the time is obviously increased. Bipartite matching [10] can also be used to distribute spectrum, but it is very complex. In order to increase the channel utilization, the literature [11] improves the CSGC in terms of user’s priority. According to historical assignment information, literature [12] improves the CSGC, which can effectively avoid some users occupy certain spectrum exclusively. But the time that spends on allocation is not reduced yet. By using the SNR threshold and deleting the users whose requirement is wider than its available channel, power control is applied into the spectrum allocation [13-15]. The previous literature only consider one objective function, but the literature [16] proposes a new method that can consider both utilization and fairness of the network simultaneously through setting weight of network reward and fairness. The method solves the multiple functions problem in cognitive radar spectrum allocation. Chemical reaction [17] is also employed into spectrum allocation, but neither of them is simple. From the analysis above, we could see that the parallel algorithm has advantage of spending shorter time and the algorithm based on user’s demand is able to greatly improve the utilization. In order to combine both advantages, the paper explores improved the parallel algorithm based on the user’s requirement for radar networks.
2 Related content
2.1 Parallel algorithm
The parallel algorithm [6] is also called grouping algorithm. It divides the topology into many sub graphs, and then colors the sub graphs. Assume that all spectrums are orthogonal to each other. That is to say, coloring for a sub graph does not affect the others, and updating the topology does not influence others too. So, it can get the same allocation as the serial algorithm. To sum up, parallel algorithm is a good way to reduce the time of allocation because of coloring many sub graphs.
2.2 The algorithm of user’s requirement
Variety of algorithms based on graph coloring model involves the factor of user’s demand [8,9]. It is a kind of method that takes the user’s demand for spectrum into consideration in the distribution of spectrum. When the user’s requirement is met, the allocation of spectrum will stop offering to the user. This method not only can greatly improve the user satisfaction, but also can avoid spectrum is exclusively occupied by a certain user.
2.3 Label rule
The Label rule is firstly introduced by the CSGC algorithm [4], and it is proposed based on above graph-coloring algorithm whose main idea is considering the SINR of different users on every channel. The better the channel condition is, the greater the weight of channel will be. Every time channel with the greatest weight will be allocated to a corresponding user to maximize the system benefits. In order to achieve different target functions, the algorithm uses different label rules to meet the needs of the target function. When the goal maximizes the spectrum utilization in a collaborative mode, the label rule can be expressed as following:
In the two equations above, R i,j represents the number of node which can’t be shared channel j with user i. \( \raisebox{1ex}{$b\mathrm{i},\mathrm{j}$}\!\left/ \!\raisebox{-1ex}{$\left(R\mathrm{i},\mathrm{j}+1\right)$}\right. \) represents the benefit that the user i bring to the system. l i represents the number of available spectrum of user i.
2.4 Allocation model
We assume that the idle spectrum have been detected by some way. Then the graph coloring is used to establish the model to solve the spectrum allocation problem. According to the graph theory, spectrum allocation problem can be viewed as graph coloring problem by painting each secondary user into a vertex and each channel into a color. When we allocate channel m to user n, it is just similar to assign color m to vertex n. Then the spectrum allocation problem can be described by different matrices, which are listed in the following paragraph.
Available channel \( \mathrm{L}=\left\{\mathsf{l}\mathrm{i},\mathrm{j}\right\}\mathsf{N}\times \mathsf{M} \). It is a matrix of N by M. N represents the number of secondary users, and M represents the numbers of spectrum. \( \mathit{\mathsf{l}}\mathsf{i},\mathsf{j} \) consists of bandwidth of spectrum. If \( \mathit{\mathsf{l}}\mathsf{i},\mathsf{j} \) is nonzero, it shows that the spectrum j is available to the user i. Otherwise, it means the channel j to the user i is not available.
Benefit \( B=\left\{b\mathrm{i},\mathrm{j}=\left\{0,1\right\}\right\}\mathit{\mathsf{N}}\times \mathit{\mathsf{M}} \). The matrix represents the benefit to system which secondary user n applies the channel j.
Demand is the matrix 1 by N, indicating the need of spectrum for each user. It takes megahertz as its unit.
Interference constraint \( =\left\{c\mathrm{i},\mathrm{k},\mathrm{m}=\left\{0,1\right\}\right\}\mathit{\mathsf{N}}\times \mathit{\mathsf{N}}\times \mathit{\mathsf{M}} \). The matrix is a three-dimensional matrix, and it represents the number of interferences that are caused by secondary user i sharing the same channel m with secondary k.
Allocation \( =\left\{\mathsf{a}\mathrm{i},\mathrm{j}=\left\{0,1\right\}\right\}\mathit{\mathsf{N}}\times \mathit{\mathsf{M}} \). If \( \mathsf{a}\mathrm{i},\mathrm{j}=1 \), it shows that the spectrum j is assigned to the user i.
The degree of interference \( ={\displaystyle \sum_{\mathsf{k}=1,\mathsf{k}\ne \mathsf{i}}^{\mathsf{N}}}\mathsf{c}\mathrm{i},\mathrm{k},\mathrm{j} \). It represents the number of nodes which can’t be shared channel j with user i.
In order to ensure that all users to make full use of the allocated spectrum, the distribution of spectrum should satisfy the following requirements:
1. Any user won’t be able to communicate properly unless its requirement is met.
2. Due to the guard bandwidth between spectrums is very thin, it can be neglected.
3. The algorithm improves spectrum efficiency and fairness. As for the drawbacks of the parallel algorithm, it does not improve.
3 Improved parallel algorithm based on user’s requirement
3.1 Algorithm principle
Assume that a cognitive radar network is composed of N1 primary users and N2 secondary users in the area of d×d. The whole available spectrum can be divided into m different channels which are orthogonal to each other. Each cognitive user can detect the available spectrum. The idle spectrum detection, spectrum allocation, and data transmission form one distribution cycle. In a cycle, we assume that the location of user and the available spectrum are fixed. The primary user (PU) or the secondary user (SU) has a transmission radius respectively in each channel. Only when the SU’s transmission radius is not covered by the PU’s, the SU can share the PU’s spectrum.
In the study of graph coloring model, the topology is composed of vertexes and edges. Every vertex represents a cognitive radar user. What’s more, it is associated with an available channel list, which is determined by the location of a user. Take Figure 1 as an example, among which P represents PU, S represents SU, and Ch represents channel. Set the number of primary user N1 as 4, the number of secondary user N2 is 4, and the available channel number Ch is 3. According to the graph theory, spectrum allocation problem can be regarded as graph coloring problem by painting each secondary user into certain vertex and each channel into a color. When channel m is allocated to user n, it is just similar to assign color m to vertex n. The details are expressed in Figure 2. Then the previous matrices can be used in part 2 to describe distribution of process.

A network of cognitive radar. It is a distribution of different users in practical scenario. PU has authored channel, but SU does not have. SU only can use the idle channel and that do not cause any interference to PU.

Topology of cognitive radar. According to the graph theory, user can be shown by node, and the constraint between them can be shown by edge. Then the topology is obtained, which consist of edges and nodes.
The process of grouping algorithm is as follows:
-
1.
Delete these nodes whose demand is larger than that of total number of available spectrum from topology. For one thing, even if all available spectrums are allocated to it, the user’s demand will still not satisfied either. For the other thing, other nodes that interfere with this node on the channel could obtain the spectrum by deleting this node.
-
2.
Divide the available topology applying user grouping and frequency grouping respectively. In frequency grouping, the topology can be divided according to the number of available spectrum. That is to say, if a topology consists of M available spectrum, it can be divided into M groups. According to Equation 4 and 5, we can calculate the values of Label and corresponding Color in each group. Select the maximum value of Label, and allocate the corresponding Color to it (If there are two or more largest Labels, we choose one randomly). Delete other nodes that can’t simultaneously use the spectrum with it in the topology of the group. Besides, user grouping is another matter. The topology can be divided according to the number of users. Select the maximum Label that corresponds to the spectrum according to Equation 4 in each group. If there are same spectrums, and two or more users interfere with each other on the spectrum, the spectrum is assigned to the largest value of Label. And the other Labels correspond to the other users cannot take part in allocating spectrum in the current cycle. If there is no same spectrum, directly allocate spectrum to the user who has the largest value of Label.
-
3.
Each group summarizes the distributed information after completing one allocation. Then the node is deleted from each sub topology. Because it can not only avoid wasting the spectrum resource, but also can enhance the fairness. Figure 3 is an example. Assume that the Figure3 (A) is an initial topology and the node 3 has got enough spectrums. If the improved parallel algorithm is applied based on user’s requirement, then the node 3 is removed from topology of this group. As is shown in Figure (B). The nodes 1 and 5 may participate into the allocation of the spectrum after that. In other words, it enhances the probability of more users to use the channel.
Figure 3 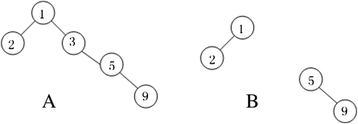
An illustration of the fairness. It is one of sub topologies. Compared with the traditional parallel algorithm, the improved method enhances the fairness of different secondary users to use the channel. Figure 3 is an example. Assume that the Figure3 (A) is an initial topology and the node 3 has got enough spectrums. If the improved parallel algorithm is applied based on user’s requirement, then the node 3 is removed from topology of this group. As is shown in Figure (B).
-
4.
The program terminates, when there is no available spectrum or all users’ requirements have been met.

The procedure of the algorithm can be summarized as algorithm 1 and algorithm 2.


3.2 Objective function and labeling standards
Our objective function maximums the system spectrum utilization. In order to enhance the spectrum utilization, the assigned spectrum should be ensured to be larger than the users’ requirement. Otherwise, the spectrum will not be allocated to the user, and be deleted from the topology. In this way, the objective function can be expressed as following:
In the equation above, \( \gamma i=\frac{Demandi}{{\displaystyle \sum_{i=1}^NTi}}<=1, \) and \( {\displaystyle \sum_{i=1}^NTi} \) indicates the total bandwidth of available spectrum for user i. We take the MHz as its unit. In order to make sure of the γi ≤ 1, the Node whose Demand is larger than \( {\displaystyle \sum_{i=1}^NTi} \) is deleted from the topology. After deleted, the node would not take part in allocation. So deleting a node does not affect the value of ai, j and objective function f. When the function is used during allocating spectrum, the labeling method (Collaborative-Max-Proportional-Fair) will be introduced. As a result, the labeling standards change as follows:
3.3 The time for parallel algorithm based on user’s requirement
List coloring spectrum allocation algorithm and CSGC spectrum allocation algorithm are both based on the cognitive radar network topology of the static spectrum allocation. That is to say, topology of cognitive radar network always does not change. If there is a new node to get into the radar network, cognitive radar will rebuild topology. This process needs more time.
As the network the cognitive users and available channel increases, the time of list coloring algorithm and CSGC algorithm increases as well. It can be measured according to Equation (6):
In Equation 6, an, m represents the allocation matrix. The traditional parallel algorithm of spectrum allocation reduces the time of CSGC spectrum allocation algorithm. The detailed calculation of the time is listed as followed:
The time cost of the improved parallel algorithm is little longer than that of the traditional one. The time of frequency grouping is shown as Equation 8:
In the Equation 8, λj represents the number of allocation of each group, which is determined by the matrix of Available Channel. The allocation is carried on until the matrix Available Channel of each group is equal to zero. As the number of allocation in each group may not equal, \( \underset{1\le j\le M}{ \max}\left(\lambda \mathrm{j}\right) \) represents the max number of allocation of groups. treport represents the time that each group spend to report their distribution to the cognitive base station(CBS) in order to judge whether the node has already reached the users’ requirements. Just because of it, the time cost of the improved parallel algorithm is little longer than that of the traditional one.
The time of user’s grouping is listed as Equation 9:
In the equation above, ηi represents the number of allocation in each user grouping. The allocation is carried on, until the matrix of Available Channel of each group is zero. Similarly, for the number of allocation is not equal in each group, \( \underset{1\le i\le N}{ \max}\left(\eta \mathrm{i}\right) \) represents the max number of allocation in each group.
4 Simulation and analysis
4.1 Simulation conditions
Assume that PU and SU are distributed in region of 1,000 × 1,000 randomly. Each user can use anyone of M channels. The bandwidth of available channel generates randomly from 1 to 3 MHz in TV spectrum. The demand of user i (Di) is an integer and is produced randomly. Di ∈ [0, α Ti], in which α is defined as the requirement coefficient and α ∈ [1,3]. The parameters are shown in Table 1.
4.2 Results and analysis
Satisfaction is one of the factors to measure fairness. Spectrum utilization rate is an important factor weighing whether the method is good or not. The definition of satisfaction is as follows:
In Equation 10, Ni represents the number of nodes whose demand has been met, and N t represents the total number of bandwidth requirements of all users.
In the equation above, Nx represents the number of available spectrum, and Nn represents the number of total spectrum.
First, we change the number of available channels to compare the utilization of spectrum among the algorithms, which is shown in Figure 4. Since the traditional parallel algorithm does not consider the different requirements of bandwidths, it may still allocate channels to the SU according to the Label rule that is given in Equation 4, though the SU’s requirement has been satisfied. As a result, the total utilization rate is not very high. At the same time, those who have interference with the SU on the same channel cannot use the channel any more. This also decreases the total spectrum utilization. Even when available channels increases obviously, the traditional parallel’s total spectrum utilization has little change. However, the improved parallel algorithm would not allocate extra channel to the SU whose requirement is satisfied. Therefore, the improved method has higher utilization rate than the traditional parallel algorithm.

Utilization changes as available channels change. These four algorithms of allocation are compared. The four curves (red, green, yellow and black) indicate the utilization of spectrum changes as channels change. Among them, the red one is the improved frequency grouping method.
Then, compare is made on these four algorithms from the perspective of the satisfaction rate, and the SU’s demand is produced randomly, which is shown in Figure 5. When the demand coefficient is small, the user’s satisfaction ratio is higher than that of normal parallel algorithm. Because the improved algorithm not only takes the different requirements of the bandwidths of SU’s into account but also delete the users whose demands is much larger than the number of total available spectrum. Therefore, there are more users’ requirements are satisfied. But as the demand coefficient increases, there are fewer users’ needs can be satisfied, thus the satisfaction ratio gradually reduces. What ’s more, according to the Figure 5, besides the improved parallel algorithm, CSGC‐demand have high satisfaction. This is because it takes the user’s requirement as its priority. It gets high satisfaction, but with much longer time cost. To be clear, the following figures are one of a certain results in many executions instead of statistical data.

Satisfaction changes as Demand coefficients change. These four algorithms of allocation are compared. The four curves (red, yellow, blue, and black) indicate the satisfaction as changes over demand coefficient. Among them, the black one is user grouping method.
In order to compare the satisfaction rate of algorithms clearly, we assume that the Demand matrix is fixed as [4, 2, 1, 4, 3, 5, 6, 3, 1, 7, 2, 8, 4, 1 ,6, 4, 4, 7, 6, 4] and frequency matrix is generated from [1, 3] randomly, which is shown in Figure 6. The result shows that satisfaction rate of the improved parallel algorithm tends to 1. However, the satisfaction rate of other algorithms that is not based on user’s demand fluctuates greatly.

Satisfaction changes as number of channel change when the Demand matrix is fixed. These four algorithms of allocation are compared. The four curves (red, green, purple, and blue) indicate the satisfaction of spectrum as channels changes. Among them, the green one is the improved frequency grouping method.
Next, we pay attention to the time of all algorithms. As is depicted in Figure 7, the improved grouping algorithm spends much shorter time than the CSGC algorithm on spectrum allocation. This is because the improved algorithm allocates many spectrums to many users simultaneously. Compared with traditional parallel algorithm, the improved algorithm spends much longer time on allocating spectrum because of summarizing allocated information in each cycle to CBS.

The cost of time changes as available channels. The time of six algorithms are compared with each other. Among them, the blue and purple curves represent the two algorithms of the two grouping improved algorithms.
Above all, figures shows that the spectrum utilization of the improved algorithm is higher than the traditional parallel algorithm, and the user’s satisfaction increases greatly, but the time cost of it is a little longer than others.
5 Conclusions
This paper explores an improved parallel algorithm based on user’s requirement of spectrum. Two different methods are used to illustrate the improved parallel algorithm. Finally, we could safely draw the conclusion that the improved algorithm not only has much higher spectrum utilization rate, but also improves the fairness and customer’s satisfaction with a little spending of time. However, compared with the traditional parallel algorithm, the improved parallel algorithm is a little more complex.
References
W Wang, X Liu, List coloring based channel allocation for open spectrum wireless networks, in IEEE 62nd Vehicular Technology Conference (Dallas, TX, USA, 2005)
L Qilian, Radar sensor wireless channel modeling in foliage environment: UWB versus narrowband. IEEE Sensors Journal. 1448–1457 (2011). doi:10.1109/JSEN.2010.2097586
L Jing, L Qilian, Design and analysis of distributed radar sensor networks. IEEE Trans on Parallel and Distributed Processing. 1926–1933 (2011). doi:10.1109/TPDS.2011.45
H Zheng, C Peng, Collaboration and Fairness in Opportunistic Spectrum Access, in the 2005 IEEE International Conference on Communications (Seoul, Korea, 2005)
C Peng, H Zheng, B Zhao, Utilization and fairness in spectrum assignment for opportunistic spectrum access. Mobile Netw. Appl. 555–576 (2006). doi:10.1007/s11036-006-7322-y
Y Liu, M Jiang, X Tan, Time Overhead and Fairness in Spectrum Allocation for Cognitive Radio, in 2011 the 6th International ICST Conference on Communications and Networking in China (Harbin, China, 2011)
JD Poston, WD Horne, Discontinuous OFDM considerations for dynamic spectrum access in Idle TV Channels, in the 1rd IEEE International Symposium on New Frontiers in Dynamic Spectrum Access Networks (Baltimore, MD, USA, 2005)
H Lee, S Vahid, K Moessner, A Survey of Radio Resource Management for Spectrum Aggregation in LTE- Advanced, IEEE Communications Surveys & utorials, 2013, pp. 745–760. doi:10.1109/SURV.2013.101813. 00275
F Sheng, L Ma, X Tan, C Yin, Y Yu, Spectrum Allocation Algorithm Aware Spectrum Aggregation in Cognitive Radio Networks, in 2013 the Third International Conference on Instrumentation, Measurement, Computer, Communication and Control (Shenyang, China, 2013)
C Zhao, M Zou, B Shen, B Kim, K Kwak, Cooperative spectrum allocation in centralized cognitive networks using bipartite matching, in the IEEE Global Telecommunications Conference (New Orleans, LO, USA, 2008)
S Zhang, P Ren, C Zhang, in Software Engineering and Knowledge Engineering: Theory and Practice, ed. by W Yanwen (Springer, Berlin Heidelberg, 2012), p. 1017
L Yang, X Xie, Y Zheng, A Historical-information-based algorithm in dynamic spectrum allocation, in the IEEE International Conference on Communication Software and Networks (Macau, China, 2009)
Y Wang, Z Wei, H Du, L Sang, D Yang, A spectrum allocation algorithm based on bandwidth matching and interference avoidance in cognitive radio networks, in the IEEE 23rd International Symposium on Personal Indoor and Mobile Radio Communications (Sydney, Australia, 2012)
C Wang, X Hong, H Chen, J Thompson, On capacity of cognitive radio networks with average interference power constraints, in IEEE Transactions on Wireless Communications, 2009, pp. 1620–1625. doi:10.1109/ TWC.2009.071075
A Hoang, Y Liang, Maximizing spectrum utilization of cognitive radio networks using channel allocation and power control, in the IEEE 64th Vehicular Technology Conference (Montréal, Québec, Canada, 2006)
H Gao, J Cao, Non-dominated sorting quantum particle swarm optimization and its application in cognitive radio spectrum allocation. Journal of Central South University. 1878–1888 (2013). doi:10.1007/s11771-013-1686–5
AYS Lam, VOK Li, Chemical reaction optimization for cognitive radar spectrum allocation, in the IEEE Global Telecommunications Conference (Miami, Florida, USA, 2010)
Acknowledgements
Shubin Wang (wangshubin@imu.edu.cn) is the correspondent author and this work was supported by the National Natural Science Foundation of China (61261020), and the Natural Science Foundation of Inner Mongolia, China (2012MS0903), and PetroChina Innovation Foundation (2014D-5006-0603), and the Scientific Research Initial Fund for Higher Talents Program of Inner Mongolia University, China.
Author information
Authors and Affiliations
Corresponding author
Additional information
Competing interests
The authors declare that they have no competing interests.
Rights and permissions
Open Access This article is licensed under a Creative Commons Attribution 4.0 International License, which permits use, sharing, adaptation, distribution and reproduction in any medium or format, as long as you give appropriate credit to the original author(s) and the source, provide a link to the Creative Commons licence, and indicate if changes were made.
The images or other third party material in this article are included in the article’s Creative Commons licence, unless indicated otherwise in a credit line to the material. If material is not included in the article’s Creative Commons licence and your intended use is not permitted by statutory regulation or exceeds the permitted use, you will need to obtain permission directly from the copyright holder.
To view a copy of this licence, visit https://creativecommons.org/licenses/by/4.0/.
About this article

Cite this article
Yan, B., Wang, S. & Bao, Y. Research on an improved parallel algorithm based on user’s requirement in cognitive radar network. J Wireless Com Network 2015, 47 (2015). https://doi.org/10.1186/s13638-015-0285-6
Received:
Accepted:
Published:
DOI: https://doi.org/10.1186/s13638-015-0285-6