
Abstract
Objective
Vitamin D and C levels have inverse relation with the metabolic syndrome components and they are used as antioxidant supplements during enduring metabolic activities. In the present study, we hypothesized that the intake of vitamin D and/or C with endurance physical activity might reduce the risk of metabolic syndrome.
Methods
A randomized control study recruited 180 participants of both genders, aged between 30 and 50 years. The participants were assigned into six groups receiving different doses of vitamin D or vitamin C with or without physical activities. Data were collected over a period of 3 months, and the results were analyzed using SPSS version 20.
Results
Variations in the effect of the supplements on various body variables including: Fasting plasma glucose, total cholesterol, low-density lipoprotein cholesterol and blood pressure, showed that vitamin D has more influence compared to vitamin C. However, vitamin D and C supplements do not have any effect on weight when consumers are undergoing endurance physical exercise. But vitamin C consumer group has more effect in waist circumference, triglyceride, and high-density lipoprotein, as compared to vitamin D consumer group.
Conclusion
We conclude that, consumption of vitamin D or vitamin C supplements may improves the life of metabolic syndrome patients. However, the combination of physical activities and vitamin supplements maximize the effect, and this combination should be recommended.
Trial registration WHO-ICTRP IRCT20161110030823N2. Registered 01 February 2018. http://apps.who.int/trialsearch/Trial2.aspx?TrialID=IRCT20161110030823N2
Background
Metabolic syndrome (MetS) is a constellation of abnormal cardio metabolic factors that increase risk of cardiovascular disease (CVD) and type 2 diabetes mellitus [1]. MetS is a major health problem worldwide; based on the International Diabetes Federation (IDF) appreciation about one quarter of the world’s adult population have MetS [1]. MetS is among dangerous syndromes, which increases the danger of being overtaken by various diseases including CVD, diabetes, dyslipidemia, stroke, osteoarthritis, some type of cancers and mortality [2]. MetS imposes heavy expenses to sanitary therapeutic system and it generally reduces life quality [3]. In fact, insulin resistance and central obesity are considered the main causes of MetS [1,2,3]. In addition, its appear that demographic, lifestyle, and social factors are affecting MetS [2]. Indeed, it has been reported that cigarette consumption and high body mass view are among independent and amendable risk factors for MetS [2]. Nowadays, recognition of considerable challenges related to obesity and its therapeutic solutions all over the lifetime have resulted in great efforts spent toward obesity inhibition [4]. Furthermore, doing regular athletic activities and consuming the antioxidants are among the advised solutions, which are not only affecting the total safety of body, but also affect brain performance [2]. Some of previous studies have reported that people who experience delayed performance physically showed improvement with supervised physical fitness exercises, and the health of people suffering from metabolic diseases improved with an increase in antioxidant intake into their system [4, 5]. Antioxidant supplementations especially vitamin C relieve the body off the stress associated with MetS and vitamin D increase the antioxidant capacity [4, 5]. Some of previous studies show a significant relationship between the amount of vitamin D intake and muscle fatigue; supplements are likely to improve the muscle fatigue through the biological roles that these nutrients play [6, 7]. A change in vitamin D from the normal range alters the muscle performance and activity significantly, especially when exercises of different intensities are involved [8,9,10,11]. Elsewhere studies have reported a reduction of death with frequent intake of vitamin D as well as engaging in aerobic exercises [12,13,14,15,16]. Regarding the relation between serum level of vitamin D and MetS components, different studies have been accomplished in some of which this relation has been confirmed [17,18,19]. It has been shown that low level of serum vitamin D has inverse relation with weight gain, body mass index (BMI), but it does not have significant relation with other components of MetS [17]. Accumulating literature also link vitamin D studies with bones while comparing BMI and general weight gains [14,15,16]. On the other hand, vitamin C however, has completely different functions in an in vitro experiments and in humans [20,21,22]; some previous studies show that, the metabolism of glucose in the insulin resistant people was improved, and the blood pressure was lowered in patients who took vitamin C supplementation [23]. Furthermore, vitamin C and vitamin E supplementation are shown to prevent molecular regulators that trigger the sensitivity of insulin as well antioxidant defense mechanisms through physical activities [24]. Moreover, endurance exercises produce reactive nitrogen and oxygen through the mitochondria [25]. Physical exercises on a regular basis promote the health of the individuals and its play a vital role in treating MetS patients [26,27,28]. In conclusion, the prevalence of MetS is raising worldwide [1]. In addition, vitamin D and vitamin C levels have inverse relation with some of the MetS components such as (BMI, insulin resistant, and high blood pressure) [17, 23], and they are used as antioxidant supplements during enduring metabolic activities [4, 5]. Therefore, understanding the association between the effects of vitamin D and vitamin C supplementations with and without endurance physical activity (PA) on various components of MetS may be helpful in reducing MetS-related premature mortality and improve life quality among MetS patients. Our study was conducted to examine the effects of vitamin D and vitamin C supplementations with and without endurance PA on various components of MetS among MetS patients.
Methods
Research design and study population
The study design for this research is a randomized controlled trial (RCT) [29]. Based on the suggested formulas of this model, the study participants were recruited on the foundation of developed inclusion/exclusion criteria [30]. The subjects underwent a 12 weeks’ treatment program (01 March 2016 to 23 May 2016). Participants were randomly assigned into six Groups (Fig. 1): (1) Vitamin C group: who took only 500 mg/day vitamin C supplements [Morning Time]; (2) Vitamin C plus PA group either morning 7:30 A.M. or afternoon after 3:00 P.M.: who participated in 30 min/day of endurance PA and also took 500 mg/day vitamin C supplements. (3) Vitamin D group: who took only 2000 IU/day vitamin D supplements (Morning Time); (4) Vitamin D plus PA group either morning 7:30 P.M. or afternoon after 3:00 P.M.: those who participated in 30 min/day of endurance PA and also took 2000 IU/day vitamin D supplements. (5) Placebo group, who participated in 30 min/day of endurance PA and took a placebo, (6) final group; did not participate in 30 min/day of endurance PA, but took a placebo. Both vitamins and placebo were obtained from Osweh manufacture Iran-Tehran and was prepared to feature the same shape, odor and size of the supplements.
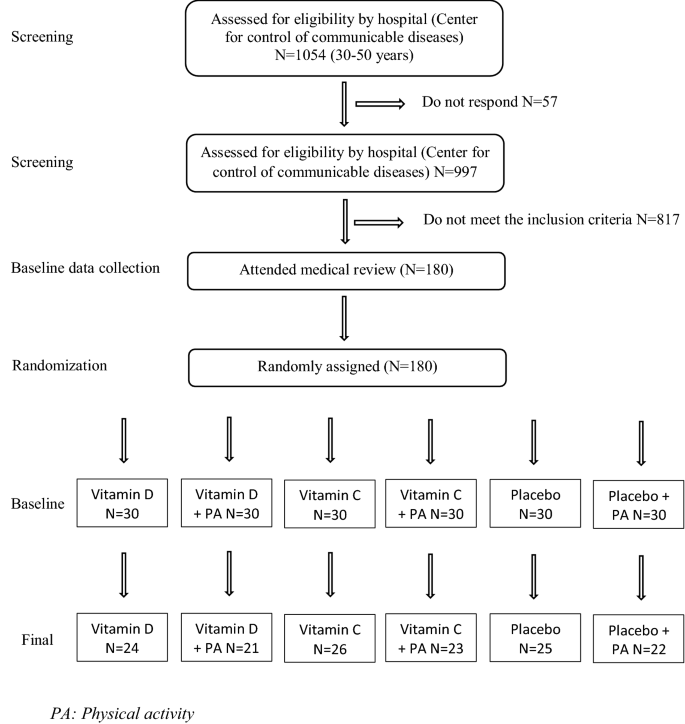
Flow chart for inclusion and exclusion in the study
Sample size and sample determination
In the present study, the sample size was calculated using a previously described formula for parallel clinical trials n = 2 [(z1 − α/2 + z1 − β) 2. s2]/d2 [31]. In this formula, n is number of participants in each group. For estimating sample size, we considered type one (α) and type two errors (β) of .05 and .20 (Power = 80%) respectively, and fasting plasma glucose levels as a key variable. Based on a previous study [31], standard deviation (SD) of plasma glucose levels was 8 mg/dL and the difference in mean (d) was considered to be 5 mg/dL. Where α = .95, β = 20%, study power = 80%, d = 5, and SD = 8.
We reached the sample size of 21 subjects for each group. In addition, to consider probable dropouts, 30 patients were included in each group. At the end, a total of 180 patients with MetS were included in the present study. Participants were distributed into six groups as shown in Fig. 1.
Inclusion and exclusion criteria
Eligibility criteria for participants having MetS, according to IDF definition [1] and the age between 30 and 50 years, both males and females. Individuals who took supplements containing vitamins D and C in the last 3 years were not included in this study. Individuals with type I and type II diabetes who were taking oral hypoglycemic agents or injecting insulin, or any medical therapy affecting the result, smokers, individuals with heart failure, and those who are suffering from renal problems, also individuals with malabsorption syndrome, pregnancy and lactating mothers were all excluded from the study. The exclusion list included patients with history of bariatric surgery and those who are currently using weight-loss medications as illustrated in (Fig. 1).
Data collection
Data collection was performed in the community health and control of communicable disease center. At baseline, standardized general questionnaires were completed for each subject [32]. Additional information regarding demographic, and medical history variables was obtained with an interview-based questionnaire. Past history and any previous treatment for certain disease including hypertension, diabetes, high cholesterol, supplement used, family history of obesity, family history of diabetes, family history of hypertension as well as PA patterns was also recorded.
Anthropometric measurements
Weight (kg) was measured while the subjects with minimal clothe without shoes using a digital scales and records to the nearest 100 g. Height (m) was measured in a standing position, without shoes, using a tape measure. BMI was calculated as weight in kilograms divided by height in meters squared [33]. Waist circumference (WC) was measured at the mid-way between the lower border of the ribs and the iliac crest with the subject in standing position. During the measurement process, it was critical to use the same technician for the purpose of error reduction.
Biochemical analysis
The participants were asked to produce a blood sample of 10 cc, which was collected from the participant at base line 0 and 12 weeks of the study. The blood was collected after overnight fasting for approximately 12 h. The blood samples were taken using the protocol outlined in [34]. Variables of concern in this test were the fasting plasma glucose (FPG) that were measured on the day of blood collection as outlined in [35]. The blood sample was investigated for FPG mg/dL, total cholesterol (TC) mg/dL, triglyceride (TG), low-density lipoprotein cholesterol (LDL-C) mg/dL, high-density lipoprotein cholesterol (HDL-C) mg/dL, vitamin D (ng/mL) and vitamin C (ng/mL).
Assessment of blood pressure
The systolic and diastolic blood pressure was taken from the left arm (mmHg) in the morning during each interview (From baseline and end of study) using the calibrated mercury sphygmomanometer [36]. Participants were seated after relaxing for at least fifteen minutes in a quiet environment, empty bladder. The average of the measurements was recorded.
Assessment of PA
Two times a week for climbing (around 2 h each time) and two times a week for running (around 1 h in the afternoon between 3 and 5 P.M.). Approximately 6 h per week all together [37].
Statistical analysis
We used Kolmogorov–Smirnov test to examine the normal distribution of variables. The analyses were done based on intention-to-treat approach. Baseline general characteristics among different groups were examined using one-way ANOVA for continuous variable and a Chi square test for categorical variables. To determine the effects of vitamin D and vitamin C supplementation and endurance PA on metabolic criteria, we used one-way ANOVA. We used Tukey’s post hoc comparisons to identify pairwise differences when we reached a significant finding in ANOVA. P < .05 was considered as statistically significant. All statistical analyses were done using SPSS version 20.
Results
In the present study, 180 patients with MetS were recruited: vitamin D (n = 30), “vitamin D plus 30 min/day PA” (n = 30), vitamin C (n = 30), “vitamin C plus 30 min/day PA” (n = 30), placebo (n = 30) and “placebo plus 30 min/day PA” (n = 30) groups. The study procedure and the flow chart for inclusion and exclusion in the study is shown in Fig. 1. In did, 39 participants excluded from the study because of the following reasons: Five became pregnant, nine did not follow recommended PA, seven had poor compliance to vitamin D supplements, 10 had poor vitamin C supplement, and 8 did not complete the trial. Finally, 141 subjects remained in the study. We included the data for all 141 participants in the baseline and final analysis. The characteristics of the study participants are presented in Table 1. The distribution of participants in terms of mean age among different study groups was not significant (P value > .05). The percentage of gender allocation, family history of obesity, family history of diabetes mellitus and family history of hypertension was not significantly different across the intervention groups (P value > .05 for all). These data suggest that the demographic information at baseline studies is evenly distributed. In addition, the results of the present study demonstrated that, baseline serum vitamin D and vitamin C levels showed no significant difference among groups (P value > .05). There were also no significant differences among the groups in terms of weight, BMI, WC, FPG, SBP, DBP and TC (P value > .05 for all). However, participants who received vitamin C supplements had higher serum levels of TG compared with those who received vitamin D plus PA, vitamin D plus PA and placebo or “placebo plus PA” (P < .001). Participants in the “vitamin D plus PA and placebo plus PA” groups had higher values of HDL-C compared with those in the other groups (P = .046). Furthermore, participants in the vitamin C group had lower levels of LDL-C compared with those in the “placebo plus PA” group (P = .007). Moreover, end of trial means of metabolic characteristic measures among study groups are shown in Table 2. We observed a significant increase in mean serum vitamin D concentrations, in participants who received vitamin D, (Vitamin D group from 10.8 ± 2.8 to 23.2 ± 4.9 ng/mL, or “vitamin D plus PA” from 10.4 ± 3.2 to 29 ± 5.5 ng/mL, P < .001 for all) and a significant increase in vitamin C supplementation also observed (Vitamin C group from .9 ± .4 to 1.4 ± .3 ng/mL or “vitamin C plus PA” from .8 ± .3 to 1.7 ± .3 ng/mL, P < .001 for all). There was also a significant increase in serum levels of vitamin D in those who received “placebo plus PA” (11 ± 4 vs. 18.9 ± 4.5 ng/mL at the end of the study, P < .001). No significant changes in serum levels of vitamin D and vitamin C were seen in participants in the placebo groups (P value > .05). End of trial supplementation did not significantly affect means of anthropometric measures and blood pressure among all groups (P value > .05). Whereas, One-way ANOVA of the end of study FPG showed significant difference between groups (P value < .05), and biochemical indicators across all study groups after intervention shows that, subjects in vitamin D group had lower serum levels of TC compared with the other groups (P < .001) and highest level of TC was observed in placebo group compared to other groups. In terms of TG, vitamin C intake resulted in higher serum levels of TG compared with the other groups (P < .001). Additionally, end of trial means of serum levels of LDL-C was significantly lower in the vitamin D group compared with all of other groups (P < .001). And the participants in vitamin C plus PA group had higher serum levels of HDL-C compared with other groups (P < .001). On the other hand, changes in metabolic criteria across study groups are presented in Table 3. There was a marginally significant difference in changes of BMI, WC, TC, TG, LDL-C, and HDL-C among all groups (P value < .05 for all). No significant changes in serum levels of FPG, SBP and DBP were seen among all groups (P value > .05 for all). Finally, multiple comparison of metabolic criteria across the study groups are presented in Table 4. According to multiple comparison using Tukey method across the study groups, the mean difference change of BMI only lowered in those who took vitamin D and did exercise compared with those who took vitamin D alone (− 1.4 ± .4, P = .029). However, the change was not significant compared to placebo. In addition, WC was significantly lowered in the vitamin C plus PA group compared to placebo (− 2.8 ± 1.0, P = .041) and vitamin D alone (− 4.2 ± 1.0, P < .001). Our results demonstrate that, taking vitamin C with exercise lowered WC to higher level comparing to those who took vitamin C alone (2.9 ± 1.0, P = .021). Taking placebo plus PA also lowered WC compared to vitamin D supplement alone (3.5 ± 1.0, P = .006). Besides, taking vitamin C and doing exercise remarkably lowered WC comparing to those who took vitamin D and exercised (3 ± 1.0, P = .041). Regarding change in lipid profiles a significant changes in serum levels of TC were seen following vitamin D or “vitamin D plus PA” than that in the placebo group (24 ± 8, P = .037; 24 ± 8.2, P = .050) respectively. Beside, either taking vitamin C and “vitamin C plus PA” both significantly lowered TG in comparison to placebo (33.5 ± 10.1, P = .027; 36.2 ± 11.1 P = .017). Interestingly, Table 4 showed that mean of HDL-C was higher in those who took vitamin C and doing PA compared to those vitamin D plus PA (16.2 ± 4.0, P = .002) and placebo plus PA (16.3 ± 4.0, P = .001). Vitamin C with exercise lowered HDL-C more in than taking vitamin C alone (14.2 ± 3.9, P = .005), Vitamin D alone (15.6 ± 3.9, P = .002) and vitamin D plus PA (16.2 ± 4.0, P = .002). Even so, only vitamin D supplement lowered LDL-C more in compared with vitamin C supplement groups (23.4 ± 8.2, P = .055).
Discussion
The results of this study show that the demographic characteristics of the participants do not differ significantly when comparing vitamin D to vitamin C treatment, suggesting that vitamin supplements may not have impact on demographic differences. However, elsewhere, studies indicate that vitamin supplements may have different functions in the body hence different age groups may have different needs for vitamin D supplement [38, 39]. The present study excluded participants who are likely having selected medical conditions hence agreeing with Gutierrez et al. [40] study who conducted vitamin D supplement intake among chronically ill patients and found that their vitamin supplement needs are different from healthy individuals. Our finding revealed that vitamin D and C supplements do not have any effect on weight when consumers are undergoing endurance physical exercise. The 12 weeks study did not report any difference in weight that is presumed vitamin D and C influence. Caan et al. [41] showed that vitamin D intake had a supplemental increase in postmenopausal weigh gain. Also, Zittermann et al. [42] showed that intake of vitamin D supplement enhances weight among cardiovascular risk patients. These two studies reported different results from the results of the present study. This may be due to the differences in the physical exercise variables used. In addition, previous studies focused more on supplemental intake of vitamin D as compared to the combination of vitamin C and D [43]. These studies also reported results from a specific population, which was excluded from the present study. Therefore, limited studies were found in the literature to evaluate the comparative effects of vitamin C and D supplement in weight loss and enduring physical exercise in MetS adult population in specific age group (30–50 years) as performed in this study. Furthermore, the current work found no significant interaction effect among participants taking vitamin D and C supplements with simultaneous exercise. However, interestingly, two statistical measures used in this study, one-way ANOVA and ANCOVA, showed different results. These differences were observed after baseline measure adjustment where ANCOVA demonstrated significant differences between BMI and the study vitamin supplement, similar finding was reported by Salehpour et al. [44], and Vimaleswaran et al. [45] reported a causal relationship between obesity and vitamin D, where they found a positive directional relationship between BMI and vitamin D. In our study, vitamin D may be responsible for the changes in BMI shown with ANCOVA analysis. This finding is in agreement with the result obtained by Amrein et al. [46].
Regarding, the changes in WC did not show any significant interaction among the study participants with vitamin D and C. The WC and BMI have been often studied together [47]. In line to our findings, a study performed by Du et al. [48] suggested that WC depends on high weight and individuals with low weight would not show any changes in their WC. Elsewhere, it has been reported that daily vitamin D supplementation (1000 IU) in overweight and obese women shows significant reduction in body fat mass with no effect on WC [44]. Overall, it appears that taking vitamin D alone do not have a significant effect on weight, but when it is combined with endurance PA, it may affect. However, further studies are required to fully observe this aspect. Furthermore, vitamin D supplement and its derivatives have widely been studied due to their connection with CVD [49]. Our results show that there is a significant difference in SBP among individuals who took vitamin D and did the exercise, while no significant interaction for vitamin C was recorded. This might due to the fact that vitamin D supplement aid in relieving blood pressure [50, 51]. However, study reported the audiometric outcomes of the use of vitamin D, suggested that the association of vitamin D and cardio related activities is uncertain; hence no clinical significance can be drawn [52]. In the present study, changes in the FPG did not have any significant interaction effects with vitamin D or C during exercise. Dakhale et al. [53] show that the FPG level for normal individuals should remain less than 250 mg/dL. Moreover, in this study, there was no significant effects on cholesterol levels among patients who took vitamin C supplements, but for vitamin D supplements cholesterol showed increased weight. The reason of vitamin D interaction with cholesterol in the MetS is high level functionality of vitamin D, which add bone mass, which interacts with adipose tissue or fats [50]. For the main study, TG had no significant interaction among study participants who took vitamin D and C supplements. The lack of interaction may due to the source of TG in the meals that participants were taking once a week to keep their TG low [54]. It was highly unlikely to report high level of TG among the study participants. Additionally, LDL-C and HDL-C had opposite results where LDL-C showed significant interaction with vitamin D compared to C, while HDL-C showed a significant interaction with vitamin C compared to D. The opposing results can be explained by differences in functional presence of either LDL-C or HDL-C within the body. Both vitamin C and D impact on metabolic functioning have been discussed in detail by Berge et al. [54], where vitamin bearing high responsibility for the additive and reductive changes in MetS. The main limitations of this study is its small sample size and duration is short which limits the generalizability of our results. However, studies with a larger sample size and longer follow-up period together with measurement of other related vitamins levels may yield more meaningful data on the effects of vitamins supplementations on MetS patients.
Conclusions
We conclude that, consumption of vitamin D or vitamin C supplements may improves the life of metabolic syndrome patients. However, the combination of physical activities and vitamin supplements maximize the effect, and this combination should be recommended.
Abbreviations
- MetS:
-
metabolic syndrome
- CVD:
-
cardiovascular disease
- IDF:
-
International Diabetes Federation
- BMI:
-
body mass index
- PA:
-
physical activity
- RCT:
-
randomized controlled trial
- WC:
-
waist circumference
- FPG:
-
fasting plasma glucose
- TC:
-
total cholesterol
- TG:
-
triglyceride
- LDL-C:
-
low-density lipoprotein cholesterol
- HDL-C:
-
high-density lipoprotein cholesterol
References
Alberti KGM, Zimmet P, Shaw J. The metabolic syndrome—a new worldwide definition. Lancet. 2005;366(9491):1059–62.
Ebrahimpour P, Fakhrzadeh H, Heshmat R, Ghodsi M, Bandarian F, Larijani B. Metabolic syndrome and menopause: a population-based study. Diabetes Metab Syndr. 2010;4(1):5–9.
Shiwaku K, Nogi A, Kitajima K, Anuurad E, Enkhmaa B, Yamasaki M, et al. Prevalence of the metabolic syndrome using the modified ATP III definitions for workers in Japan, Korea and Mongolia. J Occup Health. 2005;47(2):126–35.
Freiberger E, Häberle L, Spirduso WW, Rixt Zijlstra G. Long-term effects of three multicomponent exercise interventions on physical performance and fall-related psychological outcomes in community-dwelling older adults: a randomized controlled trial. J Am Geriatr Soc. 2012;60(3):437–46.
Small DM, Coombes JS, Bennett N, Johnson DW, Gobe GC. Oxidative stress, anti-oxidant therapies and chronic kidney disease. Nephrology. 2012;17(4):311–21.
Spradley BD, Crowley KR, Tai C-Y, Kendall KL, Fukuda DH, Esposito EN, et al. Ingesting a pre-workout supplement containing caffeine, B-vitamins, amino acids, creatine, and beta-alanine before exercise delays fatigue while improving reaction time and muscular endurance. Nutr Metab. 2012;9(1):28.
Wagner CL, McNeil R, Hamilton SA, Winkler J, Cook CR, Warner G, et al. A randomized trial of vitamin D supplementation in 2 community health center networks in South Carolina. Am J Obstet Gynecol. 2013;208(2):137.
Fedirko V, Bostick RM, Long Q, Flanders WD, McCullough ML, Sidelnikov E, et al. Effects of supplemental vitamin D and calcium on oxidative DNA damage marker in normal colorectal mucosa: a randomized clinical trial. Cancer Epidemiol Prev Biomark. 2010;19(1):280–91.
Mithal A, Bonjour J-P, Boonen S, Burckhardt P, Degens H, Fuleihan GEH, et al. Impact of nutrition on muscle mass, strength, and performance in older adults. Osteoporos Int. 2013;24(5):1555–66.
Myburgh KH. Polyphenol supplementation: benefits for exercise performance or oxidative stress? Sports Med. 2014;44(1):57–70.
Chowdhury R, Kunutsor S, Vitezova A, Oliver-Williams C, Chowdhury S, Kiefte-de-Jong JC, et al. Vitamin D and risk of cause specific death: systematic review and meta-analysis of observational cohort and randomised intervention studies. BMJ. 2014;348:g1903.
Grandi NC, Breitling LP, Brenner H. Vitamin D and cardiovascular disease: systematic review and meta-analysis of prospective studies. Prev Med. 2010;51(3–4):228–33.
Scott D, Blizzard L, Fell J, Ding C, Winzenberg T, Jones G. A prospective study of the associations between 25-hydroxy-vitamin D, sarcopenia progression and physical activity in older adults. Clin Endocrinol. 2010;73(5):581–7.
Beaudart C, Buckinx F, Rabenda V, Gillain S, Cavalier E, Slomian J, et al. The effects of vitamin D on skeletal muscle strength, muscle mass, and muscle power: a systematic review and meta-analysis of randomized controlled trials. J Clin Endocrinol Metab. 2014;99(11):4336–45.
Pludowski P, Holick MF, Pilz S, Wagner CL, Hollis BW, Grant WB, et al. Vitamin D effects on musculoskeletal health, immunity, autoimmunity, cardiovascular disease, cancer, fertility, pregnancy, dementia and mortality—a review of recent evidence. Autoimmun Rev. 2013;12(10):976–89.
Stockton K, Mengersen K, Paratz J, Kandiah D, Bennell K. Effect of vitamin D supplementation on muscle strength: a systematic review and meta-analysis. Osteoporos Int. 2011;22(3):859–71.
Paknahad Z, Vasmehjani AA, Maracy MR. Association of serum 25-hydroxyvitamin d levels with markers of metabolic syndrome in adult women in Ramsar, Iran. Women’s Health Bull. 2014;1(1):e20124.
Saneei P, Salehi-Abargouei A, Esmaillzadeh A. Serum 25-hydroxy vitamin D levels in relation to body mass index: a systematic review and meta-analysis. Obes Rev. 2013;14(5):393–404.
Anstey K, Cherbuin N, Budge M, Young J. Body mass index in midlife and late-life as a risk factor for dementia: a meta-analysis of prospective studies. Obes Rev. 2011;12(5):e426–37.
Gonzalez AB, Hartge P, Cerhan JR, Flint AJ, Hannan L, MacInnis RJ, et al. Body-mass index and mortality among 1.46 million white adults. N Engl J Med. 2010;363(23):2211–9.
Ramful D, Tarnus E, Aruoma OI, Bourdon E, Bahorun T. Polyphenol composition, vitamin C content and antioxidant capacity of Mauritian citrus fruit pulps. Food Res Int. 2011;44(7):2088–99.
Jun S, Jung E, Kang D, Kim J, Chang U, Suh HJ. Vitamin C increases the fecal fat excretion by chitosan in guinea-pigs, thereby reducing body weight gain. Phytother Res. 2010;24(8):1234–41.
Asemi Z, Zare Z, Shakeri H, Sabihi S-S, Esmaillzadeh A. Effect of multispecies probiotic supplements on metabolic profiles, hs-CRP, and oxidative stress in patients with type 2 diabetes. Ann Nutr Metab. 2013;63(1–2):1–9.
Barbieri E, Sestili P. Reactive oxygen species in skeletal muscle signaling. J Sign Transduct. 2012;2012:982794.
Gomes EC, Silva AN, Oliveira MR. Oxidants, antioxidants, and the beneficial roles of exercise-induced production of reactive species. Oxid Med Cell Longev. 2012;2012:756132.
Milić S, Štimac D. Nonalcoholic fatty liver disease/steatohepatitis: epidemiology, pathogenesis, clinical presentation and treatment. Dig Dis. 2012;30(2):158–62.
Strasser B. Physical activity in obesity and metabolic syndrome. Ann N Y Acad Sci. 2013;1281(1):141–59.
Turi BC, Codogno JS, Fernandes RA, Monteiro HL. Low levels of physical activity and metabolic syndrome: cross-sectional study in the Brazilian public health system. Cien Saude Colet. 2016;21:1043–50.
Golder S, Loke YK, Bland M. Meta-analyses of adverse effects data derived from randomised controlled trials as compared to observational studies: methodological overview. PLoS Med. 2011;8(5):e1001026.
Stuart EA. Matching methods for causal inference: a review and a look forward. Stat Sci. 2010;25(1):1.
Kaftan AN, Hussain MK. Association of adiponectin gene polymorphism rs266729 with type two diabetes mellitus in Iraqi population. A pilot study. Gene. 2015;570(1):95–9.
Aalto A-M, Elovainio M, Kivimäki M, Uutela A, Pirkola S. The Beck Depression Inventory and General Health Questionnaire as measures of depression in the general population: a validation study using the composite international diagnostic interview as the gold standard. Psychiatry Res. 2012;197(1–2):163–71.
De Blacam C, Ogunleye AA, Momoh AO, Colakoglu S, Tobias AM, Sharma R, et al. High body mass index and smoking predict morbidity in breast cancer surgery: a multivariate analysis of 26,988 patients from the national surgical quality improvement program database. Ann Surg. 2012;255(3):551–5.
Bull SM. Evidence-based blood conservation education for ICU Nurses: a pre and post-test evaluation of nursing knowledge. 2014. https://uknowledge.uky.edu/dnp_etds/24/.
Barzin M, Hosseinpanah F, Fekri S, Azizi F. Predictive value of body mass index and waist circumference for metabolic syndrome in 6–12-year-olds. Acta Paediatr. 2011;100(5):722–7.
Rothwell PM, Wilson M, Elwin C-E, Norrving B, Algra A, Warlow CP, et al. Long-term effect of aspirin on colorectal cancer incidence and mortality: 20-year follow-up of five randomised trials. Lancet. 2010;376(9754):1741–50.
Bauer JM, Verlaan S, Bautmans I, Brandt K, Donini LM, Maggio M, et al. Effects of a vitamin D and leucine-enriched whey protein nutritional supplement on measures of sarcopenia in older adults, the PROVIDE study: a randomized, double-blind, placebo-controlled trial. J Am Med Dir Assoc. 2015;16(9):740–7.
Tang BM, Eslick GD, Nowson C, Smith C, Bensoussan A. Use of calcium or calcium in combination with vitamin D supplementation to prevent fractures and bone loss in people aged 50 years and older: a meta-analysis. Lancet. 2007;370(9588):657–66.
Ginde AA, Liu MC, Camargo CA. Demographic differences and trends of vitamin D insufficiency in the US population, 1988–2004. Arch Intern Med. 2009;169(6):626–32.
Wolf M, Shah A, Gutierrez O, Ankers E, Monroy M, Tamez H, et al. Vitamin D levels and early mortality among incident hemodialysis patients. Kidney Int. 2007;72(8):1004–13.
Caan B, Neuhouser M, Aragaki A, Lewis CB, Jackson R, LeBoff MS, et al. Calcium plus vitamin D supplementation and the risk of postmenopausal weight gain. Arch Intern Med. 2007;167(9):893–902.
Zittermann A, Frisch S, Berthold HK, Götting C, Kuhn J, Kleesiek K, et al. Vitamin D supplementation enhances the beneficial effects of weight loss on cardiovascular disease risk markers. Am J Clin Nutr. 2009;89(5):1321–7.
Rosenblum JL, Castro VM, Moore CE, Kaplan LM. Calcium and vitamin D supplementation is associated with decreased abdominal visceral adipose tissue in overweight and obese adults. Am J Clin Nutr. 2011;95(1):101–8.
Salehpour A, Hosseinpanah F, Shidfar F, Vafa M, Razaghi M, Dehghani S, et al. A 12-week double-blind randomized clinical trial of vitamin D 3 supplementation on body fat mass in healthy overweight and obese women. Nutr J. 2012;11(1):78.
Vimaleswaran KS, Berry DJ, Lu C, Tikkanen E, Pilz S, Hiraki LT, et al. Causal relationship between obesity and vitamin D status: bi-directional Mendelian randomization analysis of multiple cohorts. PLoS Med. 2013;10(2):e1001383.
Amrein K, Sourij H, Wagner G, Holl A, Pieber TR, Smolle KH, et al. Short-term effects of high-dose oral vitamin D3 in critically ill vitamin D deficient patients: a randomized, double-blind, placebo-controlled pilot study. Crit Care. 2011;15(2):R104.
Romaguera D, Ängquist L, Du H, Jakobsen MU, Forouhi NG, Halkjær J, et al. Food composition of the diet in relation to changes in waist circumference adjusted for body mass index. PLoS ONE. 2011;6(8):e23384.
Du H, van der A DL, Boshuizen HC, Forouhi NG, Wareham NJ, Halkjaer J, et al. Dietary fiber and subsequent changes in body weight and waist circumference in European men and women. Am J Clin Nutr. 2009;91(2):329–36.
Skaaby T, Husemoen LLN, Pisinger C, Jørgensen T, Thuesen BH, Fenger M, et al. Vitamin D status and changes in cardiovascular risk factors: a prospective study of a general population. Cardiology. 2012;123(1):62–70.
Wu SH, Ho SC, Zhong L. Effects of vitamin D supplementation on blood pressure. South Med J. 2010;103(8):729–37.
Beveridge LA, Struthers AD, Khan F, Jorde R, Scragg R, Macdonald HM, et al. Effect of vitamin D supplementation on blood pressure: a systematic review and meta-analysis incorporating individual patient data. JAMA Intern Med. 2015;175(5):745–54.
Pittas AG, Chung M, Trikalinos T, Mitri J, Brendel M, Patel K, et al. Systematic review: vitamin D and cardiometabolic outcomes. Ann Intern Med. 2010;152(5):307–14.
Dakhale GN, Chaudhari HV, Shrivastava M. Supplementation of vitamin C reduces blood glucose and improves glycosylated hemoglobin in type 2 diabetes mellitus: a randomized, double-blind study. Adv Pharmacol Sci. 2011;2011:195271.
Berge K, Musa-Veloso K, Harwood M, Hoem N, Burri L. Krill oil supplementation lowers serum triglycerides without increasing low-density lipoprotein cholesterol in adults with borderline high or high triglyceride levels. Nutr Res. 2014;34(2):126–33.
Authors’ contributions
HAF, MJH, BAM and AHB participated in the design of the study, data collection, performed the statistical analysis and drafted the manuscript. MJH, AE and AHB supervising the study and participated in draft review. All authors have read and approved the final version of the manuscript and agree with the order of presentation of the authors. All authors read and approved the final manuscript.
Acknowledgements
The authors thank the staff and participants at the Sulemani and Halabja center for the control of the communicable and chronic disease for their important contributions to the study.
Competing interests
The authors declare that they have no competing interests.
Availability of data and materials
The datasets used and/or analyzed during the current study are available from the corresponding author on reasonable request.
Consent for publication
Not applicable.
Ethics approval and consent to participate
The Ethics Committee of Tehran University of Medical Sciences approved the study protocol, and the trial was registered at the World Health Organization, International Clinical Trails Registry Platform (Code: IRCT20161110030823N2). In addition, written informed consent was also obtained from each participant.
Funding
This research did not receive any specific grant from funding agencies in the public, commercial, or not-for-profit sectors.
Publisher’s Note
Springer Nature remains neutral with regard to jurisdictional claims in published maps and institutional affiliations.
Author information
Authors and Affiliations
Corresponding author
Rights and permissions
Open Access This article is distributed under the terms of the Creative Commons Attribution 4.0 International License (http://creativecommons.org/licenses/by/4.0/), which permits unrestricted use, distribution, and reproduction in any medium, provided you give appropriate credit to the original author(s) and the source, provide a link to the Creative Commons license, and indicate if changes were made. The Creative Commons Public Domain Dedication waiver (http://creativecommons.org/publicdomain/zero/1.0/) applies to the data made available in this article, unless otherwise stated.
About this article

Cite this article
Farag, H.A.M., Hosseinzadeh-Attar, M.J., Muhammad, B.A. et al. Comparative effects of vitamin D and vitamin C supplementations with and without endurance physical activity on metabolic syndrome patients: a randomized controlled trial. Diabetol Metab Syndr 10, 80 (2018). https://doi.org/10.1186/s13098-018-0384-8
Received:
Accepted:
Published:
DOI: https://doi.org/10.1186/s13098-018-0384-8