Abstract
Background
Celery is a widely cultivated vegetable abundant in ascorbate (AsA), a natural plant antioxidant capable of scavenging free radicals generated by abiotic stress in plants. Ascorbate peroxidase (APX) is a plant antioxidant enzyme that is important in the synthesis of AsA and scavenging of excess hydrogen peroxide. However, the characteristics and functions of APX in celery remain unclear to date.
Results
In this study, a gene encoding APX was cloned from celery and named AgAPX1. The transcription level of the AgAPX1 gene was significantly upregulated under drought stress. AgAPX1 was expressed in Escherichia coli BL21 (DE3) and purified. The predicted molecular mass of rAgAPX1 was 33.16 kDa, which was verified by SDS-PAGE assay. The optimum pH and temperature for rAgAPX1 were 7.0 and 55 °C, respectively. Transgenic Arabidopsis hosting the AgAPX1 gene showed elevated AsA content, antioxidant capacity and drought resistance. Less decrease in net photosynthetic rate, chlorophyll content, and relative water content contributed to the high survival rate of transgenic Arabidopsis lines after drought.
Conclusions
The characteristics of APX in celery were different from that in other species. The enhanced drought resistance of overexpressing AgAPX1 in Arabidopsis may be achieved by increasing the accumulation of AsA, enhancing the activities of various antioxidant enzymes, and promoting stomatal closure. Our work provides new evidence to understand APX and its response mechanisms to drought stress in celery.
Background
Under abiotic stresses, plants generate numerous reactive oxygen species (ROS), including superoxide radical, hydrogen peroxide (H2O2), and lipid peroxides. Excessive accumulation of ROS damages plant cells via lipid peroxidation and protein oxidation [1, 2]. Many enzymatic and non-enzymatic antioxidants can reduce ROS levels to maintain cellular redox balance [1]. Plants contain various enzymatic antioxidants, such as superoxide dismutase (SOD), peroxidase (POD), catalase (CAT), and ascorbate peroxidase (APX), as well as non-enzymatic antioxidants, such as ascorbate (AsA), glutathione, flavonoids and carotenoids for ROS scavenging system [3, 4].
APX of the heme peroxidase superfamily [5, 6] is involved in the recycling pathway of AsA and environmental stress response in plants. AsA is a well-known plant antioxidant. Natural antioxidants have attracted increasing attention because of their beneficial effects on humans [7]. Plant resistance is also an enduring topic in the field of plant science [8, 9]. Several researchers focused on improving the ability of plants to tolerate abiotic stresses, including saline-alkali [10], drought [11], heat [12], and cold [13, 14]. APX is a key enzyme in the AsA–glutathione (AsA–GSH) pathway that removes excessive H2O2 in plant cells under normal and stress conditions [15]. APX catalyzes the reduction of H2O2 using AsA as an electron donor to water and monodehydroascorbate [16]. Then monodehydroascorbate spontaneously transforms into dehydroascorbate.
APX is widely studied because of its important roles in higher plants. It is also found in eukaryotic algae [17]. APX has been purified and studied in tea [18], rice [19], komatsuna [20], potato [21], and many other species. The physic-chemical properties of APXs vary in different species.
Drought is still the most vital constraint in crop production and food security, especially in areas where agricultural water resources are insufficient. Global warming and increasing droughts have aggravated the loss of the agricultural economy [22]. Many studies have reported that APX is involved in AsA accumulation and abiotic stresses such as salt stress [23,24,25]. However, related reports in resisting drought stress are poor.
Celery is a vegetable belonging to Apiaceae with rich nutritional value, and its growth is influenced by multiple abiotic stresses [26,27,28]. In our previous study, we determined changes in the expression of the APX gene during the developmental stages of celery [29]. However, the characteristics and transcriptional regulation mechanism of APX under drought stress in celery remain unknown. In the present study, the AgAPX1 gene was cloned from celery, and its expression levels under simulated drought stress were detected. The active recombinant protein rAgAPX1 was obtained and then characterized. Furthermore, the subcellular localization of AgAPX1 was investigated. The AsA content, antioxidant capacity, and drought tolerance of Arabidopsis overexpressing AgAPX1 were also detected and analyzed. The results of this study imply that AgAPX1 can enhance the drought tolerance and serve as a potential target for resistance breeding with gene engineering in celery.
Results
Nucleotide sequence and deduced amino acid sequence of AgAPX1
As shown in Additional file 1, AgAPX1 cDNA consists of 753 bp nucleotides and encodes 250 amino acids. The molecular mass and theoretical pI of native AgAPX1 were 27.72 kDa and 5.41, respectively. The protein formula was C1244H1926N332O371S8 with a weak hydrophilicity. The deduced amino acid sequence of AgAPX1 was aligned with homologous sequences from other species, including Pisum sativum, Arabidopsis thaliana, Brassica rapa, and Oryza sativa using the ESPript 3.0 website [30]. The similarity of APX sequences between celery and P. sativum was the highest (80.8%) (Fig. 1a). Phylogenic tree showed that the APX proteins from Apium graveolens and Spuriopimpinella brachycarpa belonged to the same branch, and the APX proteins from other plants in same family were also clustered together (Fig. 1b). AgAPX1 and the APX proteins from other monocot plants were distant in evolution. In addition, the AgAPX1 protein has a specific peroxidase domain from sites 25 to 227 (Fig. 1c). Three-dimensional structure analysis using the pea protein (PDB ID:1apx) as template indicated that AgAPX1 contains thirteen TM α-helices and two β-sheets (Fig. 1d).

Sequence characteristic analysis AgAPX1 protein. a Alignment of deduced amino acid sequences of AgAPX1 with other ascorbate peroxidase from Pisum sativum (Accession No. P48534.2), Arabidopsis thaliana (Accession No. Q05431.2), Brassica rapa (Accession ACV92696.1), and Oryza sativa (Accession No. Q10N21.1) contained secondary structure elements (helices with squiggles, β-strands with arrows and turns with TT letters). b Phylogenetic relationships of deduced amino acid sequences of AgAPX1 and other APX proteins. Arabidopsis thaliana (Q05431.2), Brassica rapa (ACV92696.1), Camellia azalea (AKP06507.1), Ipomoea batatas (ALP06091.1), Ipomoea trifida (AGT80152.1), Nicotiana tabacum (AAA86689.1), Oryza sativa (Q10N21.1), Pisum sativum (P48534.2), Spuriopimpinella brachycarpa (AAF22246.1), and Zea mays (NP_001105500.2). c The predicted domain location of AgAPX1. d Three-dimensional structures of AgAPX1. The red and blue parts mark the alpha helix and beta turn, respectively
Expression profiles of AgAPX1 under PEG 6000 treatment in celery
The expression profiles of AgAPX1 were detected to verify its response under dehydration stress in celery. As shown in Fig. 2, the expression level of the AgAPX1 gene at 1 h under PEG treatment was 2.56 folds higher than that of the control, and peaked at 4 h followed by a decrease. The results indicated that the AgAPX1 gene responsed to PEG 6000 treatment and involved in dehydration stress in celery.
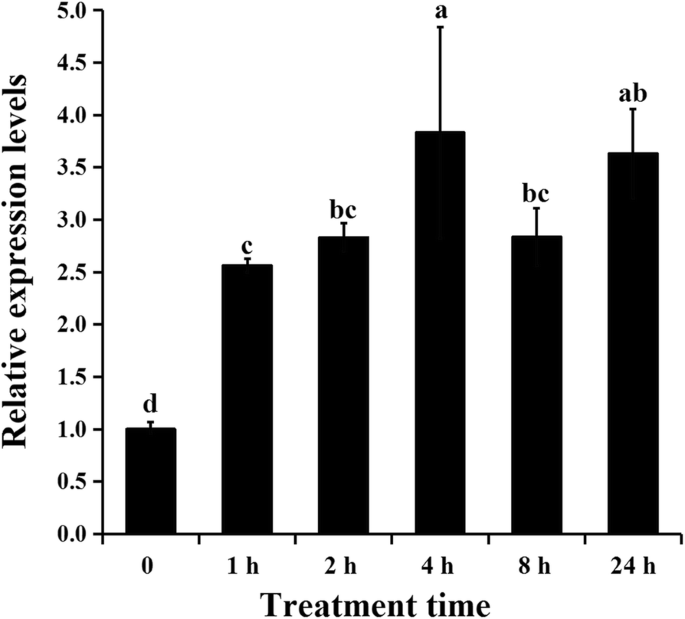
Expression profile of AgAPX1 gene under drought stress in ‘Jinnanshiqin’. Different letters represent significant difference at 0.05 level
Expression of AgAPX1 in Escherichia coli and purification of recombinant AgAPX1
The AgAPX1 gene was cloned into the pET30 vector to construct a protein expression vector (pET-30a(+)-AgAPX1) and then expressed in E. coli BL21(DE3). A purified recombinant protein of AgAPX1 was prepared and named rAgAPX1. Its molecular weight was 33.16 kDa as calculated by ExPASy. Coomassie-stained SDS-PAGE of the purified rAgAPX1 protein showed a single band at about 34 kDa, which corresponds to the calculation (Additional file 2).
Characterization of rAgAPX1
The optimum pH for the rAgAPX1-catalyzed oxidation of AsA was pH 7.0 (Fig. 3a). The relative enzyme activity of rAgAPX1 was low in the acid environment, maintained a rising activity until pH 7.0, and then decreased. The result indicates that the suitable reaction environment of the enzyme is neutral. The optimum temperature for rAgAPX1 was found to be 55 °C (Fig. 3b). The enzyme activity of rAgAPX1 increased with reaction temperature from 20 °C to 55 °C, peaked at 55 °C followed by a decrease, and then deactivated at 90 °C.

Effect of pH (a) and temperature (b) on purified AgAPX1 activity
Subcellular localization of the AgAPX1 protein
The empty vector (pA7-GFP) and recombinant vector (AgAPX1-GFP) were expressed in onion epidermal cells to investigate the subcellular localization of AgAPX1. The onion epidermal cell with empty vector displayed strong fluorescence throughout the entire cell (Fig. 4a). Meanwhile, the onion epidermal cells transformed by the recombinant vector showed a similar distribution of green fluorescence to the empty vector (Fig. 4b). The 35S:AgAPX1-GFP fusion-construct was also expressed in Arabidopsis mesophyll protoplasts. The green fluorescence signals were mainly displayed in the nucleus and the plasma membrane, and did not overlap with chloroplast fluorescence (Fig. 4c). These results suggest that AgAPX1 is located in the nucleus and membrane and not in the chloroplast.

Subcellular localization analysis of AgAPX1. a Control vector (pA7-GFP) expressed in onion epidermal cells. b Recombinant vector (AgAPX1-GFP) expressed in onion epidermal cells. c AgAPX1-GFP fusion proteins transiently expressed in Arabidopsis mesophyll protoplasts. GFP: green fluorescent protein; BF: bright field; chloroplast: chlorophyll auto fluorescence; merged: combined fluorescence from GFP, BF, and chloroplast
Heterologous expression of AgAPX1 in Arabidopsis increased the AsA content and total antioxidant capacity
Transgenic Arabidopsis plants overexpressing the AgAPX1 gene were generated to further investigate the molecular functions of AgAPX1. The positive transgenic lines hosting the AgAPX1 gene were confirmed by gene-specific amplification (Fig. 5a). Two transgenic lines showed blue by β-glucuronidase (GUS) staining (Fig. 5b). AsA levels were assessed using 4-week-old Arabidopsis leaves by HPLC. The AsA contents in the two transgenic lines were markedly higher than that in the wild-type (WT) Arabidopsis plants (Fig. 5c and Additional file 3). The AgAPX1–4 line had the highest level of AsA, which was approximately 1.4 times higher than that in the WT plants. The total antioxidant capacities of the AgAPX1–4 and AgAPX1–16 lines increased by 29.10 and 21.16% as evaluated by FRAP assays, respectively (Fig. 5d).

PCR amplification, GUS stain identification, and functional analysis of Arabidopsis transformed with a AgAPX1 gene. a PCR amplification of AgAPX1 from the cDNA of transgenic Arabidopsis plants. b Histochemical GUS assays of control line and transgenic lines. c Ascorbate levels of 4-weeks-old transgenic Arabidopsis and WT plants. d The difference of antioxidant capacity between 4-weeks-old transgenic Arabidopsis and WT plants. WT, non-transgenic Arabidopsis (negative control); AgAPX1–4 and AgAPX1–16, transgenic Arabidopsis plants. Error bars represent standard deviation among three independent replicates. Data are expressed as the means ± standard deviation (SD) of three replicates. Different letters represent significant difference at 0.05 level
Overexpression of AgAPX1 in Arabidopsis positively regulates drought tolerance by regulating the stomata aperture
Transgenic and WT Arabidopsis plants were treated with 400 mM mannitol to study the tolerance to drought stress. The phenotype of Arabidopsis plants was observed after 7 days of mannitol treatment (Fig. 6a). The transgenic lines showed a better status under drought condition. The stomatal apertures of WT and transgenic lines both decreased in response to stress. The two transgenic Arabidopsis lines showed smaller stomatal apertures after 24 h of drought treatment. The width-to-length ratio of stomatal aperture in the two transgenic Arabidopsis plants decreased to 0.85 and 0.66 times as much as that in the WT plants (Fig. 6b).

Phenotype, stomata state and activity of antioxidant enzymes in wild-type (WT), transgenic lines (AgAPX1–4 and AgAPX1–16) before and after drought treatment. a Comparison of growth phenotype among transgenic and non-transgenic Arabidopsis lines. For drought stress treatments, these plants were treated with 400 mM mannitol and photographed after 7 days. b Stomatal aperture measurements of different Arabidopsis lines in response to 24 h of drought. c APX activity assay (after 24 h of treatment). d SOD activity assay (after 24 h of treatment). e POD activity assay (after 24 h of treatment). f CAT activity assay (after 24 h of treatment)
Analysis of antioxidant enzyme activities in transgenic lines before and after treatment
The activities of four key enzymes, APX, SOD, POD, and CAT, were measured in WT and two transgenic Arabidopsis lines under normal condition and drought treatment. APX, SOD, and POD are major enzymes in the ROS scavenging system. CAT is also an important antioxidant enzyme in plants [31]. In plant life cycle, H2O2 accumulates under various abiotic stresses [1]. Excessive H2O2 oxidizes biological macro-molecules (nucleic acids and proteins) directly or indirectly, and damages cell membranes, thus accelerating cell senescence and disintegration. CAT can scavenge H2O2 and maintain the balance of ROS metabolism in plants. The activity of CAT in plant tissues is also closely related to plant stress resistance [31, 32].
The transgenic Arabidopsis lines had significantly higher APX activities than the WT plants (Fig. 6c). The APX activities of all samples increased after drought treatment, and the increase was more remarkable in the AgAPX1–4 transgenic line. In addition, drought stress enhanced the SOD activities in the two transgenic lines compared with the WT plants (Fig. 6d). The POD activities in all of the tested samples increased after drought stress (Fig. 6e). However, the CAT activities in the WT plants showed markedly increased than those in the two transgenic lines after drought treatment (Fig. 6f).
Physiological changes in Arabidopsis leaves exposed to drought stress
The net photosynthetic rate (Pn) was measured to evaluate the photosynthetic activity in WT and transgenic Arabidopsis under drought stress. As shown in Fig. 7a, Pn considerably decreased in the WT over transgenic lines under drought stress. The results suggested that the photosynthetic system of WT incurred more severe damage than that of the transgenic lines. Total chlorophyll and relative water content (RWC) also considerably decreased in the WT plants compared with the transgenic lines (Fig. 7b and c). The survival rate was used to further demonstrate the drought tolerance of transgenic lines, and results showed that the two transgenic lines retained higher survival rate after treatment (Fig. 7d).
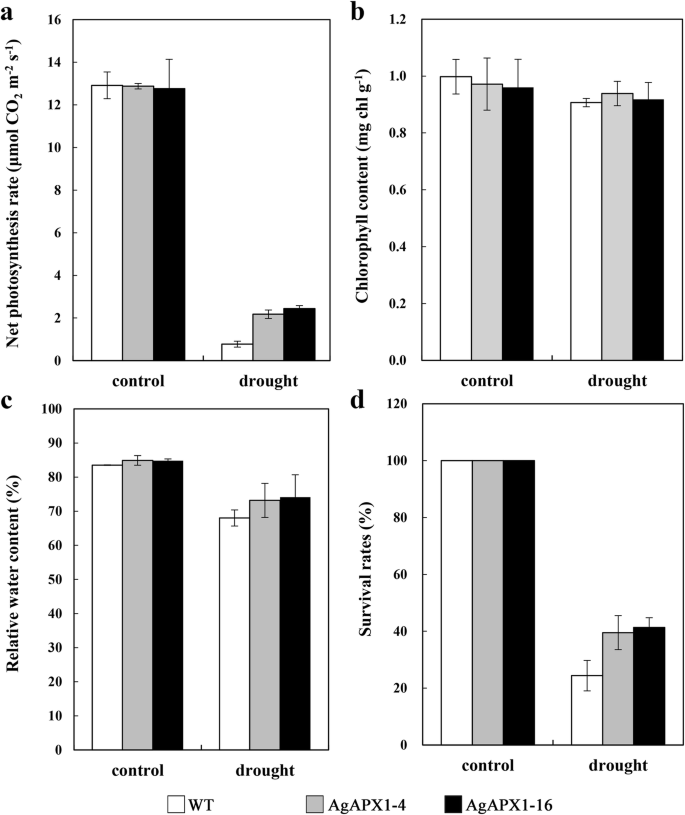
Physiological changes in the leaves of wild-type (WT) and transgenic Arabidopsis lines (AgAPX1–4 and AgAPX1–16) subjected to drought. a Net photosynthetic rate. b Total chlorophyll content. c Relative water content. d Plant survival rate
Discussion
The APX protein contains hemoglobin that possesses a high specificity to ascorbic acid. APX also has a higher affinity with H2O2 and utilizes AsA as a specific electron donor, which plays a crucial role in modulating or eliminating H2O2 from cells and maintaining cellular redox equilibrium [33,34,35]. Celery, which is rich in AsA, is widely cultivated worldwide [29]. In the present work, the AgAPX1 gene, was cloned from celery cv. ‘Jinnanshiqin’. The prediction of AgAPX1 specific structure will help us understand its particular function. AgAPX1 is highly conserved and characterized with a peroxidase domain. The deduced amino acid sequence of AgAPX1 was the highest similar to that of APX from P. sativum. AgAPX1 is very conservative and shows a high homology to other APXs. Phylogenic analysis indicated that the APX protein of the same family is closer in evolution and the sequence divergence of APX might occur after the monocot–dicot split as other structural genes [36].
Several reports reported the purification of APX from plant tissues or E. coli cells to investigate its functions [19, 20, 37]. Previous studies indicated that the purified APX has a molecular mass ranging from 28 kDa to 31 kDa [20, 21, 38]. The molecular mass of rAgAPX1 from celery was higher, which was approximately 34 kDa as measured by SDS-PAGE. The optimal temperature and pH of the rAgAPX1 enzyme were 55 °C and 7.0, respectively. By contrast, the optimal cytosolic APX activity was at 38 °C and pH 6.5 in komatsuna [20]. In liverwort, the APX enzyme had an optimal temperature of 40 °C and an optimal pH of 6.0 [38]. The differences in physicochemical properties among different species may be caused by the differences in APX gene sequence. Another reason may be affected by the insertion of His-tag, S-tag, enterokinase, and thrombin sequences in the N-terminus of the rAgAPX1 protein [39, 40].
The analysis of gene expression is an important strategy to understand the molecular mechanisms of stress responses in higher plants. Previous studies have reported that plants generally exhibited increased APX activity under stress conditions, which is usually correlated with increased stress tolerance [41, 42]. Simultaneously, the expression of APX genes may be induced to protect against oxidative stress [42]. The activity of APX enzymes is enhanced when subjected to cold and salt stresses [16, 43]. In addition, the expression of the APX gene is upregulated under drought stress in Eleusine coracana [44]. In the present study, the transcription level of the AgAPX1 gene was markedly upregulated when exposed to PEG-induced dehydration stress in ‘Jinnanshiqin’ plants, which is consistent with the results of previous researches [45, 46]. The result suggests that the AgAPX1 gene involved in the response of celery to drought stress. The response of the AgAPX1 gene to adversity may be attributed to the conservation of APX sequences among different species. In addition, most of the differentially expressed genes related to antioxidant enzymes are localized in the mitochondria, chloroplast, and peroxisome [47, 48]. APXs have several forms of isoenzymes according to their distribution in plant cells, including stromal (sAPX), thylakoid membrane (tAPX) in the chloroplast, microbody APX (mAPX), and cytosolic APX (cAPX) [17]. Our study indicated that AgAPX1 is mainly localized in the nucleus and membrane. The probable functions of APX in the nucleus are to orchestrate ROS signaling and regulate related genes expression, thereby regulating plant physiological changes and stress response [49, 50].
Drought stress is a global problem that limits horticultural productivity. Some defense mechanisms in plants are aroused under stress to protect themselves from the damage of oxidative stress [51]. Previous studies also reported that the overexpression of APX in plants enhances the tolerance to both cold and heat stresses [50]. Overexpression of the SsAPX gene isolated from Suaeda salsa in Arabidopsis protects plants against salt-induced oxidative stress [52]. AsA is a natural antioxidant and acts directly to neutralize superoxide radicals in plant response to abiotic stress [24]. The overexpression of genes involved in AsA metabolism, such as GMP [36], GGP [53], and DHAR [54], provides an elevated resistance to abiotic stresses by regulating the generation of AsA in plants. We found that overexpressing AgAPX1 in Arabidopsis showed increased AsA content significantly. Under drought stress, the transgenic Arabidopsis (AgAPX1–4 and AgAPX1–16) lines displayed better growth status than the WT plants. Multiple enzymatic antioxidants play key roles in scavenging the toxic ROS and protecting the plants from oxidative damage [55]. The enzyme activity of APX in transgenic Arabidopsis also increased. AgAPX-16 line showed higher APX activities than AgAPX-4 line. The possible reason is that AsA biosynthesis is regulated complexly by many factors aside from APX activity [29]. Drought stress induced a prominent increase in the activities of some antioxidant enzymes, including APX, SOD, and POD in the transgenic Arabidopsis plants. These results suggest that transgenic Arabidopsis plants hosting AgAPX1 had an increased tolerance to drought stress by enhancing AsA accumulation and the activities of antioxidant enzymes. AgAPX1–16 line showed a lower increment of APX activity than the AgAPX1–4 line in response to drought. The difference in APX activity of transgenic lines may be associated with insertion site, post-transcription, and post-translation of the target gene. The WT plants showed a greater elevation of CAT activity than the transgenic plants. CAT, a direct H2O2 scavenging enzyme, was used to eliminate excessive H2O2 generated from drought stress in the anti-oxidative defense system of plants [56].
The increased stress tolerance is also probably associated with the closure of stomata in plants. The key role of stomatal closure in plant innate immunity has been described [57]. In higher plant, abiotic stress could induce stomatal closure. CO2 levels are decreased in the leaves, which promotes oxygenation of RuBP to produce additional H2O2 [58, 59]. ROS species such as H2O2 are mainly targeted by APXs [33]. Therefore, the decreased stomatal apertures and elevated antioxidant enzyme activities of the transgenic Arabidopsis plants under drought stress are justifiable. Meanwhile, the drought-induced reduction in net photosynthetic rate, relative water content, and chlorophyll content was much lower in the transgenic lines than in the WT plants. These results agree with previous reports [60, 61]. Less chlorophyll degradation and decreased lipid peroxidation have been detected in transgenic plants overexpressing APX gene under several adversities in previous studies [62, 63]. We concluded that the change in AgAPX1 transcriptional level is an important regulatory mechanism in response to abiotic stress in celery and transgenic Arabidopsis.
In addition, gene silencing and knockout are important technical means to verify the function of genes in plants. Gene silencing is usually achieved using RNA interference (RNAi) [64]. And the CRISPR/Cas9 system has been used routinely in the knockout of genes [65]. However, the two technologies are both performed based on the transgenic technology and an efficient transformation system has not yet been established in celery. We will focus on eliminating this limitation to generate stable loss-of-function plants for further functional verification in our future work.
Conclusion
A key enzyme of AsA–GSH cycle in celery, AgAPX1, was identified and characterized in this study. The current results provided important information on the potential characteristics of the APX enzyme. The response of AgAPX1 to drought in celery and the heterologous expression of the AgAPX1 gene in Arabidopsis further elucidated the important roles of AgAPX1. AgAPX1 transgenic lines may establish a reference for selecting crop plants with high drought tolerance and increase the confidence and basis of its homologous expression by transgenic technology to enhance stress tolerance in celery. These findings are important for farming in areas under drought stress.
Methods
Plant materials and stress treatment
Arabidopsis Columbia ecotype (the control Arabidopsis) and celery cv. ‘Jinnanshiqin’ were deposited at the State Key Laboratory of Crop Genetics and Germplasm Enhancement, Nanjing Agricultural University (32°04′N, 118°85′E). The plants were grown in pots containing a mixture of organic soil and vermiculite (3:1, v/v) in an artificial climate chamber (a 16-h photoperiod, an illumination of 240 μmol m− 2 s− 1, day/night temperatures of 25/16 °C and a relative humidity of 70%). For dehydration stress, two-month-old celery plants were treated with 20% PEG 6000. The leaf blades of ‘Jinnanshiqin’ were harvested after 1, 2, 4, 8, 12, and 24 h and immediately frozen in liquid nitrogen and stored at -80 °C until analysis. The Arabidopsis seeds were sown on MS solid medium for 7 days, transferred to a commercial potting soil mixture, and then placed in a controlled growth chamber at 22 °C with a relative humidity of 70% under the condition (12 h: 12 h, light: dark). Four-week-old A. thaliana seedlings were irrigated with 400 mM mannitol solution. The samples were collected at 24 h after treatment for further analysis.
Gene searching, cloning, and bioinformatics analysis
The amino acid sequences of the DcAPX (Accession No. AKH49594.1), an APX from carrot, was used to blast against our celery transcriptome database to obtain the gene encoding APX [66, 67]. The open reading frame (ORF) in comp120_c0_seq1 was the most similar to the sequence of DcAPX. This ORF was designated as AgAPX1 in this study. The gene was cloned from the cDNA of ‘Jinnanshiqin’ celery by PCR amplification. The cloning primers of AgAPX1 were 5′-ATGGGAAAGTGCTATCCAATTGT-3′ and 5′-TTAGGCCTCAGCAAACCCAAGT-3′. Then, the basic physical and chemical properties of the predicted protein were analyzed using ExPASy (http://expasy.org/tools/). The functional domains of the AgAPX1 protein were analyzed using the SMART program. The three-dimensional structure modeling was performed using CPHmodels 3.2 Server (http://www.cbs.dtu.dk/services/CPHmodels/) online analysis software. The amino acid sequences of APX proteins from different species were aligned in the Clustal X program, and a phylogenetic tree was constructed using MEGA 6.0 [68].
Expression patterns of AgAPX1 gene
The RT-qPCR system was performed on the CFX96 Real-Time PCR system (Bio-Rad) with SYBR Premix Ex Taq. RNA was extracted using the RNAprep pure plant kit (Tiangen-bio, Beijing, China) in accordance with the manufacturer’s instructions, followed by reverse transcription to cDNA. A 15 × diluted cDNA sample was used for RT-qPCR analysis. The AgActin gene was used as an internal standard for normalization [69]. The primer pairs of the AgAPX1 gene for RT-qPCR were 5′-GCCGCTTGCCTGATGCTACTT-3′ and 5′-CCTTCAAACCCAGAACGCTCCTT-3′. The relative expression data were calculated using the 2−∆∆Ct method [70]. Each sample was performed with three biological replicates.
Expression of AgAPX1 in E. coli
The AgAPX1 gene was cloned into the vector pET-30a (+) between the Bam HI and Sac I sites. The recombinant forward primer and reverse primer were 5′-GCCATGGCTGATATCGGATCCATGGGAAAGTGCTATCCAATTGT-3′ and 5′-GCAAGCTTGTCGACGGAGCTCTTAGGCCTCAGCAAACCCAAGT-3′, respectively. The amplified vector was then transformed into E. coli DH5α and confirmed by DNA sequencing. E. coli BL21(DE3) cells (TransGen, Beijing, China) were used for the expression of pET-30a (+)-AgAPX1. The transformed bacterial cells were grown in 50 mL of LB medium containing 50 mg·L− 1 kanamycin at 37 °C for about 4 h with 230 rpm shaking until the OD600 value reached 0.4–0.6. The recombinant protein was induced by adding isopropyl β-D-1-thiogalactopyranoside (IPTG) to a final concentration of 1.0 mM at 18 °C, and the culture was continued to shake (220 rpm) for over 12 h.
Purification of recombinant protein AgAPX1
All steps of the recombinant protein purification were carried out at 4 °C. The cells were harvested by centrifugation; suspended in 4 mL of lysis buffer (pH = 7.5) containing 50 mM NaH2PO4, 300 mM NaCl, 10% glycerol, 10 mM β-mercaptoethanol and 10 mM imidazole; and disrupted by sonication for 20 min on ice. Cell homogenate after sonication was centrifuged at 12,000 rpm for 10 min at 4 °C, and the supernatant was filtered using 0.22-μm microfiltration membranes. The mixture was loaded on a column containing Ni-NTA-agarose resin (1.5 mL bed volume) (Qiagen, Hilden, Germany) equilibrated with equilibrium buffer (50 mM NaH2PO4, 300 mM NaCl, 10% glycerol and 10 mM imidazole, pH = 7.5). Washing with a buffer (pH = 7.5) containing 50 mM NaH2PO4, 300 mM NaCl, 10% glycerol, 10 mM β-mercaptoethanol, and 50 mM imidazole was performed more than six times to elute other proteins. Then, the His-tagged AgAPX1 was dissolved by elution buffer (50 mM NaH2PO4, 300 mM NaCl, 10% glycerol, 10 mM β-mercaptoethanol and 10 mM imidazole, pH = 7.5) and subsequently washed with equilibrium buffer to re-equilibrate the column. The purified enzyme was collected as previously described and then stored at -20 °C for further analysis. The purity of the active fractions was tested using 12% (w/v) SDS-PAGE as described by Laemmli [71] and then stained with Coomassie Brilliant Blue.
AgAPX1 activity assay
APX activity was measured as previously described by Nakano & Asada (1987) [72] with some modifications. Briefly, the reaction mixture contained 50 mM PBS (pH = 7.0) with 0.1 mM EDTA-Na2, 0.5 mM AsA and 0.1 mM H2O2, and about 50 μg purified rAgAPX1 in a final volume of 300 μL. The reaction was initiated with the addition of H2O2. Enzyme activity was determined by measuring the decrease in absorbance at 290 nm (Ɛ290/2.8 mM− 1 cm− 1) due to AsA oxidation over a few minutes. Protein concentration was determined with Coomassie Brilliant Blue G-250 according to the method of Bradford using bovine serum albumin (BSA) as the standard.
Effect of pH and temperature on AgAPX1 activity
The optimum pH for enzyme activity was determined in 50 mM citric acid–Na2HPO4 (pH = 4.0–5.0), 50 mM NaH2PO4–Na2HPO4 (pH = 6.0–8.0), and 50 mM glycine–NaOH (pH = 9.2). The effect of temperature (20 °C–90 °C) on enzyme activity was determined at pH 7.0 in 50 mM PBS for 5 min.
Subcellular localization
The full-length sequence of the AgAPX1 gene without the terminator was amplified and then inserted into the GFP-fusion expression vector pA7. The recombinant vector (AgAPX1-GFP) and empty vector (pA7-GFP) were transferred into onion cells with gold powder via a biolistic procedure by using a helium driven particle accelerator (PDS-1000, Bio-Rad). The onion epidermal cells were spread on the MS solid medium for over 16 h in a dark incubator at 25 °C. Moreover, the recombinant vector 35S:AgAPX1-GFP was transformed into Arabidopsis mesophyll protoplasts to identify the real location of AgAPX1 since some APXs are located in chloroplast and onion epidermal cells lack chloroplasts. The isolation of Arabidopsis mesophyll protoplasts and transient gene expression were conducted according to PEG-mediated transformation method described by Yoo et al. [73] with some modifications. The transformed protoplasts also were incubated in a dark incubator at 25 °C for over 16 h. The fluorescence signal of GFP fusion proteins and red chloroplast auto fluorescence were observed using a LSM780 confocal microscopy imaging system (Zeiss Co., Oberkochen, Germany).
Overexpression vector construct and Arabidopsis transformation
The full-length ORF of AgAPX1 was amplified using the specific primers (forward: 5′-TTTACAATTACCATGGGATCCATGGGAAAGTGCTATCCAATTGT-3′ and reverse:5′-ACCGATGATACGAACGAGCTCTTAGGCCTCAGCAAACCCAAGT-3′) and subcloned into the vector pCAMBIA-1301. The construct was verified by PCR and sequencing. The recombinant vector (CaMV 35S:AgAPX1) containing a 35S: GUS reporter gene sequence was introduced in the Agrobacterium tumefaciens strain GV3101 via electroporation. Transformation of WT plants was performed using the floral-dip method as previously described [74]. The transgenic lines of Arabidopsis were screened on a MS medium containing hygromycin (40 mg/L) and then planted. The seeds were then harvested. To further verify the presence of AgAPX1 in the transgenic Arabidopsis, GUS staining and PCR amplification were conducted. The independent transgenic Arabidopsis lines obtained by screening were used in the next experiment.
Determination of AsA content
AsA content was determined in accordance with the method described by Duan with slight modifications [75]. Briefly, about 0.3 g fresh leaves from transgenic and WT Arabidopsis plants were ground with 2 mL 1% (w/v) pre-cooling oxalic acid. The homogenate was centrifuged at 12,000 rpm for 10 min at 4 °C and the supernatant was filtered through a 0.45 μm membrane syringe filter. Sample analysis was performed using the Agilent 1200 HPLC system for assays of AsA levels at a wavelength of 245 nm. The mobile phase consisted of 0.1% (v/v) acetic acid at a flow rate of 1 ml/min. AsA content was expressed as mg/100 g (fresh weight, Fw).
Antioxidant capacity analysis
The antioxidant capability of the samples was estimated by the FRAP (ferric reducing antioxidant potential) method. It was performed using the T-AOC Assay Kit (S0116, Beyotime, Shanghai, China) in accordance with the manufacturer’s instructions. Approximately 0.2 g fresh leaves of Arabidopsis plants were homogenated with 1 mL PBS (pH = 7.0), and the absorbance was monitored using a spectrophotometer at 593 nm. The result of antioxidant activity was recorded as mM Fe2+ per g fresh weight (mM Fe2+/g Fw).
Analysis of stomatal characteristics
Images of the stomata were obtained using the abaxial epidermis of leaves detached from 4-week-old Arabidopsis plants before and after 24 h of drought stress. The observation and statistics of stomatal lengths and apertures were accomplished randomly using electron microscopy and CellSens image software.
Crude enzyme extract and enzymatic activity measurement
The crude enzyme was extracted from 4-week-old leaves of both transgenic and non-transgenic Arabidopsis plants after 400 mM mannitol for 24 h. For SOD and POD activity determination, about 0.2 g fresh samples were extracted with 50 mM PBS (pH 7.8) and detected using Wang’s method [76]. For the determination of APX and CAT activities, fresh Arabidopsis leaves were homogenated with 50 mM PBS (pH 7.0, containing 0.1 mM EDTA). The test of crude APX activity was performed the same as that described above. CAT activity assay was performed following the modified method of Sahu et al. [77]. Each experiment was performed with three independent replicates.
Measurements of photosynthetic rate, total chlorophyll content, RWC, and plant survival rate
Pn was measured using the Li-6400 portable photosynthesis system. Total chlorophyll content was determined following the method of Lichtenthaler and Wellburn [78]. RWC was measured as previously described [79]. It was calculated according to the formula as follow: RWC = [Fw-Dw]/[Tw-Dw]X100, where Fw is fresh weight of leaf, and Tw is rehydrated weight of leaf after incubating in water for 8 h, and then drying them in an oven at 80 °C until constant weight is recorded as Dw. In addition, the Arabidopsis plants were treated by withholding watering for 10 d, and then the survival rate was recorded after rewatering for 3 d after recovery. All the above experiments were carried out using 4-week-old leaves.
Statistical analysis
All values reported in this study were the means of three independent replicate measurements, unless otherwise stated. The data were expressed as mean ± standard deviation (SD) of three replicates. Statistical significance of the differences was analyzed by SPSS 20.0 software (SPSS Inc., Chicago, IL, USA) using Duncan’s multiple-range test with a significance level of 0.05 (P < 0.05).
Availability of data and materials
The data sets supporting the conclusions of this article are included within the article and its additional files.
Arabidopsis Columbia ecotype (the control Arabidopsis) and celery ‘Jinnanshiqin’ were deposited at the State Key Laboratory of Crop Genetics and Germplasm Enhancement, Nanjing Agricultural University.
Abbreviations
- APX:
-
Ascorbate peroxidase
- AsA:
-
Ascorbate
- BSA:
-
Bovine serum albumin
- CAT:
-
Catalase
- DHA:
-
Dehydroascorbate
- EDTA:
-
Ethylenediaminetetraacetic acid
- Fw:
-
Fresh weight
- GUS:
-
β-glucuronidase stain
- IPTG:
-
Isopropyl β-D-1-thiogalactopyranoside
- MDA:
-
Monodehydroascorbate
- PBS:
-
Phosphate buffer solution
- Pn:
-
Net photosynthetic rate
- POD:
-
Peroxidase
- rAgAPX1:
-
recombinant AgAPX1 protein
- ROS:
-
Reactive oxygen species
- rpm:
-
revolution per minute
- RWC:
-
Relative water content
- SOD:
-
Superoxide dismutase
References
Gill SS, Tuteja N. Reactive oxygen species and antioxidant machinery in abiotic stress tolerance in crop plants. Plant Physiol Biochem. 2010;48(12):909–30.
Petrov VD, Van Breusegem F. Hydrogen peroxide-a central hub for information flow in plant cells. AoB Plants. 2012;2012(1):pls014.
Song XS, Hu WH, Mao WH, Ogweno JO, Zhou YH, Yu JQ. Response of ascorbate peroxidase isoenzymes and ascorbate regeneration system to abiotic stresses in Cucumis sativus L. Plant Physiol Biochem. 2005;43(12):1082–8.
Yadav P. Partial purification and characterization of ascorbate peroxidase from ripening ber (Ziziphus mauritiana L) fruits. Afr J Biotechnol. 2014;13(32):3323–31.
Ishikawa T, Shigeoka S. Recent advances in ascorbate biosynthesis and the physiological significance of ascorbate peroxidase in photosynthesizing organisms. Biosci Biotechnol Biochem. 2008;72(5):1143–54.
Lazzarotto F, Teixeira FK, Rosa SB, Dunand C, Fernandes CL, Fontenele AV, Silveira JA, Verli H, Margis R, Margis-Pinheiro M. Ascorbate peroxidase-related (APx-R) is a new heme-containing protein functionally associated with ascorbate peroxidase but evolutionarily divergent. New Phytol. 2011;191(1):234–50.
Lobo V, Patil A, Phatak A, Chandra N. Free radicals, antioxidants and functional foods: impact on human health. Pharmacogn Rev. 2010;4(8):118–26.
Braun HJ, Rajaram S, Ginkel MV. CIMMYT's approach to breeding for wide adaptation. Euphytica. 1996;92(1–2):175–83.
Thoen MP, Davila Olivas NH, Kloth KJ, Coolen S, Huang PP, Aarts MG, Bac-Molenaar JA, Bakker J, Bouwmeester HJ, Broekgaarden C, et al. Genetic architecture of plant stress resistance: multi-trait genome-wide association mapping. New Phytol. 2017;213(3):1346–62.
Guan Q, Wang Z, Wang X, Takano T, Liu S. A peroxisomal APX from Puccinellia tenuiflora improves the abiotic stress tolerance of transgenic Arabidopsis thaliana through decreasing of H2O2 accumulation. J Plant Physiol. 2015;175:183–91.
Faize M, Burgos L, Faize L, Piqueras A, Nicolas E, Barbaespin G, Clementemoreno MJ, Alcobendas R, Artlip T, Hernandez JA. Involvement of cytosolic ascorbate peroxidase and cu/Zn-superoxide dismutase for improved tolerance against drought stress. J Exp Bot. 2011;62(8):2599–613.
Chiang CM, Chien HL, Chen LFO, Hsiung TC, Chiang MC, Chen SP, Lin KH. Overexpression of the genes coding ascorbate peroxidase from Brassica campestris enhances heat tolerance in transgenic Arabidopsis thaliana. Biol Plantarum. 2015;59(2):305–15.
Hu Y, Wu Q, Sprague SA, Park J, Oh M, Rajashekar CB, Koiwa H, Nakata PA, Cheng N, Hirschi KD, White FF, Park S. Tomato expressing Arabidopsis glutaredoxin gene AtGRXS17 confers tolerance to chillingstress via modulating cold responsive components. Hortic Res. 2015;2:15051.
Wang LY, Zhang QY, Wang F, Meng X, Meng QW. Ascorbate plays a key role in alleviating low temperature-induced oxidative stress in Arabidopsis. Photosynthetica. 2012;50(4):602–12.
Mittler R, Zilinskas BA. Purification and characterization of pea cytosolic ascorbate peroxidase. Plant Physiol. 1991;97(3):962–8.
Mohammadian MA, Largani ZK, Sajedi RH. Quantitative and qualitative comparison of antioxidant activity in the flavedo tissue of three cultivars of citrus fruit under cold stress. Aust J Crop Sci. 2012;6(3):402–6.
Shigeoka S, Ishikawa T, Tamoi M, Miyagawa Y, Takeda T, Yabuta Y, Yoshimura K. Regulation and function of ascorbate peroxidase isoenzymes. J Exp Bot. 2002;53(372):1305–19.
Chen GX, Asada K. Ascorbate peroxidase in tea leaves: occurrence of two isozymes and the differences in their enzymatic and molecular properties. Plant Cell Physiol. 1989;30(7):987–98.
Lu Z, Takano T, Liu S. Purification and characterization of two ascorbate peroxidases of rice (Oryza sativa L.) expressed in Escherichia coli. Biotechnol Lett. 2005;27(1):63–7.
Ishikawa T, Takeda T, Shigeoka S. Purification and characterization of cytosolic ascorbate peroxidase from komatsuna (Brassica rapa). Plant Sci. 1996;120(1):11–8.
Leonardis SD, Dipierro N, Dipierro S. Purification and characterization of an ascorbate peroxidase from potato tuber mitochondria. Plant Physiol Biochem. 2000;38(10):773–9.
Sun MH, Xu Y, Huang JG, Jiang ZS, Shu HR, Wang HS, Zhang SZ. Global identification, classification, and expression analysis of MAPKKK genes: functional characterization of MdRaf5 reveals evolution and drought-responsive profile in apple. Sci Rep. 2017;7(1):13511.
Athar HUR, Khan A, Ashraf M. Exogenously applied ascorbic acid alleviates salt-induced oxidative stress in wheat. Environ Exp Bot. 2008;63(3):224–31.
Shalata A, Neumann PM. Exogenous ascorbic acid (vitamin C) increases resistance to salt stress and reduces lipid peroxidation. J Exp Bot. 2001;52(364):2207–11.
Yan H, Li Q, Park SC, Wang X, Liu YJ, Zhang YG, Tang W, Kou M, Ma DF. Overexpression of CuZnSOD and APX enhance salt stress tolerance in sweet potato. Plant Physiol Biochem. 2016;109:20–7.
Jiang Q, Xu ZS, Wang F, Li MY, Ma J, Xiong AS. Effects of abiotic stresses on the expression of Lhcb1 gene and photosynthesis of Oenanthe javanica and Apium graveolens. Biol Plantarum. 2014;58(2):256–64.
Li MY, Hou XL, Wang F, Tan GF, Xu ZS, Xiong AS. Advances in the research of celery, an important Apiaceae vegetable crop. Crit Rev Biotechnol. 2018;38(2):172–83.
Li MY, Feng W, Qian J, Jing M, Xiong AS. Identification of SSRs and differentially expressed genes in two cultivars of celery (Apium graveolens L.) by deep transcriptome sequencing. Hortic Res. 2014;1:10.
Huang W, Wang GL, Li H, Wang F, Xu ZS, Xiong AS. Transcriptional profiling of genes involved in ascorbic acid biosynthesis, recycling, and degradation during three leaf developmental stages in celery. Mol Gen Genomics. 2016;291(6):2131–43.
Robert X, Gouet P. Deciphering key features in protein structures with the new ENDscript server. Nucleic Acids Res. 2014;42(Web Server issue):W320–4.
Xing Y, Jia WS, Zhang JH. AtMEK1 mediates stress-induced gene expression of CAT1 catalase by triggering H2O2 production in Arabidopsis. J Exp Bot. 2007;58(11):2969–81.
Cantarello C, Volpe V, Azzolin C, Bertea C. Modulation of enzyme activities and expression of genes related to primary and secondary metabolism in response to UV-B stress in cucumber (Cucumis sativus L.). J Plant Interact. 2005;1(3):151–61.
Mittler R. Oxidative stress, antioxidants and stress tolerance. Trends Plant Sci. 2002;7(9):405–10.
Senthil Kumar R, Shen CH, Wu PY, Suresh Kumar S, Hua MS, Yeh KW. Nitric oxide participates in plant flowering repression by ascorbate. Sci Rep. 2016;6:35246.
Sofo A, Scopa A, Nuzzaci M, Vitti A. Ascorbate peroxidase and catalase activities and their genetic regulation in plants subjected to drought and salinity stresses. Int J Mol Sci. 2015;16(6):13561–78.
Wang HS, Yu C, Zhu ZJ, Yu XC. Overexpression in tobacco of a tomato GMPase gene improves tolerance to both low and high temperature stress by enhancing antioxidation capacity. Plant Cell Rep. 2011;30(6):1029–40.
Sohn SI, Kim JC, Lee KW, Rhee HI, Wang MH. Molecular cloning and expression of a cDNA encoding cytosolic ascorbate peroxidase from Pimpinella brachycarpa. J Plant Physiol. 2002;159(9):1029–35.
Sajitha Rajan S, Murugan K. Purification and kinetic characterization of the liverwort Pallavicinia lyelli (hook.) S. gray. Cytosolic ascorbate peroxidase. Plant Physiol Biochem. 2010;48(9):758–63.
Feng K, Xu ZS, Liu JX, Li JW, Wang F, Xiong AS. Isolation, purification, and characterization of AgUCGalT1, a galactosyltransferase involved in anthocyanin galactosylation in purple celery (Apium graveolens L.). Planta. 2018;247(6):1363–75.
Xu ZS, Jing M, Feng W, Ma HY, Wang QX, Xiong AS. Identification and characterization of DcUCGalT1, a galactosyltransferase responsible for anthocyanin galactosylation in purple carrot (Daucus carota L.) taproots. Sci Rep. 2016;6:27356.
Allen RD. Dissection of oxidative stress tolerance using transgenic plants. Plant Physiol. 1995;107(4):1049–54.
Yoshimura K, Yabuta Y, Ishikawa T, Shigeoka S. Expression of spinach ascorbate peroxidase isoenzymes in response to oxidative stresses. Plant Physiol. 2000;123(1):223–34.
Mishra S, Bandhu AD. Effect of short-term exposure to NaCl on photochemical activity and antioxidant enzymes in Bruguiera parviflora, a non-secretor mangrove. Acta Physiol Plant. 2004;26(3):317–26.
Bhatt D, Saxena SC, Jain S, Dobriyal AK, Majee M, Arora S. Cloning, expression and functional validation of drought inducible ascorbate peroxidase (Ec-apx1) from Eleusine coracana. Mol Biol Rep. 2013;40(2):1155–65.
Akbudak MA, Filiz E, Vatansever R, Kontbay K. Genome-wide identification and expression profiling of ascorbate peroxidase (APX) and glutathione peroxidase (GPX) genes under drought stress in sorghum (Sorghum bicolor L.). J Plant Growth Regul. 2018;37(3):925–36.
Akcay UC, Ercan O, Kavas M, Yildiz L, Yilmaz C, Oktem HA, Yucel M. Drought-induced oxidative damage and antioxidant responses in peanut (Arachis hypogaea L.) seedlings. Plant Growth Regul. 2010;61(1):21–8.
Palma JM, Jiménez A, Sandalio LM, Corpas FJ, Lundqvist M, Gómez M, Sevilla F, del Río LA. Antioxidative enzymes from chloroplasts, mitochondria, and peroxisomes during leaf senescence of nodulated pea plants. J Exp Bot. 2006;57(8):1747–58.
Palma JM, Sevilla F, Jiménez A, Río LAD, Corpas FJ, Morales PÁD, Camejo DM. Physiology of pepper fruits and the metabolism of antioxidants: chloroplasts, mitocondria and peroxisomes. Ann Bot. 2015;116(4):627–36.
Caverzan A, Passaia G, Rosa SB, Ribeiro CW, Lazzarotto F, Margis-Pinheiro M. Plant responses to stresses: role of ascorbate peroxidase in the antioxidant protection. Genet Mol Biol. 2012;35(4):1011–9.
Wang J, Wu B, Yin H, Fan Z, Li X, Sui N, He L, Li J. Overexpression of CaAPX induces orchestrated reactive oxygen scavenging and enhances cold and heat tolerances in tobacco. Biomed Res Int. 2017;2017:4049534.
Azooz MM, Ismail AM, Elhamd MFA. Growth, lipid peroxidation and antioxidant enzyme activities as a selection criterion for the salt tolerance of maize cultivars grown under salinity stress. Int J Agric Biol. 2009;11(1):572–7.
Li K, Pang CH, Ding F, Sui N, Feng ZT, Wang BS. Overexpression of Suaeda salsa stroma ascorbate peroxidase in Arabidopsis chloroplasts enhances salt tolerance of plants. S Afr J Bot. 2012;78(1–2):235–45.
Zhang GY, Liu RR, Zhang CQ, Tang KX, Sun MF, Yan GH, Liu QQ. Manipulation of the rice L -galactose pathway: evaluation of the effects of transgene overexpression on ascorbate accumulation and abiotic stress tolerance. PLoS One. 2015;10(5):e0125870.
Li QZ, Li YS, Li CH, Yu XC. Enhanced ascorbic acid accumulation through overexpression of dehydroascorbate reductase confers tolerance to methyl viologen and salt stresses in tomato. Czech J Genet Plant. 2012;48(2):74–86.
Noctor G, Foyer CH. ASCORBATE AND GLUTATHIONE: Keeping active oxygen under control. Annu Rev Plant Physiol Plant Mol Biol. 1998;49(1):249–79.
Selote DS, Khanna-Chopra R. Drought acclimation confers oxidative stress tolerance by inducing co-ordinated antioxidant defense at cellular and subcellular level in leaves of wheat seedlings. Physiol Planta. 2006;127(3):494–506.
Melotto M, Underwood W, Koczan J, Nomura K, He SY. Plant stomata function in innate immunity against bacterial invasion. Cell. 2006;126(5):969–80.
Huang W, Zhang SB, Hu H. Sun leaves up-regulate the photorespiratory pathway to maintain a high rate of CO2 assimilation in tobacco. Front Plant Sci. 2014;5:688.
Zhou Y, Huang L, Zhang Y, Shi K, Yu J, Nogués S. Chill-induced decrease in capacity of RuBP carboxylation and associated H2O2 accumulation in cucumber leaves are alleviated by grafting onto figleaf gourd. Ann Bot. 2007;100(4):839–48.
Gu JF, Qiu M, Yang JC. Enhanced tolerance to drought in transgenic rice plants overexpressing C4 photosynthesis enzymes. Crop J. 2013;1(2):105–14.
Deng BL, Dong HS. Ectopic expression of riboflavin-binding protein gene TsRfBP paradoxically enhances both plant growth and drought tolerance in transgenic Arabidopsis thaliana. J Plant Growth Regul. 2013;32(1):170–81.
Lee DH, Oh DC, Oh YS, Malinverni JC, Kukor JJ, Kahng HY. Cloning and characterization of monofunctional catalase from photosynthetic bacterium Rhodospirillum rubrum S1. J Microbiol Biotechnol. 2007;17(9):1460–8.
Murgia I, Tarantino D, Vannini C, Bracale M, Carravieri S, Soave C. Arabidopsis thaliana plants overexpressing thylakoidal ascorbate peroxidase show increased resistance to Paraquat-induced photooxidative stress and to nitric oxide-induced cell death. Plant J. 2004;38(6):940–53.
Tang W, Luo XY, Sanmuels V. Gene silencing: double-stranded RNA mediated mRNA degradation and gene inactivation. Cell Res. 2001;11(3):181–6.
Xu ZS, Feng K, Xiong AS. CRISPR/Cas9-mediated multiply targeted mutagenesis in orange and purple carrot plants. Mol Biotechnol. 2019;61(3):191–9.
Jia XL, Wang GL, Xiong F, Yu XR, Xu ZS, Wang F, Xiong AS. De novo assembly, transcriptome characterization, lignin accumulation, and anatomic characteristics: novel insights into lignin biosynthesis during celery leaf development. Sci Rep. 2015;5:8259.
Feng K, Hou XL, Li MY, Jiang Q, Xu ZS, Liu JX, Xiong AS. CeleryDB: a genomic database for celery. Database. 2018;2018:bay070.
Tamura K, Stecher G, Peterson D, Filipski A, Kumar S. MEGA6: molecular evolutionary genetics analysis version 6.0. Mol Biol Evol. 2013;30(12):2725–9.
Li MY, Feng W, Qian J, Wang GL, Chang T, Xiong AS. Validation and comparison of reference genes for qPCR normalization of celery (Apium graveolens) at different development stages. Front Plant Sci. 2016;7:313.
Pfaffl MW. A new mathematical model for relative quantification in real-time RT-PCR. Nucleic Acids Res. 2001;29(9):e45.
Laemmli UK. Cleavage of structural proteins during the assembly of the head of bacteriophage T4. Nature. 1970;227(5259):680–5.
Nakano Y, Asada K. Purification of ascorbate peroxidase in spinach chloroplasts; its inactivation in ascorbate-depleted medium and reactivation by monodehydroascorbate radical. Plant Cell Physiol. 1987;28(1):131–40.
Yoo SD, Cho YH, Sheen J. Arabidopsis mesophyll protoplasts: a versatile cell system for transient gene expression analysis. Nat Protoc. 2007;2(7):1565–72.
Zhang X, Henriques R, Lin SS, Niu QW, Chua NH. Agrobacterium-mediated transformation of Arabidopsis thaliana using the floral dip method. Nat Protoc. 2006;1(2):641–6.
Li H, Liu ZW, Wu ZJ, Wang YX, Teng RM, Zhuang J. Differentially expressed protein and gene analysis revealed the effects of temperature on changes in ascorbic acid metabolism in harvested tea leaves. Hortic Res. 2018;5:65.
Wang Y, Gao C, Liang Y, Yang C, Liu G. A novel bZIP gene from Tamarix hispida mediates physiological responses to salt stress in tobacco plants. J Plant Physiol. 2010;167(3):222–30.
Sahu GK, Sabat SC. Changes in growth, pigment content and antioxidants in the root and leaf tissues of wheat plants under the influence of exogenous salicylic acid. Braz J Plant Physiol. 2011;23(3):209–18.
Lichtenthaler HK, Wellburn AR. Determinations of total carotenoids and cholorphylls a and b of leaf extracts in different solvents. Biochem Soc Trans. 1983;11(5):591–2.
Griffiths A, Bray EA. Shoot induction of ABA-requiring genes in response to soil drying. J Exp Bot. 1996;47(10):1525–31.
Acknowledgements
Not applicable.
Funding
This study was financially supported by Jiangsu Agricultural Science and Technology Innovation Fund [CX (18)2007], New Century Excellent Talents in University (NCET-11-0670), National Natural Science Foundation of China (31272175), Priority Academic Program Development of Jiangsu Higher Education Institutions Project (PAPD).
Author information
Authors and Affiliations
Contributions
ASX and JXL initiated and designed the research, JXL, AQD, HL, and QQY performed the experiments; JXL, KF, and ZSX analyzed the data; ASX contributed reagents/materials/analysis tools; JXL wrote the paper; ASX and KF revised the paper. All authors read and approved the final manuscript.
Corresponding author
Ethics declarations
Ethics approval and consent to participate
Not applicable.
Consent for publication
Not applicable.
Competing interests
The authors declare that they have no competing interests.
Additional information
Publisher’s Note
Springer Nature remains neutral with regard to jurisdictional claims in published maps and institutional affiliations.
Supplementary information
Additional file 1
Nucleotide acid and deduced amino acid sequence of AgAPX1 from celery.
Additional file 2
SDS-PAGE analysis of the purified AgAPX1 from expression in E. coli. Lane1, standard markers; Lane2, total soluble protein from BL21(DE3) cells containing the AgAPX1 plasmid without induction; Lane3, total soluble protein from BL21(DE3) cells containing the AgAPX1 plasmid with IPTG; Lane 4, purified AgAPX1. The arrow indicates the AgAPX1.
Additional file 3
Ascorbate content in transgenic Arabidopsis and wild-type (WT) leaves detected by HPLC. a WT plants; b AgAPX1–4 transgenic line; c AgAPX1–16 transgenic line.
Rights and permissions
Open Access This article is distributed under the terms of the Creative Commons Attribution 4.0 International License (http://creativecommons.org/licenses/by/4.0/), which permits unrestricted use, distribution, and reproduction in any medium, provided you give appropriate credit to the original author(s) and the source, provide a link to the Creative Commons license, and indicate if changes were made. The Creative Commons Public Domain Dedication waiver (http://creativecommons.org/publicdomain/zero/1.0/) applies to the data made available in this article, unless otherwise stated.
About this article

Cite this article
Liu, JX., Feng, K., Duan, AQ. et al. Isolation, purification and characterization of an ascorbate peroxidase from celery and overexpression of the AgAPX1 gene enhanced ascorbate content and drought tolerance in Arabidopsis. BMC Plant Biol 19, 488 (2019). https://doi.org/10.1186/s12870-019-2095-1
Received:
Accepted:
Published:
DOI: https://doi.org/10.1186/s12870-019-2095-1