
Abstract
Background
Soybean is a paleopolyploid that has undergone two whole genome duplication events. Gene duplication is a type of genomic change that can lead to novel functions of pre-existing genes. Chalcone synthase (CHS) is the plant-specific type III polyketide synthase that catalyzes the first committed step in (iso)flavonoid biosynthesis in plants.
Results
Here we performed a genome-wide search of CHS genes in soybean, and identified 21 GmCHS loci containing 14 unique GmCHS (GmCHS1-GmCHS14) that included 5 newly identified GmCHSs (GmCHS10-GmCHS14). Furthermore, 3 copies of GmCHS3 and 2 copies of GmCHS4 were found in soybean. Analysis of gene structure of GmCHSs revealed the presence of a single intron in protein-coding regions except for GmCHS12 that contained 3 introns. Even though GmCHS genes are located on 8 different chromosomes, a large number of these genes are present on chromosome 8 where they form 3 distinct clusters. Expression analysis of GmCHS genes revealed tissue-specific expression pattern, and that some GmCHS isoforms localize in the cytoplasm and the nucleus while other isoforms are restricted to cytoplasm only.
Conclusion
Overall, we have identified 21 GmCHS loci with 14 unique GmCHS genes in the soybean genome. Their gene structures and genomic organization together with the spatio-temporal expression and protein localization suggest their importance in the production of downstream metabolites such as (iso)flavonoids and their derived phytoalexins.
Background
Whole genome duplication has occurred multiple times over the past 200 millions of years of plant evolution leading to gene duplications. The availability of whole genome sequences of a large number of plant species has shown that approximately 64.5% of plant genes are duplicated (reviewed in [1]).The gene duplication event subsequently results in an increase of both genome size and the entire gene set thereby influencing the architecture and function of many genomes [2, 3]. During the process of adaptation or evolution under reduced selective constraint, duplicated genes acquire novel functions of pre-existing genes [4, 5]. New genes can also arise de novo from intergenic space [6] or new transcriptional regulatory sites on a promoter that alters gene expression [7].The potential cis-elements in the promoter regions can also be subject to changes in sequence and specificity in response to developmental stage and environment [8]. Although members of a gene family contain very high sequence identity, their temporal and spatial expression level may differ.
Polyketide synthases (PKS) play a critical role in bridging primary and secondary metabolism in plants by catalyzing the sequential condensation of two-carbon acetate units into a growing polyketide chain. PKS enzymes are classified into type I, II, and III based on their catalytic mechanism, domain structure, and subunit organization. While type I and II PKSs are found in bacteria and fungi, type III PKSs are predominantly plant-specific. Type III PKSs act in homodimers, contain a Cys-His-Asn catalytic tetrad in the active site [9,10,11], and unlike type I and II PKSs, they do not require acyl carrier for their function [12]. These enzymes are known as chalcone synthase (CHS)-like enzymes that include CHS, stilbene synthase (STS), 2-pyronesynthase, acridone synthase, benzophenone synthase, bibenzyle synthase, phlorisovalerophenone synthase, benzalacetone synthase, C-methylchalcone synthase, homoeriodictyol/eriodictyol synthase, aloesone synthase, coumaroyltriacetic acid synthase, hexaketide synthase, biphenyl synthase, stilbene carboxylate synthase, octaketide synthase, penta ketide chromone synthase, and anther-specific CHS-like [9]. Among these PKSs, CHS and STS are structurally similar [11, 13], plant-specific and catalyze condensation reactions of p-coumaroyl-CoA and 3 acetyl molecules from malonyl-CoA to produce a common tetraketide intermediate which undergoes a claisen condensation reaction catalyzed by CHS [11] or an aldol cyclization catalyzed by STS [14] to give rise to naringenin chalcone and resveratrol, respectively (Fig. 1). In legume plants, CHS co-acts with a legume-specific enzyme, chalcone reductase, to produce isoliquiritigenin chalcone. The production of these chalcones is the first committed step in the biosynthesis of a plethora of (iso)flavonoids, which have been shown to play important roles in protection against various biotic and abiotic stress, flower pigmentation, nitrogen fixation, pollen fertility and seed coat color.

Reactions catalyzed by CHS and STS. Both CHS and STS use the same substrates p-coumaroyl-CoA and 3 molecules of malonyl-CoA and convert them to either naringenin chalcone or resveratrol, respectively. In legumes, CHS coacts with a legume-specific enzyme chalcone reductase (CHR) to produce isoliquiritigenin chalcone
In soybean, seed coat color is one of the important traits for variety development. The CHS gene family has been extensively studied as changes in their expression impacts seed coat pigmentation [15]. Soybean is a paleopolyploid that has undergone two whole genome duplication events [16,17,18] with 75% of genes present in multi-gene families [19]. Earlier, CHS superfamily with 9 members was reported in soybean [20]. Here we performed a genome-wide search of CHS genes in soybean and identified 21 GmCHS loci with 14 unique genes in the genome. In addition to the previously known 9 GmCHS, we report 5 new GmCHSs in soybean along with their gene architecture, phylogeny, gene expression and protein localization. The results provide evidences towards functional divergence of GmCHS that are involved in the production of many important compounds in soybean.
Results
The GmCHS gene family contains 14 putative members
A first step towards identifying members of GmCHS gene family, we used a keyword search ‘chalcone synthase’ within the annotated G. max Wm82.a2.v1 genome on Phytozome. This resulted into 1516 genes and 2635 ontologies match. This large number of genes and ontology match was due to the inclusion of all the annotations in the soybean genome database with ‘chalcone’ and/or ‘synthase’. In the list of 2635 ontologies, an ontology with the words ‘chalcone’and ‘synthase’ (PANTHER IDPTHR11877:SF27) was identified which was selected to find other related GmCHSs using the ‘shared annotation’ function in Phytozome. This process identified a total of 19 GmCHS genes that included previously identified 9 GmCHSs [15]. To ensure that all CHS genes were identified in soybean, each GmCHS was used as a query for a BLAST search which identified two additional GmCHSs (Glyma.09G074900 and Glyma.13G034300), making a total of 21 CHS loci in soybean genome. Based on the RNAseq data available in the public domain, an expression analysis of GmCHS genes was performed. No transcripts for 4 GmCHS genes (Glyma.05G153100, Glyma.09G074900, Glyma.11G097900 and Glyma.13G034300) were detected in any tissue suggesting them as pseudogenes. The sequence comparison of the GmCHS gene family members revealed that there are three copies of GmCHS3 (Glyma.08G109300, Glyma.08G110900 and Glyma.08G110300) and two copies of GmCHS4 (Glyma.08G110700 and Glyma.08G110500). Altogether, we found a total of 14 unique GmCHS genes in the soybean genome. These GmCHS genes encode proteins with a calculated molecular mass ranging from 37 to 45 kDa. Detailed characteristics of GmCHS genes are shown in Table 1.
An alignment of deduced protein sequences of GmCHSs revealed very high sequence identity in the entire region. Among the GmCHSs, GmCHS14 was most diverse and showed only 43 to 52.9% sequence identity at amino acid level with other GmCHS isoforms. Pairwise percentage identity of other GmCHSs at amino acid and nucleotide levels varied from 73.4 to 100% and 67.7 to 100%, respectively (Additional file 1: Table S1). Since there are 3 copies of GmCHS3 and 2 copies of GmCHS4, we analyzed the promoter regions (1000 bp upstream of translational start site) of all GmCHSs. A pairwise sequence comparison between all candidate gene promoters showed sequence identity ranging from 0.4 to 100% (Additional file 2: Table S2). Even though coding region DNA sequence identities between the 3 copies of GmCHS3 range from 99.9 to 100%, their promoter sequence differ significantly (2.6 to 48.9% identity). Therefore, we named the 3 copies of GmCHS3 as GmCHS3a (Glyma.08G109300), GmCHS3b (Glyma.08G110900), and GmCHS3c (Glyma.08G110300). Similarly, the promoter sequences of two copies of GmCHS4 are 81.6% identical, were named as GmCHS4a (Glyma.08G110700) and GmCHS4b (Glyma.08G110500). Despite that GmCHS5 and GmCHS12 coding region sequences only share 87.4% identity, their promoter regions (upto 1000 bp upstream of translational start site) contain 100% identical sequence.
Sequence comparison and phylogenetic analysis of GmCHS
The crystal structure of CHS from Medicago sativa (MsCHS2) has elucidated the importance of four active site residues (Cys 164, Phe 215, His 303 and Asn 336) where the Cys-His-Asn triad is critical for substrate binding [11]. To evaluate if GmCHSs contain the active site residues and CHS/STS signature motif (WGVLFGFGPGLT), we performed a sequence alignment of all putative GmCHSs using their deduced amino acid sequence with MsCHS2. The result revealed that the PKS type III active sites of the enzymes are conserved among all 14 GmCHS (Fig. 2). The CHS/STS signature motif was conserved in all GmCHSs except for GmCHS14 where four amino acid substitutions (V369I, F371 L, L377 V and T278A) were found. The product and malonyl-CoA binding sites are also present in all GmCHS proteins except GmCHS14. These findings suggest that GmCHS14 may have a different function than its isoforms. Furthermore, GmCHS12 contains all the critical residues necessary for CHS, but it has 3 large deletions within its sequence.

Analysis of deduced aminoacid sequences of GmCHSs. Multiple sequence alignment of amino acid sequences of GmCHSs and CHS2 from alfalfa (MsCHS2) were performed using ClustalΟ. Identical residues are shown in black and similar residues are in grey. A hyphen indicates a gap. Active site residues are highlighted in yellow, malony-CoA binding sites are highlighted in blue and product binding residues are shown in green. The characteristic CHS signature (WGVLFGFGPGLT) is indicated by a red box
To elucidate the evolutionary relationship within GmCHS isoforms and with CHS from other plant species, we performed a phylogenetic analysis by comparing the amino acid sequences of 14 putative GmCHSs along with previously characterized CHS, CHS-like and STS proteins from other plant species. As shown in Fig. 3, GmCHSs clustered into 4 distinct groups. Group 1 consisted of 10 GmCHSs where 6 of them (GmCHS1, GmCHS2, GmCHS3, GmCHS9, GmCHS4 and GmCHS5) are tightly clustered, and except for GmCHS2, other 5 GmCHSs reside on chromosome 8. Group 2 contained GmCHS7 and GmCHS8 which formed a close clade with previously characterized legume-specific CHSs, PvCHS17 and MsCHS2. Group 3 and group 5 contained GmCHS13 and GmCHS14, respectively. GmCHS14 was much closer to STS from Vitis riparia, V. vinifera, and Arachis hypogaea in the evolutionary tree. CHSs from monocots such as rice (OsCHS1, OsCHS2, and OsCHS3) and maize (ZmCHS) formed a separate clade (group 4). CHS-like proteins from different species including Arabidopsis CHS formed a distinct clade from most of the known CHS in the phylogenetic tree demonstrating the divergent of CHS super family in plants.

Molecular phylogenetic analysis of the deduced amino acid of GmCHS. The deduced amino acid sequences of the GmCHSs from soybean were aligned with characterized CHS and CHS-like proteins from other plant species and the evolutionary tree was generated using the Neighbor-Joining method in MEGA7 [45]. The percentage of replicate trees in which the associated taxa clustered together in the bootstrap test is shown next to the branches. Scale bar indicates branch length representing residue substitution per site. GmCHS are indicated in bold. At, Arabidopsis thaliana; Os, Oryza sativa; Ms., Medicago sativa; Mt., Medicago truncatula; Md, Malus domestica; Pv, Phaseolus vulgaris; Vr, Vitis riparia; Vv, Vitis vinifera; Ah, Arachis hypogaea; Pr,Pinu sradiata; Hp, Hypericum perforatum; Ns, Nicotiana sylvestris; Hv, Hordeum vulgare; Ta,Triticum aestivum; Ata, Aegilops tauschii; AhCHL, Arabidopsis halleri; Pn, Psilotum nudum; Nb, Nicotiana benthamiana; Nt, Nicotiana tobaccum; Zm, Zea mays
To determine the selective evolutionary pressure on the divergence of GmCHS genes, we obtained 40,972 duplicated genomic regions with non-synonymous (Ka) and synonymous (Ks) values for each duplicated gene pairs in soybean genome from Plant genome duplication database (Additional file 3: Table S3). Extraction of duplicated GmCHS genes from the list of 40,972 genes led to 3 duplicated GmCHS gene pairs: i) GmCHS5 and Glyma.05G153100 (pseudogene), ii) GmCHS7 and GmCHS8 and iii) GmCHS10 and GmCHS11 (Table 2). Genes with purifying selection during evolution have Ka/Ks value less than 1. The Ka/Ks values for the duplicated GmCHS gene pairs ranged from 0.065 to 0.549 (Table 2) indicating that they may have acquired limited functional divergence following the duplication events.
Chromosomal arrangement and gene structure of GmCHSs
The 21 GmCHSs including 14 unique genes and 3 duplicate copies are distributed on 8 different chromosomes in soybean. Gene density in these 8 chromosomes is even (one gene per chromosome) except for chromosome 1 and 8 which contain 2 and 9 GmCHS genes, respectively (Table 1). The 9 GmCHS genes on chromosome 8 are located within a 135 kb gene rich region that contained a total of 18 genes. As shown in Fig. 4, the 9 GmCHSs on chromosome 8 form 3 distinct clusters with each cluster containing a copy of GmCHS3. Cluster 1 contains GmCHS5, GmCHS3a, GmCHS1 and GmCHS9 within a 15 kb region where they are arranged in tail to tail, head to head or head to tail orientations. Cluster 2 contains GmCHS3c and GmCHS12 arranged tail to tail. Lastly, a 14.8 kb region at the location 8,504,479..8519303 on chromosome 8 forms cluster 3 that contains 2 copies of GmCHS4 (GmCHS4b and GmCHS4a) arranged in the head to head orientation and GmCHS3b. Detailed information on all 18 genes within the 135 kb region on chromosome 8 is shown in Additional file 4: Table S4.

Schematic diagram showing GmCHS gene clusters on chromosome 8. A 135 kb gene rich region of chromosome 8 showing GmCHS gene clusters (cluster 1–3) is shown. Arrows represent each GmCHS locus. Red and blue arrows indicate the GmCHS genes in ‘+’ and ‘-’ strand, respectively drawn to scale. Numbers on the chromosome are in bp units
Analysis of gene structure of GmCHS genes revealed 2 exons and 1 intron except for GmCHS12 that contained 4 exons and 3 introns (Fig. 5). Even though the majority of GmCHSs contained a single intron, their intron size varied within the family members ranging from 121 to 4347 nucleotides. Additionally, the presence of a single intron in GmCHS3a 3’UTR and 2 introns in GmCHS2 5’UTR was found.

Schematic diagrams of GmCHS gene structures. GmCHS gene structures with predicted alternate transcripts were compiled from Phytozome database (https://phytozome.jgi.doe.gov/pz/portal.html#!info?alias=Org_Gmax). The black and green boxes represent UTRs and exons, respectively, while lines indicate introns. Right pointing arrows indicate ‘+’ strand while left pointing arrows indicate ‘-’ strand, relative to the genome sequence. Gene structure images are drawn to scale as indicated
Expression analysis of GmCHS gene family
To determine the tissue-specific gene expression patterns of the GmCHS gene family, we used two sets of the publicly available genome-wide transcript profiling data of soybean tissue as a resource [21,22,23]. The Libault et al. [21] dataset consisted of the transcript abundance in soybean tissues such as flower, shoot apical meristem, seed, pod, stem, root, nodule, leaf, and root hair. Fragments perkilobase of transcript per million mapped reads (FPKM) values of GmCHSs in their highly expressed tissues varied from 7.82 to 599.39 (Additional file 5: Table S5). As shown in Fig. 6a, the majority of the GmCHSs were highly expressed in leaves. Transcripts of GmCHS6, GmCHS7, GmCHS8, GmCHS10 and GmCHS11 were abundant in roots compared to other tissues. Accumulation of GmCHS13 transcript was higher in flowers compared to other tissues. The expression patterns of three copies of GmCHS3 displayed differential expression patterns in soybean tissues while the two copies of GmCHS4 showed almost similar expression patterns. Based on the transcriptome data, no expression of GmCHS14 was observed in nodules, while no expression of GmCHS6, GmCHS11 and GmCHS14 was observed in seed tissue. The second dataset by Severin et al. [23] consisted of the transcript abundance in soybean tissues such as root, flower, young leaf, nodule, and pods and seeds at several different developmental stages. Reads per kilobase of transcript per million mapped reads (RPKM) values of GmCHSs in their highly expressed tissues varied from 1.673 (GmCHS12 in seed 21-DAF) to 567.342 (GmCHS7 in roots) (Additional file 5: Table S5). As this study included pod and seed tissue samples at multiple stages of development, it provided a better assessment of expression levels of GmCHS genes in seed tissue compared to the earlier study (compare Fig. 6a and b). In both the datasets, transcripts of GmCHS7, GmCHS8, and GmCHS10 were abundant in roots compared to other tissues. Similarly, GmCHS1, GmCHS9 and GmCHS14 transcripts accumulated at higher levels in leaf tissue. However, some differences in expression patterns of GmCHSs were observed in these two sets of studies. For example, relative transcripts abundance for GmCHS3a, GmCHS4a and GmCHS4b in root tissue did not match in these two studies (Fig. 6a and b).

Tissue-specific expression profile of the GmCHS gene family. The transcriptome data of GmCHS genes in soybean across different tissues were retrieved from a Phytozome database [21], and b Soybase database [23] for heatmap generation. The color scale indicates expression values, green indicating low transcript abundance and red indicating high levels of transcript abundance. Maximum and minimum FPKM or RPKM value for each gene is shown
To validate the RNAseq expression data, we studied the tissue-specific expression of newly discovered GmCHSs along with GmCHS9 by qRT-PCR. RNA isolated from vegetative and reproductive tissues of soybean during the development was subjected to qRT-PCR analysis. Our results correlate with the two previously reported RNAseq studies. As shown in Fig. 7, expression of GmCHS10 was abundant in roots and GmCHS13 in flowers which correlate with the RNAseq data (Fig. 6). A low expression of GmCHS10, GmCHS11, GmCHS13, and GmCHS14 was observed in embryo tissues (30 to 70 DAF) (Fig. 7) and results are consistent with the RNAseq study. Despite that Fig. 6b contained expression of GmCHS genes in seed tissues, only two developmental stages of seeds (28 and 42 DAF) were closer to embryo (30 and 40 DAF) used in our study. To determine the expression divergence of duplicated genes, the gene expression values of the samples (root, nodule, and flower) common in the two publically available RNAseq datasets [21, 23] were analysed by type II one-way ANOVA followed by multiple comparison post hoc Tukey’s test. The results revealed that the expression pattern of GmCHS7 and GmCHS8 duplicated pairs were significantly different than the other GmCHS genes in root, nodule, and flower tissues. However, no such difference was identified for other two duplicated GmCHS gene pairs.
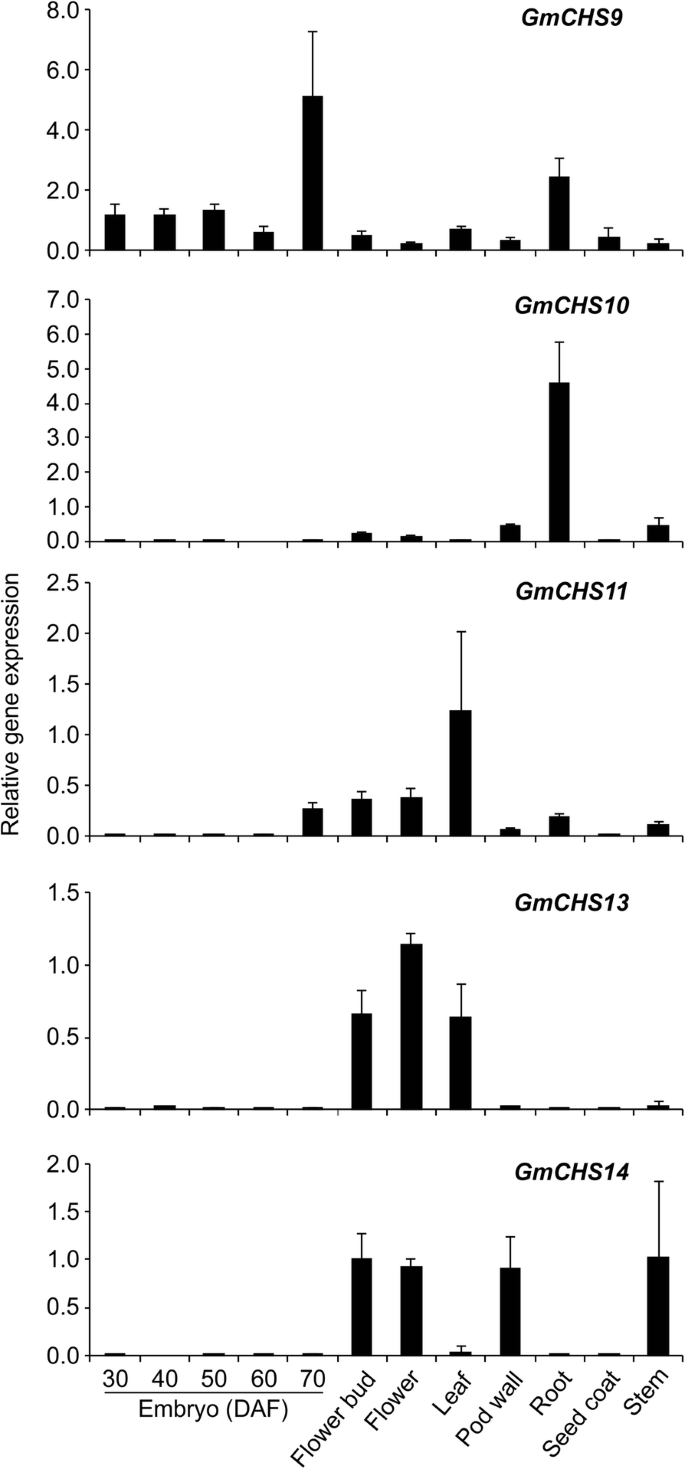
Expression analysis of five GmCHS genes in soybean tissues. Total RNA (1 μg) from soybean root, stem, leaf, flower bud, flower, pod wall, seed coat and embryos (30, 40, 50, 60 and 70 DAF) was used for cDNA synthesis and qPCR using gene-specific primers. Error bars indicate SEM of two biological replicates, with three technical triplicates. Values were normalized against the reference gene CONS4
Subcellular localization of GmCHS isoforms
Previously we reported the dual subcellular localization (cytoplasm and nucleus) of GmCHS8 [24]. Even though all GmCHS isoforms were predicted to be cytosolic, we determined their localization in planta. A translational fusion of full-length GmCHS was created upstream of the dual reporter genes mCherry and YFP (Fig. 8a), and transiently expressed in leaf epidermal cells of N. benthamiana. Attempts to clone GmCHS12 were not successful due to its low level of expression. Therefore, GmCHS12 was not included in the subcellular localization study. To avoid the passive diffusion of GmCHS proteins to the nucleus, a dual reporter vector was created by adding mCherry in the vector pEarlygate101 which increased the size of the fusion protein. As shown in Fig. 8b, all 13 GmCHS proteins were observed in the cytoplasm. Additionally, 5 GmCHSs (GmCHS3, GmCHS5, GmCHS8, GmCHS9 and GmCHS14) were also found in the nucleus.

Subcellular localization of GmCHS family in planta. a A schematic diagram showing double reporter expression vector. b The GmCHS genes were translationally fused upstream of the dual reporter genes, mcherry and YFP, transformed into N. benthamiana by Agrobacterium mediated transformation and visualized by confocal microscopy. Nuclear localization of GmCHSs are shown by white arrow heads. An empty vector control is also included. Scaler bar indicates 25 μm
Discussion
Plant genomes tend to evolve faster than mammals resulting into more dynamics and higher genome diversity [25]. Large plant genome with multi-gene families results from multiple factors such as gene duplication, whole genome duplication and domestication. Most plant species contain small CHS gene families. For example, Arabidopsis genome contains a single CHS gene [26] while Petunia hybrida [27], Ipomea purpurea [28], Gerbera hybrida [29] and Pisum sativum [30] contain 8, 6, 3 and 8 CHS members, respectively. Recently, a CHS gene family containing 14 members were identified in maize [31]. Here we have identified a total of 14 unique CHS genes (GmCHS1-GmCHS14) in the soybean genome. Our genome-wide search in soybean revealed 21 CHS loci that included 3 copies of GmCHS3, 2 copies of GmCHS4 and 4 pseudogenes. The I locus that controls the seed coat color in soybean was previously described to contain two identical clusters (tandem inverted repeats) of CHS1, CHS3 and CHS4 [20]. Such tandem repeats were not found in our analysis of Glycine max Wm82.a2.v1. However, the CHS gene rich region on chromosome 8 contained 9 CHS loci, 5 on the sense strand and 4 on the antisense strand (Fig. 4). Many of the GmCHS gene family members contain very high sequence identity. For example GmCHS4 and GmCHS5 share 99.7% sequence identity at the nucleotide level (Additional file 2: Table S2). It is possible that with such a high sequence identity, together with GmCHS gene organization in the chromosome, this may lead to the inverted repeats and give rise to mutations in the I locus [32].
Members of CHS gene family in other species showed functional variations and tissue-specific expression patterns, for example, among three CHS genes that showed different spatial and temporal regulation in Gerbera hybrida, only GCHS1 contributing to flavonoid biosynthesis [29]. Since CHS and STS use the same substrate and the catalytic active sites area consensus among these proteins, the involvement of these enzymes in either flavonoid or stilbene biosynthesis will not be known until enzyme activity assays are conducted.
CHS forms a homodimer for its enzymatic activity. The CHS homodimer contains two functionally independent active sites. CoA-thioesters and product analogs occupy both active sites of the homodimer in the CHS complex structures. These structures identify the location of the active site at the cleft between the lower and upper domains of each monomer, where few chemically reactive residues are present in the active site [11, 33]. The four conserved amino acid residues, specifically Cys 164, Phe 215, His 303 and Asn 336 (numbering based on MsCHS2), which form active sites in all CHS-related enzymes [11] are conserved among the GmCHS isoforms (Fig. 2). Cys 164 serves as the nucleophile and as the attachment site for polyketide intermediates in both CHS and STS. The nitrogen electron of His 303 is within hydrogen-bonding distance of the sulfur atom of Cys 164 and His 303 most likely acts as a general base during the generation of a nucleophilic thiolate anion from Cys 164. The active site architecture of CHS consists of three interconnected cavities that intersect with these four residues and these cavities include a coumaroyl-binding pocket, CoA-binding tunnel, and a cyclization pocket [11]. Since GmCHS14 sequence differs mostly from other GmCHSs, and it lacks important residues that affect binding and cyclization pockets, it may function differently and may catalyze a different reaction.GmCHS7 and GmCHS8 are possibly the active CHSs in soybean as they share the same clade with PvCHS17 and MsCHS2 in the phylogenetic tree (Fig. 3). GmCHS12 contains several deletions within the sequence and produces a protein with lower molecular mass compared to its other isoforms (Table 1). However, the critical residues necessary for its activity are conserved in GmCHS12 suggesting it may be functionally active.
Gene family members with variation in the cis-architecture of a promoter DNA region result in differential expression patterns within a species. Members of CHS gene family in Gerbera hybrida showed functional variations and tissue- and development-specific expression patterns [29]. Despite that both GCHS1 and GCHS4 are expressed in gerbera petals, only GCHS1 is responsible for flavonoid biosynthesis in gerbera petals while GCHS4 has a role in pigment production in vegetative tissues. Most of the GmCHS transcripts accumulate abundantly in soybean leaves and roots suggesting their importance in these tissues. The expression of these genes in soybean roots is highly important since downstream of the CHS-catalyzed step is the production of isoflavonoids that participate in plant defense mechanisms, and also in the symbiotic relationship between soybean and bacteria for nitrogen fixation. The high expression of GmCHS7 and GmCHS8 in soybean tissues have already been studied [34] which is consistent with the expression analysis reported here (Fig. 6). Most GmCHSs were expressed in soybean leaves and roots which could explain the requirement of these genes in the respective tissues for (iso)flavonoid biosynthesis. Diverse expression of GmCHS genes in soybean tissues may be due to their diverse promoter regions except for GmCHS5 and GmCHS12 as their promoters are 100% identical (Additional file 3: Table S3). Identical promoter regions with conserved cis-regulatory elements could be a result of segmental duplication and it has been observed previously among certain duplicated genes [34]. Gene family members showing diverse gene expression in soybean have been documented. For example, soybean 14–3-3 protein (SGF14s) [35], GmCHR [36] and chalcone isomerase (GmCHIs) [37] family members also display differential expression patterns in soybean tissues.
Our findings that GmCHS isoforms localize to the cytoplasm and nucleus adheres to the co-localization of other (iso)flavonoid enzymes [36,37,38] and isoflavonoid metabolon [24]. Since (iso)flavonoid biosynthesis involves multiple cytochrome P450s that are ER localized and are not in the nucleus, the presence of some GmCHS family members raises the possibility of additional role of these enzymes in the nucleus.
Conclusion
Overall, we have performed a comprehensive analysis of CHS genes present in soybean genome and identified 14 unique GmCHSs where 6 of them along with copies of GmCHS3 and GmCHS4 reside on chromosome 8 in 3 separate clusters. Based on the phylogenetic analysis, GmCHS13 and GmCHS14 are distantly related to other GmCHSs suggesting their diverse roles. Furthermore, temporal and spatial expression of GmCHS members and GmCHS isoform specificity at a sub-cellular level shed light on alternative function of some isoforms.
Methods
Plant material
Nicotiana benthamiana seeds were obtained from Dr. Rima Menassa (London Research and Development Centre, Agriculture and Agri-Food Canada). Seeds were grown in a growth room under a 16 h light/8 h dark cycle at 25 °C/20 °C with relative humidity of 60–70%. For transient expression, the intact leaves of 6 to 8-week old N. benthamiana plants were used.
In silico and phylogenetic analysis
To identify putative GmCHS genes in soybean, the Phytozome database (https://phytozome.jgi.doe.gov/pz/portal.html) [22] was used for a keyword search using ‘chalcone synthase’ in the annotated G. max Wm82.a2.v1 genome. Each CHS identified in the soybean genome was used as a query for a nucleotide BLAST (BLASTn) search. Protein sequences were retrieved for all GmCHSs and their calculated molecular mass was determined using the web-based tool ExPASy (https://web.expasy.org/translate/). Prediction of subcellular localizations was performed using TargetP (http://www.cbs.dtu.dk/services/TargetP/) with default parameters. Duplicated genomic regions and Ka/Ks values for each duplicated genes in soybean genome was obtained from Plant Genome Duplication Database (http://chibba.agtec.uga.edu/duplication/).The duplicated GmCHS gene pairs were extracted manually from the list of duplicated genes in soybean genome.
For phylogenetic analysis, the amino acid sequences were aligned in ClustalΟ and a Neighbour-joining tree was constructed with 1000 bootstrap replications by using MEGA7 [39]. Pairwise nucleotide and amino acid comparison were performed using the sequence identity matrix function in BioEdit Sequence Alignment Editor Version 7.5. Active sites, malonyl-CoA binding sites and product binding sites on sequences of GmCHSs were identified using NCBI conserved domain search (https://www.ncbi.nlm.nih.gov/Structure/cdd/wrpsb.cgi).
Generation of a heat map
Two sets of RNAseq data from different soybean tissues are publically available and the expression values are presented in fragments per kilobase of transcript per million mapped reads (FPKM) or reads per kilobase of transcript per million mapped reads (RPKM). FPKM values of all GmCHSs in soybean tissues were retrieved from Phytozome (https://phytozome.jgi.doe.gov/pz/portal.html) [22]. Raw data for the second set of RNAseq experiment was downloaded from https://www.soybase.org/ [23]. Reads were trimmed, mapped to the soybean reference genome and RPKM values were calculated in CLC genomic workbench (Qiagen, USA).Heatmaps for expression levels of GmCHSs in soybean tissues were generated in R using the heatmap.2 function from the gplots library. The gene expression values for root, pod and flower tissues from two sets of data were used for expression divergence analysis by type II one-way ANOVA followed by multiple comparison post hoc Tukey’s test.
Quantitative RT-PCR analysis
For qRT-PCR studies, RNA was isolated from 12 different soybean tissues according to Wang and Vodkin [40]. Total RNA (1 μg) was reverse transcribed using the ThermoScript™RT-PCR System (Invitrogen, USA). Gene-specific primers sequences for qPCR are in listed in Additional file 6: Table S6. All reactions were performed in three technical replicates, and the expression was normalized to the reference gene CON4 [41]. The experiment included two biological replicates. The data were analyzed using CFX manager (BioRad, USA).
Plasmid construction and subcellular localization
For subcellular localization study, GmCHSs were amplified from soybean cDNA by PCR using gene-specific primers. Primers used for GmCHSs amplification are listed in Additional file 6: Table S6. The PCR products were cloned into the gateway entry vector pDONR-Zeo (Invitrogen) using BP clonase (Invitrogen), followed by transformation into Escherichia coli DH5α. The recombinant plasmid pDONZ-GmCHS was sequence confirmed and recombined with the destination vector pEGmCherry101using LR clonase reaction mix (Invitrogen). The recombinant plasmids were transformed into Agrobacterium tumefaciens GV3101 via electroporation. To create pEGmCherry101, mCherry fragment was amplified by PCR using primers AvrII-mCherry-F and XbaI-6His-mCherry-R (Additional file 6: Table S6). The resulting PCR products were digested with AvrII and XbaI, and inserted into the AvrII site at the N-terminus of the YFP in pEarleyGate101 [42].
The pEGmCherry-GmCHS constructs in A. tumefaciens GV3101 were transformed into Nicotiana benthamiana leaf by infiltration [43] and transient expression was visualized through a Leica TCS SP2 inverted confocal microscope. For confocal microscopy, a 63X water-immersion objective was used at excitation wavelengths at 514 nm and emission spectra of 530-560 nm for YFP.
Abbreviations
- CHS:
-
Chalcone synthase
- FPKM:
-
Fragments perkilobase of transcript per million mapped reads
- PKS:
-
Polyketide synthase
- RPKM:
-
Reads per kilobase of transcript per million mapped reads
References
Panchy N, Lehti-Shiu MD, Shiu S-H. Evolution of gene duplication in plants. Plant Physiol. 2016;171:2294–16.
Renny-Byfield S, Wendel JF. Doubling down on genomes: polyploidy and crop plants. Am J Bot. 2014;101(10):1711–25.
Lee T-H, Tang H, Wang X, Paterson AH. PGDD: a database of gene and genome duplication in plants. Nucleic Acids Res. 2013;41(D1):D1152–8.
True JR, Carroll SB. Gene co-option in physiological and morphological evolution. Annu Rev Cell Dev Biol. 2002;18:53–80.
Magadum S, Banerjee U, Murugan P, Gangapur D, Ravikesavan R. Gene duplication as a major force in evolution. J Genet. 2013;92(1):155–61.
Schlotterer C. Genes from scratch--the evolutionary fate of de novo genes. Trends Genet. 2015;31(4):215–9.
Wray GA, Hahn MW, Abouheif E, Balhoff JP, Pizer M, Rockman MV, Romano LA. The evolution of transcriptional regulation in eukaryotes. Mol Biol Evol. 2003;20(9):1377–419.
Dey N, Sarkar S, Acharya S, Maiti IB. Synthetic promoters in planta. Planta. 2015;242(5):1077–94.
Austin MB, Noel JP. The chalcone synthase superfamily of type III polyketide synthases. Nat Prod Rep. 2003;20(1):79–110.
Abe I, Morita H. Structure and function of the chalcone synthase superfamily of plant type III polyketide synthases. Nat Prod Rep. 2010;27(6):809–38.
Ferrer J-L, Jez JM, Bowman ME, Dixon RA, Noel JP. Structure of chalcone synthase and the molecular basis of plant polyketide biosynthesis. Nat Struct Biol. 1999;6:775.
Hopwood DA, Sherman DH. Molecular genetics of polyketides and its comparison to fatty acid biosynthesis. Annu Rev Genet. 1990;24:37–66.
Shomura Y, Torayama I, Suh DY, Xiang T, Kita A, Sankawa U, Miki K. Crystal structure of stilbene synthase from Arachis hypogaea. Proteins. 2005;60(4):803–6.
Tropf S, Karcher B, Schroder G, Schroder J. Reaction mechanisms of homodimeric plant polyketide synthase (stilbenes and chalcone synthase). A single active site for the condensing reaction is sufficient for synthesis of stilbenes, chalcones, and 6′-deoxychalcones. J Biol Chem. 1995;270(14):7922–8.
Tuteja JH, Clough SJ, Chan W-C, Vodkin LO. Tissue-specific gene silencing mediated by a naturally occurring chalcone synthase gene cluster in Glycine max. Plant Cell. 2004;16(4):819–35.
Shoemaker RC, Polzin K, Labate J, Specht J, Brummer EC, Olson T, Young N, Concibido V, Wilcox J, Tamulonis JP, et al. Genome duplication in soybean (Glycine subgenus soja). Genetics. 1996;144(1):329–38.
Blanc G, Wolfe KH. Widespread paleopolyploidy in model plant species inferred from age distributions of duplicate genes. Plant Cell. 2004;16(7):1667–78.
Gill N, Findley S, Wallling JG, Hans C, Ma J, Doyle J, Stacey G, Jackson SA. Molecular and chromosmal evidence for allopolyploidy in soybean. Plant Physiol. 2009;151:1167–74.
Schmutz J, Cannon SB, Schlueter J, Ma J, Mitros T, Nelson W, Hyten DL, Song Q, Thelen JJ, Cheng J, et al. Genome sequence of the palaeopolyploid soybean. Nature. 2010;463(7278):178–83.
Tuteja JH, Vodkin LO. Structural features of the endogenous CHS silencing and target loci in the soybean genome. Crop Sci. 2008;48:S49–68.
Libault M, Farmer A, Joshi T, Takahashi K, Langley RJ, Franklin LD, He J, Xu D, May G, Stacey G. An integrated transcriptome atlas of the crop model Glycine max, and its use in comparative analyses in plants. Plant J. 2010;63(1):86–99.
Goodstein DM, Shu S, Howson R, Neupane R, Hayes RD, Fazo J, Mitros T, Dirks W, Hellsten U, Putnam N, et al. Phytozome: a comparative platform for green plant genomics. Nucleic Acids Res. 2012;40(Database issue):D1178–86.
Severin A, Woody J, Bolon Y-T, Joseph B, Diers B, Farmer A, Muehlbauer G, Nelson R, Grant D, Specht J, et al. RNA-Seq atlas of Glycine max: a guide to the soybean transcriptome. BMC Plant Biol. 2010;10(1):160.
Dastmalchi M, Bernards MA, Dhaubhadel S. Twin anchors of the soybean isoflavonoid metabolon: evidence for tethering of the complex to the endoplasmic reticulum by IFS and C4H. Plant J. 2016;85(6):689–706.
Murat F, Van de Peer Y, Salse J. Decoding plant and animal genome plasticity from differential paleo-evolutionary patterns and processes. Genome Biol Evol. 2012;4(9):917–28.
Burbulis IE, Iacobucci M, Shirley BW. A null mutation in the first enzyme of flavonoid biosynthesis does not affect male fertility in Arabidopsis. Plant Cell. 1996;8(6):1013–25.
Koes RE, Spelt CE, van den Elzen PJM, Mol JNM. Cloning and molecular characterization of the chalcone synthase multigene family of Petunia hybrida. Gene. 1989;81:245–57.
Durbin ML, McCaig B, Clegg MT. Molecular evolution of the chalcone synthase multigene family in the morning glory genome. Plant Mol Biol. 2000;42(1):79–92.
Deng X, Bashandy H, Ainasoja M, Kontturi J, Pietiainen M, Laitinen RA, Albert VA, Valkonen JP, Elomaa P, Teeri TH. Functional diversification of duplicated chalcone synthase genes in anthocyanin biosynthesis of Gerbera hybrida. New Phytol. 2014;201(4):1469–83.
Ito M, Ichinose Y, Kato H, Shiraishi T, Yamada T. Molecular evolution and functional relevance of the chalcone synthase genes of pea. Mol Gen Genet. 1997;255(1):28–37.
Han Y, Ding T, Su B, Jiang H. Genome-Wide Identification, Characterization and Expression Analysis of the Chalcone Synthase Family in Maize. Int J Mol Sci. 2016:17(2).
Tuteja JH, Zabala G, Varala K, Hudson M, Vodkin LO. Endogenous, tissue-specific short interfering RNAs silence the Chalcone synthase gene family in <em>Glycine max</em> seed coats. Plant Cell. 2009;21(10):3063–77.
Austin MB, Bowman ME, Ferrer JL, Schroder J, Noel JP. An aldol switch discovered in stilbene synthases mediates cyclization specificity of type III polyketide synthases. Chem Biol. 2004;11(9):1179–94.
Yi J, Derynck MR, Chen L, Dhaubhadel S. Differential expression of CHS7 and CHS8 genes in soybean. Planta. 2010;231(3):741–53.
Li X, Dhaubhadel S. Soybean 14-3-3 gene family: identification and molecular characterization. Planta. 2011;233(3):569–82.
Sepiol CJ, Yu J, Dhaubhadel S. Genome-wide identification of chalcone reductase gene family in soybean: insight into root-specific GmCHRs and Phytophthora sojae resistance. Front Plant Sci. 2017;8:2073.
Dastmalchi M, Dhaubhadel S. Soybean chalcone isomerase: evolution of the fold, and the differential expression and localization of the gene family. Planta. 2015;241(2):507–23.
Dhaubhadel S, Farhangkhoee M, Chapman R. Identification and characterization of isoflavonoid specific glycosyltransferase and malonyltransferase from soybean seeds. J Exp Bot. 2008;59(4):981–94.
Kumar S, Stecher G, Tamura K. MEGA7: molecular evolutionary genetics analysis version 7.0 for bigger datasets. Mol Biol Evol. 2016;33(7):1870–4.
Wang CS, Vodkin LO. Extraction of RNA from tissues containing high levels of procyanidins that bind RNA. Plant Mol Biol Rep. 1994;12(2):132–45.
Libault M, Thibivilliers S, Bilgin DD, Radwan O, Benitez M, Clough SJ, Stacey G. Identification of four soybean reference genes for gene expression normalization. Plant Genome. 2008;1(1):44–54.
Earley KW, Haag JR, Pontes O, Opper K, Juehne T, Song K, Pikaard CS. Gateway-compatible vectors for plant functional genomics and proteomics. Plant J. 2006;45(4):616–29.
Sparkes IA, Runions J, Kearns A, Hawes C. Rapid, transient expression of fluorescent fusion proteins in tobacco plants and generation of stably transformed plants. Nature Prot. 2006;1(4):2019–25.
Acknowledgements
The authors thank Ling Chen, Shaomin Bian, Tim McDowell and Alex Molnar for technical assistance.
Funding
This research was supported by Agriculture and Agri-Food Canada’s Abase grant to SD. The funding body had no role in the design of the study and collection, analysis, and interpretation of data, and in writing the manuscript.
Availability of data and materials
The datasets supporting the conclusions of this article are included within the article and its Additional files.
Author information
Authors and Affiliations
Contributions
AKAV collected and analyzed data, performed subcellular localization experiments, prepared draft manuscript. KK performed gene cloning and subcellular localization experiments. GT constructed the modified dual reporter vector used in the subcellular localization study, and SD conceived and designed experiments, analyzed data, wrote the final draft of the manuscript. All authors read and approved the final manuscript.
Corresponding author
Ethics declarations
Ethics approval and consent to participate
Not applicable.
Consent for publication
Not applicable.
Competing interests
The authors declare they have no competing interest.
Publisher’s Note
Springer Nature remains neutral with regard to jurisdictional claims in published maps and institutional affiliations.
Additional files
Additional file 1:
Protein and coding DNA sequence identity matrix of GmCHSs. (DOCX 24 kb)
Additional file 2:
Promoter sequence identity matrix of GmCHS genes. (DOCX 20 kb)
Additional file 3:
List of 40,972 duplicated gene pairs in Glycine max genome (XLSX 2404 kb)
Additional file 4:
List of genes within 134.56 kb region containing GmCHS on chromosome 8 in soybean. (DOCX 19 kb)
Additional file 5:
GmCHS transcript abundance in soybean tissues. (XLSX 17 kb)
Additional file 6:
Sequences of oligonucleotides used in the study. (DOCX 24 kb)
Rights and permissions
Open Access This article is distributed under the terms of the Creative Commons Attribution 4.0 International License (http://creativecommons.org/licenses/by/4.0/), which permits unrestricted use, distribution, and reproduction in any medium, provided you give appropriate credit to the original author(s) and the source, provide a link to the Creative Commons license, and indicate if changes were made. The Creative Commons Public Domain Dedication waiver (http://creativecommons.org/publicdomain/zero/1.0/) applies to the data made available in this article, unless otherwise stated.
About this article

Cite this article
Anguraj Vadivel, A.K., Krysiak, K., Tian, G. et al. Genome-wide identification and localization of chalcone synthase family in soybean (Glycine max [L]Merr). BMC Plant Biol 18, 325 (2018). https://doi.org/10.1186/s12870-018-1569-x
Received:
Accepted:
Published:
DOI: https://doi.org/10.1186/s12870-018-1569-x