
1 Introduction
This editorial is a sequel to my 2017 editorial “Globalization, public sector reform, and the role of ports in international supply chains” (Haralambides 2017). Ideally, the two works should be read in parallel, for it is difficult to understand ports without a good understanding of international shipping and vice versa. This has always been the MEL philosophy, whenever it came to the definition of “maritime economics”, or “maritime logistics” (a term coined by this journal in 2003Footnote 1). Knowing that parallel reading won’t happen in most cases, some duplication with the 2017 editorial became unavoidable for the sake of completeness of my exposition. The whole, however, has a value-added over and above its parts, and my hope is that the two works will become valuable reference material for the “student” of shipping and ports; both the young and the young at heart.
Again, as in the 2017 editorial, I strongly advise the reader not to skip the many footnotes I have used. Often, the stuff and thoughts I have put there are much more important than the main text which evoked the footnote. My conclusions are also unconventional: They are neither the summary of this lengthy editorial nor its conclusions in a proper sense. Rather, under “conclusions” I have collected all those passages of the article that I consider new and unconventional thinking (at least in a “container shipping ecosystem”); potentially controversial; and fertile ground for further research by our younger generations of maritime economists.
The editorial is a very long story, developed over many years of graduate teaching, articles, conference presentations, lecture notes, social media posts, unpublished reports and more. Some of its parts may appear too advanced to the layman, while others might look too “fundamental” to the expert. I apologize to both. But there is so much misunderstanding and confusion in the workings of this most complex of industries that sometimes one must go to the fundamentals to make sense of what actually happens in daily business practice; to understand, for instance, why carriers neglect profitability in favor of market share. Why do they build bigger ships when they know they will be unable to fill them? Why do we use bigger ships in the Pacific Ocean, compared to those deployed in the Atlantic? Why do public ports indirectly “subsidize” (through their investments) gigantism in shipping and then complain about its effects? Why, for more than 20 years, has Europe been unsuccessful in coming up with a coherent port policy? Why do competition authorities all over the world, with first and foremost the Competition Directorate General of the European Commission, show such leniency to the worrisome concentration in container shipping we are witnessing today, with only three global shipping alliances sharing among themselves the international trade of this planet? What, if anything, has gone wrong with shipping alliances and are they as disruptive as shippers claim?
Taken in isolation, each of these questions is relatively easy to explain. Some years back, a student in naval architecture could quickly calculate for you the optimum ship size on the Singapore-Rotterdam route. But they would have great difficulty to do the same today if you told them that, due to competition among carriers, the demand for the services of this ship is stochastic; or that, in their calculations, they need to take external costs and diseconomies into account. The same happens in ports: 30 years ago, when port traffic was captive, my students could easily calculate the optimum size of a port, based on the country’s trade, population and growth data. Today, with expanding hinterlands and competition among ports, they would have to take a guess (forecast). The problem, however, is that someone will have to pay for this guess and this can no longer be the taxpayer. Rather, it has to be that person whose role is to assume risk and be rewarded or punished for it, i.e. the private sector.
I have always thought that a good place to start is the beginning. Here we go then; we start from the container and its impact on our everyday lives. As we celebrate MEL’s 20th birthday, I will take you on a trip around the world of container shipping and back. We will meet fascinating people and places and we will look at trade and globalization; global shipping alliances; carrier strategies, “intelligent” ways of pricing container shipping services, unregulated big business; relevant (and irrelevant) markets; frustrated strategists; competition; collusion; strategic pricing and investments; monster ships and “sweating” ports; logistical “intruders” and other “troublemakers”; angry shippers; adequate doses of business stupidity; the hub and the spokes of your bicycle; and more.
Shall a complete picture emerge at the end?
Shall we arrive safely at our port of destination?
Well, you yourself, my passenger, will have to tell me this.
I am just the skipper, and I can only wish you a very good trip.
HE Haralambides
February 2019
2 Shipping and economic development
Shipping is a global service industry that, by general recognition, provides the lifeline of international trade. Suffice it to say that, due to the morphology of our planet, 90% of international trade takes place by sea. Technological developments in ship design and construction, and the ensuing economies of scale (EoS) of larger ships, have reduced trade and transport costs, thus promoting trade (particularly that of developing countries) by making the transportation of goods over long distances affordable.Footnote 2 As a matter of fact, geographical distance plays a much lesser role today, as a determinant of trade between countries, and it is being replaced in trade models by the concept of economic distance, as this is proxied by ocean freight rates (cf. transport costs).
These developments have expanded the international markets for exported goods, thus allowing mass production and lower unit costs at home. This has improved the international competitiveness of exporting countries, and it has facilitated the industrialization of many of them around the world. One of the best examples of export-led industrialization is Japan: The Japanese are thrifty people. It was not therefore growth of domestic demand that enabled the country to develop, but low transport costs which allowed Japan to conquer Asian and world markets with high quality products. As a result, a huge global market for its products led to mass production, even lower costs and export prices, and greater dominance still in international markets.
Often, international ocean transportation and Information and Communications Technologies (ICT) are referred to as the two basic ingredients of globalization (Stiglitz 2006).
3 Bulk and liner shipping
Traditionally, the shipping industry has been thought of as consisting of two distinct sectors (markets): the bulk shipping sector, engaged mainly in the transportation of raw materials and energy goods such as oil, coal, iron ore and grains, and the liner shipping sector, involved in the transportation of final and semi-final products, such as electronics, textiles, clothes, footwear, food, toys, furniture and other home goods, and a miscellany of manufacturing output (Fig. 1).

Ocean transportation in the production process
From a market structure point of view, the two sectors are as different as they could possibly be (Fig. 2): bulk shipping uses large and fairly unsophisticated ships, such as tankers and bulk-carriers, to transport goods in bulk, i.e. in an unpackaged form, on a contract basis (the so-called charterparty). Other than the ship itself, the provision of this service requires minimal carrier infrastructureFootnote 3 and it resembles the service of a taxi, whereby the contractual relationship between passenger and driver (cargo owner and shipowner in our case) ends upon the completion of the trip and the driver is again on the lookout for new custom. The industry is highly competitive, with prices (freight rates) fluctuating wildly even in the course of a single week (Fig. 16).

Bulk and liner shipping: comparison and contrast
This is a good place to raise a point I have always wanted to clarify. Often in the literature, the word tramp has been confused, or used interchangeably, with the word bulk. Even worse, a “tramp ship” has often been used synonymously with a bulk ship, or bulk-carrier. However, “tramping” means simply operating in the spot voyage market and certainly it does not indicate a particular type of ship. To put it differently, a bulk carrier on a long-term time-charter is not tramping, nor is one engaged in a contract of affreightment. In short, the mere fact that a bulk ship is not offering regular or scheduled services, like a liner ship, does not make it a tramp.
Research on bulk shipping has therefore been mostly concerned with the estimation of tonnage demand and supply functions, and freight rate forecasting. For a good literature review see Haralambides et al. (2005), Veenstra (1999), Stopford (2008), Beenstock and Vergottis (1993), Wergeland (1981), and Norman (1979).
Liner shipping, on the other hand, is geared to the provision of regular services between specific ports, according to timetables and prices advertised in advance (Haralambides 2004; Jansson and Shneerson 1987). The service is in principle open to anyone with some cargo to ship and in this sense it resembles a public transport service, like that of a bus or tram. The provision of such a service—often of global coverage—requires extensive infrastructure in terms of terminals and/or cargo handling facilities, ships, equipment, warehousing and agencies. For instance, the provision of a weekly service between Europe and Southeast Asia requires investments in excess of one billion US dollars in ships alone. Understandably, investments of this magnitude may on the one hand lead to undesirable capital concentrationFootnote 4 and, on the other, pose considerable barriers to entry for newcomers. These aspects of the industry have constituted important research areas and are discussed next.Footnote 5
4 Containerization: the kindle wood below modern logistics and port reform
Cargo carried by liner shipping has come to be known as general cargo. Up to the beginning of the 1960s, such cargo was transported in various forms of unitization (packaging), such as pallets, slings, boxes, barrels and crates, by relatively small ships, known as general cargo ships, cargo freighters, multipurpose ships, twin-deckers or multi-deckers. These were ships with holds (cargo compartments) in a shelf-like arrangement, where goods were stowed in small pre-packaged consignments (parcels) according to destination (Fig. 3). This was a very labor-intensive processFootnote 6 and ships were known to spend most of their time in port, waiting to berth, load or discharge. Seafaring was fun (sic) in those days, but congestion was a chronic problem in most ports, raising the cost of transport and hindering the growth of trade. Equally importantly, such delays in ports made trade movements erratic and unpredictable, obliging manufacturers, wholesalers and retailers to keep large stock. As a result, warehousing and carrying (capital) costs were adding up to the cost of transport, making final goods more expensive and, again, hindering international trade and economic development.Footnote 7

Multipurpose general cargo ships
This situation started to change in the 1960s with the introduction of the “container” and containerization in the trade between the United States and Europe and, subsequently, in the rest of the world.Footnote 8 Containerization is often described as a revolution in transport. General cargo goods are now increasingly carried in steel boxes (containers) of standardized dimensions; most common is the 8 × 8 × 20 foot container known as TEU—Twenty-foot Equivalent Unit—although containers of double this size (40 feet) are increasing in importance. Perhaps one of the most important effects of containerization is that, now, containers can be packed (stuffed) and unpacked (stripped) away from the busy waterfront, either at the premises of the exporter (consignor) and/or the importer (consignee), or at Inland Container Depots (ICD), warehouses, and distribution centers (dry ports) (Fig. 4).

20- and 40-foot containers and their technical characteristics
Expensive and often unreasonably strongly unionized port labor is thus bypassed; pressure on port space relieved; and ship time in port minimized. These developments have increased ship and port productivity and system reliability immensely, thus allowing ships to become even bigger, achieving significant economies of scale and, consequently, lower unit transport costs and thus international competitiveness. Actually, as I will discuss, the economic incentive behind the construction of ever larger ships is modern day port efficiency and productivity, rather than technological advances in ship design, or economies of scale at sea (which are lost if the ship has to wait in port). Nowadays, containers are increasingly carried by specialized cellular containerships many of which able to carry more than 20,000 TEUs, while designs for 25,000 TEU ships—or bigger—are already on the drawing boards of naval architects.
At the time of writing, mammoth ships such as these could cost anything in the neighborhood of 100 + million US dollars, and it could take up to nine or 10 ships to run a weekly service between Europe and Asia. The capital intensity of these ships obliges them to limit their ports of call at each end to just a few hub ports or load centers such as Shanghai, Singapore, Hong Kong, Rotterdam and Hamburg, from where huge surges of containers are consolidated or further forwarded (feedered) with smaller vessels, rail or road, to regional and local ports.Footnote 9 Complex hub-and-spoke networks have thus evolved whose logistical fine-tuning and optimization bears directly on consumer pockets.
In parallel, by-passing the waterfront in the stuffing and stripping of containers, and thus having them ready in port to be handled by automated equipment, has increased immensely the punctuality, predictability and reliability of cargo movements and transport systems, enabling manufacturers and traders to reduce high inventory costs through the adoption of flexible Just-in-Time and Make-to-Order production technologies. Inter alia, such technologies have helped manufacturers to cope with the vagaries and unpredictability of the business cycle and plan business development in a more cost effective way. Indisputably, containerization has been the kindle wood under global logistics and supply chain management. Furthermore. The concept of logistics does not regard only cargo systems, but it permeates every aspect of our everyday life. For instance, in a reliable transport system, I know precisely what time I need to leave home to make it to the airport. But if taxis are frequently on strike; rail under continuous maintenance; or security controls at airport a mess, I need to leave home an hour earlier. This hour is “my” inventory cost.
Around the world, the port industry has invested a lot, in order to cope with the technological demands of containerization. Modern container terminals and commensurate cargo handling equipment have been built and new, more efficient, organizational forms (including privatization) have been adopted in an effort to speed up port operations. Operational practices have been streamlined, the element of uncertainty in cargo flows largely eliminated, forward planning has been facilitated, port labor regularized, and customs procedures simplified. These developments took place in the firm understanding of governments and local authorities that ports, now, constitute the most important link (node) in the overall door-to-door supply chain and thus inefficiencies (bottlenecks) in the port sector can easily wither all benefits derived from economies of scale and scope in transportation and logistics. Since 2000, the measurement of port efficiency has thus become a key research area in maritime economics.Footnote 10
5 Chasing the “Holy Grail” of economies of scale in shipping
Thirty years ago, the largest containership would just pass through the Miraflores locks of the Panama Canal, having a size of roughly 4,500 TEU (known as a Panamax-size ship).Footnote 11 Today, the size of the largest containership is five times that big, i.e. about 22,000 TEU. What are, therefore, those EoS, and are they as important as carriers tend to believe?
Economies of Scale refer to a situation where unit costs (i.e. cost/dwt or cost/slot), in other words the costs relevant to pricing and competitiveness, decline as ship size increases. This decline is more pronounced in the case of shipbuilding costs, manning costs and fuel costs. Simply put, you don’t need twice the amount of steel to build a ship twice the size, nor twice the crew to sail it, or fuel to move it. In the case of shipbuilding (capital) costs in particular, Fig. 5 speaks for itself when it comes to the relationship between cargo carrying capacity (CCC) and ship dimensions: The almost doubling of CCC, from 3,500 to 8,000 to 15,000 TEU, requires only moderate increases in ship dimensions and, most importantly, draft. This shouldn’t surprise us: The amount of steel I need to build a ship increases linearly, while CCC increases in the cube of dimensions.

Economies of scale in shipbuilding
The bottom part of Fig. 5 (borrowed with many thanks from the great Port of Hamburg) is even nicer: The larger ship (March 2018) is the CMA CGM “Antoine de Saint Exupéry”: 400 m long, 59 m wide, with a container capacity of 20,776 TEU. In her gut (May 1968), like Jonah in the gut of the whale, is the “American Lancer”: 213 m long, 26 m wide, with a container capacity of 1,200 TEU. The Antoine is just twice as long and about twice as wide as the Lancer, but it can carry 17 times more cargo (20,776/1,200)! What better example could one need to explain economies of scale?
6 Optimum containership size
So, are there limits in gigantism and if so what are the factors determining the optimum size of a ship on a certain trade route? Let us try to formalize things somewhat with the help of a simple optimization example that minimizes unit costs; i.e. ship costs per slot. Differently, our optimum will be that ship, of a size that minimizes costs/slot. But first, let us define our variables in Table 1.
The technical coefficients v, z and w are important in expressing the relevant EoS, as they are shown in Table 2. In short, the expressions in the second column of that table tell us that total shipbuilding, operating and fuel costs do increase with size, albeit only to the square root of size and not proportionately. Unit costs thus decline.
To minimize unit costs, we naturally need to derive the (u-shaped) average cost function from the ship’s total cost function, the latter consisting of costs in port plus costs at sea. Thus:
Time in port is the time required to unload and then load a ship of size Q, at a cargo handling rateFootnote 12r:
That is to say, a ship of 10,000 TEU, worked with six cranes of a productivity of 30 moves/h each, will stay in port for unloading and loading 2 × 10,000/30 × 6 = 111.1 h or 4.6 days. The cost of time in port would then be:
Time at sea is apparently a function of two things: distance and sailing speed, with the former parameter being the most important, explaining, virtually by itself, the different ship sizes in use in the major global and regional trades.Footnote 13 The cost of time at sea is thus the sum of daily capital- and operating costs plus the cost of fuel consumptionFootnote 14:
Thus,
and
Differentiating Eq. 9 w.r.t. Q, setting the first derivative equal to zero and solving for Q gives us that ship size \( {\bar{Q}} \) which minimizes unit costs, i.e. the optimum ship size.
Or,
and finally, the optimum ship size is given by:
As the distance of a certain trading route (e.g. the Pacific) is constant, the variable in Eq. 12 that plays the leading role in the “ship size” discourse is the cargo handling rate, r, or, in other words, port productivity. Indeed, for more than 30 years, I have been preaching that it is port productivity itself, rather than any technological developments in ship design, construction or propulsion (or any other factor) that has induced the gigantism in containerships we observe today. And as I have argued earlier (Haralambides 2017), port productivity all over the world has been advancing in leaps and bounds as a result of port competition which, in its turn, has been evoked by globalization, trade liberalization and competition among nations.
7 The ‘sweating port’: diseconomies of scale in ports and along the supply chain
Undoubtedly, EoS in shipping have led to cargo consolidation, as well as to storage and distribution requirements, and thus to the emergence of regional hubs and to global logistics as we know them. There are, however, limits to the growth in ship sizes, and these depend on freight demand, port capacity and technology, land infrastructure, other logistical costs, the future of global shipping alliances, and the attractiveness and future of the hub-and-spoke system in container transportation. Above all, for EoS to be had, the ship must sail full; otherwise, economies of scale become diseconomies of scale.
However, “big ship” and “high frequency of service” mix an explosive cocktail and filling the big ship is easier said than done. Fortunately, carrier cooperation through global shipping alliances (see below) has come to the rescue, allowing carriers to fill each other’s ship with their own containers. In this way, each carrier requires fewer (bigger) ships. But for how long shall carriers be allowed to do this without attracting the inquisitive eye of the regulator?Footnote 15
Υears back I had shown that there are significant EoS to be had in shipbuilding, up to Panamax-size vessels (about 4,500 TEU). After this point, the unit cost curve flattens, with only marginal gains to be had (Fig. 6). Following the thinking of Kendall (1972) of almost half a century ago, I have also shown (see Haralambides 2017; Fig. 4 on p. 12 there) that in situations where the ship has to be turned around within a fixed time frame, say within 48 h irrespective of her size, it costs more to handle a container arriving on a large ship than one arriving on a smaller one. In other words, cargo handling time per TEU is higher after a certain ship size, and this is a distinct “port diseconomy of scale”.

EoS and declining shipbuilding costs
It is not so difficult to understand why: As crane productivity cannot be stretched much beyond 30 moves/h (it actually declines after a certain crane densityFootnote 16), the only way to serve a larger ship in the same time (48 h) is by adding more and bigger (in terms of air draft and outreach) cranes. However, increasing crane density reduces crane productivity, among others nullifying the advantages of having bigger hatches.
Stopford (2008) arrived at a similar result, this time however for total costs per slot in the Atlantic trades. Stopford’s unit cost curve starts to flatten at a higher tonnage (about 8,000 TEU), given the significant EoS to be had in ship operations and propulsion (Fig. 7). After this point, however, there are only 4% savings, all the way to 18,000 TEU ships (Malacca-max).

Source Stopford
Scale economies in practice: Total dollar cost/slot in the Atlantic trades.
Big ships impose substantial demands on port capacity, without, however, paying commensurately for this demand. For instance, where before we could accommodate three Panamax vessels (i.e. three berths) along one kilometre of quay-wall, today we can host there only two mega-vessels of the latest generation (about 400 m long). Berth utilization obviously goes down and so does the utilization of ship-to-shore (StS) cranes, for bigger ships mean lower call frequency.
All this would be fine, as long as carriers were bringing more traffic to the port with their larger vessels. But this doesn’t happen either. As Fig. 8 shows, call size is only moderately correlated with vessel size.

Ship capacity and call size
More importantly, one needs fewer bigger ships, and fewer port calls, to serve a given amount of yearly demand. Thus, the infamous UNCTAD connectivity IndexFootnote 17 goes down and, with it, the contribution of shipping to trade and development. Here too, berth and crane utilization decline and this impacts on the capital costs of the port and of the terminal operator. In addition, a reduction in the frequency of carrier itineraries (i.e. number of services), caused also by slow-steaming, impacts the inventory costs of traders, thus defying the very principles of supply-chain optimization, and this is a clear diseconomy along the supply chain. Finally, filling up the bigger ship in Asia is easier said than done. To do so, the ship must call at more Asian ports than what her size (and Eq. 12) would warrant, often picking up containers at random and at short notice, without due consideration to the importance of proper stowage planning. As a result, ship and terminal stowage planning at the other end (Europe/North America) often becomes a nightmare.Footnote 18
8 The “second scenario” and (a brief note on) global shipping alliances
At the beginning of this section I hinted at six macro-trends, each reinforcing the other, which could potentially halt gigantism in container shipping and in mega-hub-ports. These trends were first reported in Haralambides (2000a) and were: (i) worldwide port development; (ii) regionalisation of trade; (iii) infrastructure development in southern Europe; (iv) road pricing in Europe; (v) the future of global shipping alliances; and (vi) the impact of information technology.
Interestingly, almost two decades after my thoughts were first recorded, and in spite of the fact that all six trends have conspicuously materialized since, containerships have continued to grow. I unswervingly attribute this not to a failure of the underlying trends to influence ship-size developments, but to a failure in regulatory policy, both in terms of our inability to develop a coherent port policy in Europe, and our “eyebrow-raising” leniency towards increasing concentration in liner shipping in the form of global shipping alliances.
In spite of the wide availability of Haralambides (2000a), a few words on each of the six trends and their effect on ship size couldn’t be amiss here, keeping in mind that the below lines were written almost 20 years ago.
Worldwide port development All over the world, ports are being spectacularly developed in tandem with their countries’ general economic growth, development and trade requirements. Countries are not convinced that they should not develop their own ports just because they can be equally well feedered by neighbouring hubs. Thus, the more ports are developed, the more attractive and economical it becomes for carriers to call there directly with smaller ships/cargo-loads, instead of feedering from a neighbouring hub. This is particularly so if port development is accompanied by structural reforms that enhance the operational efficiency and productivity of ports.
Regionalization of trade The trend towards smaller ships and direct calls/diversion will also be facilitated by the growth of intra-regional trade in Asia, nowadays representing more than 50% of international trade. This means smaller distances overall, and smaller distances in turn, mean smaller ships, as we have seen. The consequent development of Asian ports and fleets to serve this trade, and the increased profitability of this trade, will perhaps make it more economical for Asian operators to deploy an increasing number of such ships to Europe-Far East, instead of building dedicated large containerships to serve Europe, as is currently the case under the hub-and-spoke system. In addition, a relative uniformity in ship size gives operators increased flexibility in alliance operations that aim to provide global coverage. This trend will become increasingly apparent, especially if peripheral ports around Europe are developed, modernised and reformed, together with the rest of their connecting infrastructure.
Infrastructure development in peripheral Europe The high degree of efficiency and productivity of what has come to be known as the Hamburg-Le Havre range of ports, coupled with the existence, expansion and consolidation of sophisticated inland transport networks, the completion of the European internal market, and a road transport pricing policy favouring long-distance haulage, have allowed these ports to capture in full the benefits of the new logistical developments in transport. Thus, approximately 50% of Europe’s external trade passes through these ports. Until recently, this has been one of the reasons that has blunted the Southern Europe’s motivation to develop its own ports, being in a sense adequately served by the North. This rather passive approach to development, known in the literature of economic development as the Hirschman-Myrdal effect (Hirschman 1958; Myrdal 1957), combined with lack of funds, restrictive labour practices, high prices and low productivity, had resulted in a situation where Mediterranean ports were bypassed in the Europe-Far East trades, with goods destined for the south being unloaded/transhipped in the north and then carried over land. Southern European ports were (and many of them still are) thus lagging behind, despite the comparatively higher growth of their respective economies and the consequent port and transport requirements.
Today, southern European ports are still important instruments of regional development, and crucial links that connect the periphery with the “centre” of Europe, both with regard to cargo and passengers. They thus contribute to the economic and social cohesion of Europe and many of them, such as Piraeus, are developing as southern gateways to the continent for the increasing far-eastern traffic. Ports in Italy, Spain, France and Greece have gone to great lengths towards development and restructuring, increased efficiency and competitive pricing. As a result, they have been able to strike lucrative deals with major carriers and an ever increasing part of European trade enters now the continent from the south.
Southern European ports are expected to expand and modernise at even higher rates in the future. An additional incentive for this is the rapid growth of north Africa, the Middle East and the Black Sea, and the European Union’s intention to create a customs union and eventually a free trade area with the non-member Mediterranean countries (European Commission 1995; Haralambides 1998): All in all, a population equal in size to that of the EU, with 80% of it living at a distance of less than 100 km from the coast. Again, the more ports are developed and modernised, the more economical a direct call by a (smaller) mother-ship becomes.
Road pricing in Europe The heavy demand on road use in Europe, compounded by the under-priced, fixed-cost-based, supply of road infrastructure, and the increasing unwillingness of many governments to invest in new road capacity, create a number of significant problems, particularly with regard to congestion, safety and environment. Externalities such as these, however, are rarely internalised in the pricing of road infrastructure, the more so when the latter has lost most of its “public interest” character and is increasingly becoming a private consumption good. Emphasis on a “variable cost” approach in the pricing of road use (user pays principle) by many European countries will make competition among ports and transport systems fairer and more efficient. To quote the EU: “… as a general rule, all transport users pay the full cost, internal and external, of the transport services they consume, even if these costs are in some cases paid by society to assist those in need…”.
Such a pricing policy, if widely implemented, will make long-haul road transport considerably more expensive. This is bound to limit the hinterland of hub-ports and, correspondingly, boost not only alternative modes, but also extend the hinterland of southern European ports that could equally well target Asian cargoes destined for France, southern Germany, Switzerland, Austria, the countries facing the Black Sea, as well as a considerable part of Central and Eastern Europe. As discussed, the competitive position of southern European ports and short sea shipping in this region will further improve along with progress in the integration of non-member Mediterranean countries and the eventual formation of a Customs Union and a Free Trade Area with them.
(A note on) Global shipping alliances Up to now, developments in ports (hub-and-spoke) have been dictated by developments in shipping rather than the other way around. As we have seen above, developments in liner shipping in particular have been necessitated by the drive to cut unit costs through increases in the size of ships. The capital-intensity of modern containerships, however, requires very fast turnaround times and thus appropriate investments in ports. At the same time, shippers require a certain frequency of service that befits their just-in-time-time and flexible-production technologies. The combination of “large ship size” and “adequate frequency of service”, as we have already remarked, can easily lead to low load factors and under-utilisation of capacity, for operators intending to “go it alone” without a secure cargo basis. One could in this sense argue that the industry has fallen into some sort of vicious circle where the need to cut costs leads to the construction of larger ships, creating overcapacity that depresses rates, thus leading to a stronger need to cut costs and so on and so forth.
Shipping alliances have emerged in order to exploit both EoS and “economies of scope” among otherwise competing carriers. Alliances are technical cooperation agreements among carriers that, opposite to conferences, do not engage in price-fixing. Marketing is thus carried out independently and competitively, while carriers cooperate in pooling and sharing resources (ships, equipment, terminals, networks). In a way, one might say that, under conferences, profit maximisation is pursued through price-setting, while, under alliances, the same objective is pursued through better cost control. For market efficiency, consumer welfare and shipper interests, however, the latter pursuit (cost control) is a much better alternative. The result is better and wider service networks (and thus markets) to shippers.
By pooling and sharing resources, dovetailing their individual service networks and jointly scheduling their fleets on a global scale, alliances reduce redundancies in shipping capacities, increase productivity and lower unit costs through better capacity utilization. Moreover, in view of the significant capital investments required for ships and equipment, alliances mitigate market risk by being able to better predict and coordinate capacity requirements. (Cariou and Haralambides 1999; Haralambides 2002).
However, global shipping alliances have proven to be unstable coalitions, being in constant reshuffling for years. This fact alone does not entice individual carriers to undertake the required long-term commitments, something that defeats the very same rationale of alliances. Mergers and acquisitions are thus becoming more appealing to carriers, and it won’t be long before we see liner trade carried by a handful of mega-carriers.
We should keep in mind that these predictions were made 20 years ago. And today? Today, we just have three alliances carrying 80% of world trade in containers [2M: (MSC, Maersk, HMM), Ocean Alliance: (CMA-CGM, Cosco Group, OOCL and Evergreen), and THE Alliance: (Hapag Lloyd, NYK, Yang Ming, MOL, K-Line)], while the infamous “top 20” carriers, the same companies and household names for decades, have been reduced to 12 through mergers and acquisitions (Fig. 9, thankfully borrowed from Alphaliner).

Source Alphaliner
Consolidation in liner shipping (2017): how the “top 20” became “top 12”.
Such consolidation in an industry that is already highly concentrated is bound to take place under the increasing scrutiny of the regulator who, with the final consumer in mind, is likely to encourage more competition rather than further consolidation. If the liner shipping market thus becomes more open and competitive in the future, i.e. if alliance agreements regarding vessel sharing, investment planning, etc. are scrutinized more closely for their compatibility with competition law, as I expect, the joint filling of the ship will become more difficult and ship sizes shall by necessity decrease, together with an increase in the number of ports of call. Low prices would then be achieved through higher competition rather than big ship sizes.
In such a scenario, shipping companies will be forced to provide the services their customers want, rather than the ones they find it convenient to offer. Shippers do not like too much transshipment and, if they could help it, they would like their container as close to them as possible. Reduction in ship size and more direct calls could thus follow the example of the air-transport industry. The most common jet flying across the Atlantic is not the 420-seat 747 jumbo but the 200 plus-seat Boeing 767. Eight out of 10 transatlantic planes are twin-engine craft such as the 767, its bigger brother the 777, or the various airbuses. This taste for smaller international jets reflects the fact that travellers now like to shun big international hubs such as London and New York and fly directly to their destinations. This is changing the international market into a web of direct intercontinental flights rather than one big air-bridge between London and New York.
Information technology The impact of information technology on transport, as well as on all aspects of our lives, has yet to be fathomed. One thing however is for certain. Information makes markets more efficient, reducing the need for middlemen, may they be brokers, forwarders, consolidators or NVOCCs (Pettersen Strandenes 2000). The supply chain thus becomes shorter and the future may see more direct international transactions between buyer and seller, for smaller quantities, expediently delivered. Unavoidably this will have to be done by smaller ships and direct port calls, through a system of ocean transportation that I have often called “the transition from land-based to sea-based logistics” (Haralambides et al. 2000b).
9 The “second scenario” and hub-and-spoke systems in container transport
Mega-ships and mega-ports are two faces of the same coin: the one “feeds” and “reinforces” the other and the one cannot exist without the other. I prepared the infographic of Fig. 10 in an effort to explain to a wider audience, in as simple a manner as possible, the concept of “hub-and-spoking” (HS), in other words, the intrinsic relationship between mega-ships and mega-ports.

Hub-and-spoke systems in container transport
The HS idea is quite enticing as a start: Simply put, “it is cheaper to ‘shuttle’ between hubs with a bigger ship and then distribute, rather than call directly at smaller ports, with smaller ships, serving a smaller demand”. As we saw, a mega-ship can realize significant economies of scale as long as a) it sails full; b) spends most of her time at sea. To achieve both objectives, she must limit her ports of call to a minimum number of hubs, such as ports 1, 2, and 3 (calling also, however, at some additional ports such as 4 and 5). Port 2 (in Asia) is a “consolidator”: It attracts cargo, destined for Europe (or North America), from as far away as Australia, Indonesia, Philippines and India, and it has it ready, at its modern terminals, waiting to be expediently picked up by the mega-ship upon arrival. Remember: such a ship cannot wait much and if it has to, before too long she may be looking for another, more efficient hub-port in the “neighborhood”.
Port 1 in northwestern Europe is a “distributor” and here the process is reversed: Our mega-ship arrives, drops its “call size” within a tight time-window, and departs. What happens next, i.e. how Port 1 shall manage to distribute to its hinterland, as efficiently as possible, a huge inflow of thousands of containers, is not our ship’s concern; rather, our ship looks at this challenge as a NIMBY (not-in-my-backyard) problem.
Leaving it at that, the HS freight system is preferable to direct calling, reducing notably transport costs, in spite of the substantial feedering operations it requires (too many studies have convincingly shown this, and I won’t attempt to repeat them here). In addition, the “consolidation-distribution” operations around hub ports create substantial economic activity for transport operators (road; rail; inland waterways; short sea shipping).
When it comes to feedering operations, there are two systems in daily practice, depending on the amount of freight volume available: If the latter is adequate, a shuttling system is often used, like the one between hub 1 and regional ports 9–12. When regional cargo traffic is limited, however, a cyclical feedering system is preferred, such as the one between hub 2 and feedering ports 6, 7 and 8. Finally, we also have two types of feeder companies: Dedicated feeders, belonging in other words to major carriers like COSCO, and common feeders, i.e. shipping companies that offer their services to all major carriers indiscriminately.
But we should no longer leave it at that. As we have already started to argue:
-
Transshipment costs: a bicycle manufactured in Vietnam and ordered in Madrid may be handled four or five times until it reaches its final destination.
-
Shippers do not like too much transshipment and long distances, preferring to have their containers as close to them as possible.
-
Consolidation and distribution use land infrastructure without paying for the private use of a public good.
-
External costs of hub-and-spoking (congestion; pollution; accidents) may at times be as high as 2% of European GDP.
-
It is doubtful if the economies of scale in shipping are passed on to the final consumer, as required by the block exception of consortia and alliances from the provisions of competition law in Europe.
-
Mega-ships are becoming an increasing headache to most ports and distribution centers, and a NIMBY approach is no longer acceptable to them, nor to the taxpayer who finances them.
-
Large ships reduce loop frequency and increase the inventory costs of traders, thus defying the very same principles of supply chain optimization.
-
HS penalizes the legitimate development plans of other ports, particularly as major hubs now claim from others efficiency and market-driven port investments, while they themselves have been financed with public money for most part of their economic life.
Economies of scale in shipping, distribution and logistical systems have totally changed our lives to the better in the last quarter of a century. But transshipment, warehousing and distribution don’t come cheap, as our enthusiasm with logistics often assumes. It is good to know this and thus make sure that the costs (internal and external) of logistics operations are paid in full, including the costs of using public infrastructure. The latter because (to a large extent) infrastructure is no longer a public good and thus the user pays principle should apply.
One might counter-argue on this that, in this way, higher transport and logistics costs would be passed on to the final consumer, as it usually happens with privatization. This may or may not be so, depending on how competitive transport and logistics markets are. But even if it is so, what is certain is that the final consumer will now be paying less taxes to develop “private” infrastructure. On balance, the consumer should be indifferent.
10 Ship and terminal productivity and the question of optimum speed
We have seen that speed, both sailing and cargo handling speed in ports, is a crucial parameter in determining not only optimum ship size, but also the efficiency and productivity of our ports and overall logistics chains. Our “obligatory” discourse on “speed” in this section, therefore, will start from the supply of tonnage and I explain why.
Some knowledge of the magnitude of the total supply of tonnage in the market is crucial at the corporate level: pricing, competitive pressure, and investment decisions all depend on it. However, in decision-making, “supply of tonnage” should not be understood as just ships and steel and tons of cargo carrying capacity (CCC), i.e. what I call physical supply. Rather, our interest ought to be in effective supply, that is, how much work these ships perform in a period of time, say, during 1 year,Footnote 19 in other words, how productive this tonnage is.
This “work” of the ships, of course, is not measured only by the number of tons the ships will carry, but also by how far they will take those tons. We thus measure effective supply by “ton-miles” (or TEU-miles).Footnote 20 UNCTAD’s Table 3 and my Fig. 11 below are quite “vociferous” on the issue of effective supply or ship productivity. The 5th column of Table 3 tells us that, in 1990, one deadweight ton of ship capacity carried 6.1 tons of cargo, or, differently, the average ship completed 6.1 round-trips in that year. In 2004, this number was 7.6; up by 25%. Figure 11 tells us the same story: In 8 years, from 1985 to 1993, ship productivity went up by nearly 50%.

Fleet productivity
So what determines productivity in shipping? Who decides how fast or how slow I should sail my ship or how many round-trips and how much cargo I will carry each year? Two factors give the answer to these questions: a) the steaming speed of ships—being a function of prevailing freight rates; b) the cargo handling performance of ports. Before addressing these two factors, however, we must make a digression and discuss the important relationship between freight rates and sailing speed. This will give us a good understanding of the short-run supply of tonnage curve, which we will then establish formally in the subsequent section, following the thinking of Tjalling KoopmansFootnote 21 (Koopmans 1939).
10.1 The three stages of supply’s adjustment to demand
Koopmans’ short-run supply of tonnage curve (Koopmans 1939) is not much different from that of Fig. 12 (S line).Footnote 22 Briefly, supply reacts to changes in demand in three (often overlapping) stages: in stage one (segment Q′Q) freight rates keep rising up to F0 , but shipowners are not responding. Ships remain in layup until shipowners are convinced that the rise in freight rates is not incidental but somewhat structural and here to stay. It shouldn’t be forgotten that the decision to layup and reactivate a vessel costs money—in terms of flying in and out the crew, insurance, etc.—and it is not taken impulsively. In stage one, therefore, the supply is totally inelastic—unresponsive to price changes—and this stage would normally last only a few weeks.

Demand–supply equilibrium and pricing in shipping
At point E (Q′) (start of stage two), shipowners are fairly confident that the market is on the rise and it will continue to do so. Supply is all of a sudden becoming very elastic and carriers respond to the rising demand (and freight rates) in various ways. These include decreases in layups, increases in sailing speeds (the faster I will complete a transport task the sooner I should be able to re-charter my vessel at a higher freight rate), avoidance of long-term carriage contracts, which—same as longer distances—are becoming comparatively more expensive (remember: on a rising market and ceteris paribus, I would like to free my vessel as early as possible for her next assignment), avoid “poor” cargoes (i.e. cargoes with high elasticity of demand), postpone (non-statutory) maintenance, etc. Stage two would normally last a few months. Both here and in stage three, newbuilding orders are pouring in.
At point E2, stage three starts and supply becomes again inelastic: all the responses to demand (stage two) have been attempted, but demand (and rates) continue to rise. There is nothing much that can be done now, other than ordering, massively, more new tonnage. Before long, shipyard berths are fully booked, that is, the supply of shipyard capacity becomes also inelastic and it could well take up to 4 or 5 years until a ship is delivered. Shipyards in those periods pick and choose the type of ships they prefer to build; these are specialized ships of higher value-added (LNG carriers, chemical and product tankers, etc.) and containerships, crude oil tankers and bulk-carriers are not amongst them. Often, the ship is delivered in market conditions very different from those prevailing when she was ordered, and cancellations naturally abound.
For those lucky shipowners with uncommitted tonnage, such a “bonanza” (stage three) will only happen once in a life time, and this was the case in the years 2006–2008, which preceded the global economic meltdown of late 2008–2009, but also in the golden years 2002–2004, when charter hires quintupled in less than 3 years. For example, in 2002, a 4,500 TEU panamax containership would be chartered for $10,000/day; in 2004, the same ship commanded $50,000/day. In the same period, a small (1,700 TEU) feeder would bring $5,000/day, but more than $25,000/day in 2004. In the first quarter of 2008, Capers and VLCCs would be time-chartered for $100,000/day (if available),Footnote 23 while Chinese shipyards were mushrooming by the day.Footnote 24
Eventually, the long-run adjustment of supply to demand will take place, once the new tonnage, ordered in the second and third stages, starts to enter the market. This will not only balance the rising demand but, more often than not, it will overshoot it, thus depressing substantially freight rates, leading to a new downturn of the shipping cycle.
11 Ship and terminal productivity revisited
But let us return to our discussion of productivity and try to establish the relationship between sailing speed, cargo handling rateFootnote 25 and ship productivity, i.e. number of round trips performed per year. In our exposition, a round trip comprises two ports and four cargo handling operations (loading/unloading). The time of one round trip consists of the time at sea plus the ship’s time in port. That is,
where t is the round trip time (days), s the speed (miles/day), Q the ship capacity (TEU), and r is the cargo handling rate (TEU/day).
The first term in parentheses (Eq. 13), distance over speed, gives us ship time at sea. The second term is the time for unloading and loading the ship in port. The “2” in the numerator of the fraction 2Q/r assumes that the ship is first completely unloaded and then loading starts; this doesn’t have to be so, but the significance of our assumptions has already been discussed above (footnote 12). Finally, the “2” outside the parentheses in Eq. 13 signifies that t is the time of a round trip.
If A is the period in a year the ship will be actually trading,Footnote 26 the number of round trips, n, she would perform are given by:
As one picture is better than a 1,000 words, Eq. 14 also tells us that the number of round trips a ship will perform in a year, i.e. its productivity, is an increasing function of the ship’s sailing speed, s, and the productivity, r, of its ports of call. In the opposite, ship productivity, n, is an inverse function of distance (d) and the size of the ship (Q)—the latter obliging the ship to spend more time in port.
Other things being equal, the relationship between speed and ship productivity (number of round trips) can be seen in Fig. 13, drawn for two cargo handling rates: 30 and 60 TEU/h.Footnote 27 The actual case of this example involved a small, 1,000 TEU feeder ship, shuttling in the Mediterranean, between the hub-port of Piraeus (Greece) and the port of Algiers (Algeria). At a speed of 24 knots, the Piraeus-Algiers distance (about 1,000 nm) was covered in 2 days. At this sailing speed, and a cargo handling rate at both ports of 30 TEU/h, our ship managed 30 round trips per year. Eventually, the shipowner was able to increase port productivity to 60 TEU/h—something relatively simple, just requiring one more StS crane, i.e. two cranes instead of one.
Now, the ship could perform seven round trips more per year; that is to say, 37 round trips. For simplicity, assume that the ship was sailing to Algiers full and returned to Piraeus empty. At the higher port productivity of 60 TEU/h, in the course of the year our ship would carry 7,000 containers more which, at an average tariff of $1,000/TEU, would mean an incremental gross income/year of $7 million or, assuming a 10% profit margin, an increase in profit of 23.3%.

Productivity: Impact of speed on effective supply
12 The fortunes to be made by optimizing speed
Beyond a certain point, fuel consumption increases exponentially with speed. Roughly, a 10% increase in speed would require a more than 20% increase in fuel consumption. At the same time, the fuel bill of a large container shipping company amounts to billions of dollars every year. Actually, we wouldn’t be far off the mark were we to say that the fuel bill of such a company represents 50% of its total costs. Consider this: An 8,000 TEU containership, at a speed of 24 knots, burns 240 tons/day. At a fuel price of $400/ton, a round trip Asia-Europe (42 days at sea) would cost 240 × 42 × 400 = (approx.) $4 million in fuel only. The ship can make six (if not seven) such trips per year and a large company would have (or operate) more than 300 ships. Hundreds of millions can thus be saved by selecting the right speed, particularly when fuel prices are high.Footnote 28 What would therefore take a ship to go faster? Apparently, well-paying freight rates to start with.
Let me, therefore, do what I have promised you, and derive the company’s short-run supply curve and from this the optimum speed of its ships. But first, as usual, our variables (Table 4) and some basic economic relationships.
Our speed optimization exercise assumes a fixed period of time, T, during which a certain (cargo-carrying) distance, d, is covered, function of the employed speed, s. For our purposes, the length of T is immaterial and it could be a day, a month or a year. An important (technical) parameter is k. This parameter is calculated by naval architects and marine engineers and, being a function of such technical characteristics of the ship as design, engine efficiency and maintenance, it influences the relationship between fuel consumption and speed. The cost variables at the end of Table 4 are new to our discussion so far, but require little explanation for someone versed in some elementary economics.
The total costs of the ship, TC, are the sum of its fixed costs (TFC) and variable costs (TVC); i.e. TC = TFC + TVC. Alternatively, a ship’s total costs consist of its capital costs (CC); operating costs (OC) and voyage costs (VC).Footnote 29 That is, TC = CC + OC + VC. As we optimize over a fixed period of time, T, capital and operating costs can be considered as fixed: Simply put, no matter how much work the ship will complete in this relatively short period of time (i.e., what distance it will cover), the shipowner will pay the same amount of money to the bank, to salaries and to insurers. We can thus write CC + OC = α, and the only variable cost is then “fuel”. Accordingly,
-
$$ \text{VC} = \text{fuel costs} = p \cdot C_{\rm s} \cdot T $$
-
$$ C_{\rm s} = ks^{3} $$
-
$$ s = \frac{d}{T} $$
-
$$ C_{\rm s} = \left({{\raise0.7ex\hbox{$k$} \!\mathord{\left/{\vphantom {k {T^{3}}}}\right.\kern-0pt} \!\lower0.7ex\hbox{${T^{3}}$}}} \right)d^{3} $$
-
$$ \text{VC} = \frac{pTk}{{T^{3}}}d^{3} = \frac{pk}{{T^{2}}}d^{3} $$$$ \text{TC} = \alpha + \frac{pk}{{T^{2}}}d^{3} $$(15)
Differentiating the total cost Eq. 15 above with respect to d and setting the derivative equal to freight rate (i.e. the profit maximizing condition MC = f) we get:
Solving Eq. 16 for d will give us Koopmans’ supply function of Fig. 12 (second and third stages):
Dividing both sides of Eq. 17 by T we derive the ship’s optimum speed in period T, at freight rates f, and price of bunker fuel p. The inverse relationship between speed and price of fuel (slow-steaming) can be seen both here (Eq. 18), and in Fig. 14 below.

Supply of tonnage–optimum speed–freight rates–bunker fuel prices: the basic economic relationships
Figure 14 wraps up our discourse on the relationship between supply of tonnage and optimum speed on the one hand, and freight rates and bunker fuel prices on the other. Briefly, ship productivity and optimum speed are both increasing functions of freight rates and decreasing functions of fuel prices.
13 Market structure in container shipping
13.1 Declining costs industries or industries of increasing returns to scale
Perhaps one of the most notable characteristics of liner shipping is its high fixed costs, and this is why. In order to keep to its pre-advertised time-schedule, a ship must leave port regardless whether it is full or not. Her costs thus become fixed, i.e. independent of the amount of cargo carried. The only variable costs in this regard are Terminal Handling Charges (THC). Next, imagine the admittedly simplified caseFootnote 30 where, minutes before the ship sets sail, an unexpected customer arrives at the port with one container to ship. If the vessel has spare capacity, which is often the case in liner shipping, since it is a declining costs industry, or an industry of increasing returns to scale (IRS), her operator might be tempted to accept the extra container at a price as low as merely the extra (marginal) cargo handling costs involved in taking the container aboard.Footnote 31 However, if this were to become common practice among carriers, competition among them could become destructive competition, pushing prices down to the level of short-run marginal costs. Consequently, liner services would not be sustainable in the long-run, as operators would not be able to recover costs in full, most importantly capital costs, such as depreciation allowances, for the eventual replacement of the ship (Fig. 15).

Declining cost industries (increasing returns to scale)
Figure 15 exemplifies the above point. In declining cost industries, marginal costs (MC) are always lower than average total costs (ATC) and, with a production of 0Q, marginal cost pricing at F1 would generate losses equal to F1ABF2. At that level of output, the company covers its variable costs (0QCF), but only part (FCAF1) of its total fixed costs (FCBF2).
13.2 Liner shipping conferences
Liner shipping is by no means unique with regard to the possibility of destructive competition. All national declining cost industries, i.e. “high fixed—low variable” cost industries, from agriculture and pharmaceuticals to steel, aviation, railroads and shipbuilding, have historically enjoyed some degree of protection from price competition.Footnote 32 But shipping is a predominantly international industry and, thus, no national laws could possibly apply to regulate competition.
It has thus been considered that price competition should be limited through a self-regulating mechanism, allowing carriers to charge on the basis of long-run average costs, to the benefit of a sustainable, regular, frequent and reliable service, according to the requirements of demand (i.e. the shippers themselves). Moreover, the freight rate instability that would otherwise ensue as a result of unlimited competition—something quite common in bulk shipping—has always been abhorred by shippers, who have consistently argued in favour of stable and predictable prices (for them, transport costs). On the rate stability aspect, Fig. 16 compares the fairly stable liner tariffs with volatile bulk shipping freight rates (left part), and the variability of liner tariffs, due to deregulation (i.e. limitation of conferences’ powers) in the North Atlantic market (right part).Footnote 33

Freight rate (in)stability in bulk and liner shipping
This rate-stabilizing mechanism was found in the face of conferences. These are price-setting cooperative schemes among carriers, aiming at the limitation of price competition and at the setting of tariffs at “minimum common denominator”, namely, at a level covering the long-run average cost of the most inefficient member of the scheme. This allows a sustainable service in the long-run, to the benefit of the shipper who, as stated, requires stable and predictable transport costs (Haralambides 2004).
In the UNCTAD Code of Conduct for Liner Conferences, the term conference or liner conference is defined as […] a group of two or more vessel operating carriers which provides international liner services for the carriage of cargo on a particular route or routes within specified geographical limits and which has an agreement or arrangement, whatever its nature, within the framework of which they operate under uniform or common freight rates and any other agreed conditions with respect to the provision of liner services…
Daniel Marx Jr. (1953) in his celebrated book defines shipping conferences, or rings—among the earliest cartels in international trade—as “[…] agreements organised by shipping lines to restrict or eliminate competition, to regulate and rationalise sailing schedules and ports of call, and occasionally to arrange for the pooling of cargo, freight monies or net earnings. They generally control prices, i.e. freight rates and passenger fares. The nature of their organisation varies considerably, depending on the market structure of the trade route. Some have been conferences quite literally—informal oral conferences—but many have employed written agreements establishing a permanent body with a chairman or secretary, and containing carefully described rights and obligations of the conference membership…”
Historically, the limitation of price competition has obliged conference members to compete on quality of service. A good insight into the role of the quality variable in liner shipping can be found in Devanney et al. (1975). These authors observe that conferences, while often considered monopolists, do not actually earn the corresponding monopoly profits. They explain this by pointing to the strong competition among conference members on the quality of service. When price is fixed, differentiation on quality is the only way a conference member can increase its own revenue at the cost of other members. Devanney et al. (1975) suggested that the main variable in this competition was speed: some conference members were simply able to offer quicker services or, in case of difficult circumstances such as congestion in ports or bad weather, they were in a better position to maintain the integrity of sailing schedules. Nowadays, quality variables are considered to be the provision of information and EDI systems, logistical services of all sorts, better coordination and integration with inland transport companies and facilities, ownership of terminals and equipment, frequency of service, geographical coverage, and, in general, supply chain integration and management.
It all honesty, it must be said that conferences pre-existed the destructive competition concerns of carriers, and in reality conferences were conceived as mechanisms to protect trade (often combined with gunpoint diplomacy) between the metropolis and its colonies. In modern times, conferences have been allowed to exist, so far exempted from anti-trust legislation, on the basis of “sustainability of service” arguments such as stated. Such regulatory leniency however has not come without the sometimes severe criticism and outcry of many shippers (cargo owners) who have seen price-setting; price discrimination; port, cargo and market share allocations; secrecy of conference agreements and similar restrictive business practices, exercised by conferences, as not promoting trade to the detriment of the consumer. Moreover, the European Court of Justice has rightly argued that “rate stability” cannot be an objective in itself and “stability” per se cannot be more important than competition.
In 2008, the European Commission, under strong lobbying from the European Shippers’ Council (ESC), banned conferences to and from its territory. I was against this decision, and in the “Erasmus Report” (Haralambides et al. 2003), prepared for the Competition Directorate General of the European CommissionFootnote 34 (DG COMP), I claimed that conferences were a low-cost necessary evil and the removal of some self-regulatory power from an industry as international as liner shipping, where no national competition law could apparently apply, would lead—with mathematical certainty—to higher rate instability and transport system unreliability, seriously jeopardizing global Just-in-Time systems of production and distribution. In addition, such a step was bound to invoke further consolidation in shipping, such as mergers, consortia, and alliances. At the end of the day, the European citizen would again have to foot the bill of ill-conceived and introvert policies that ran against global European competitiveness. At the time of writing (2019—i.e. 16 years later), these findings have been fully confirmed.
In the earlier days, conferences had indeed been known to exercise price discrimination—the ultimate trait of monopoly pricing—according to the principle of charge what the traffic can bear. In brief, what this means is that the carrier had the ability to assess the price elasticity of transport demand for a certain cargo and charge the shipper according to his ability or willingness to pay.Footnote 35 In economics jargon, price discrimination enables the carrier to extract most of consumer surplus for himself, converting it into producer surplus (Fig. 17).
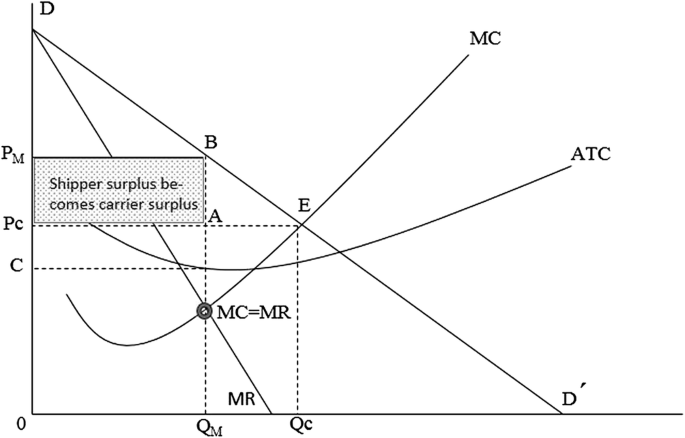
Pricing in imperfectly competitive markets
The liner conference of Fig. 17 reduces carrying capacity from QC to QM, charging a tariff (PM) considerably higher than the competitive tariff (PC). Correspondingly, the competitive shipper surplus of PCED reduces to PMBD, with part of the difference (PCPMBA) becoming carrier surplus.Footnote 36
Such practices, however, have become less and less common as a result of containerization and the consequent charging of uniform rates per container. Obviously, containerization has made it difficult to justify price discrimination based on an alleged need for different treatment of goods according to their particular characteristics (such as volume, stowage, cargo handling, etc.). In this way, containerization commoditized liner services, thus increasing price competition among carriers.
Price discrimination in liner shipping has been viewed both negatively and positively. First, regardless of whether price discrimination is effectively exercised or not, only the potential ability of carriers to do so demonstrates a certain degree of monopoly power justifiably ostracized by consumers and regulators alike. However, price discrimination, or better, in this case, price differentiation, has also been seen positively in the sense that it has promoted trade by making possible the exportation of low value, price-sensitive commodities, many originating from developing countries. Furthermore, it has often been argued, price discrimination introduces, paradoxically, an element of competition, in that it attracts hit-and-run operators who, with minimal infrastructure and other overheads, can “skim” the market, targeting high-value goods only, by rigorously undercutting conference prices. As a result, conferences have traditionally tried to exclude independent outsiders through a number of devices such as fighting ships (price wars), deferred rebates, loyalty agreements and so on.Footnote 37
Notwithstanding those practices, the issue of monopoly power and the ensuing pricing strategies of conferences have constituted important research areas of market structure modelling in liner shipping. Whether price discrimination—which has undoubtedly been exercised by conferences in the past—aims at profit maximization or merely at allowing low-value cargoes to be transported (in order to increase ship capacity utilisation and/or expand geographical coverage to peripheral or otherwise uninteresting regions such as Africa and Latin America) remains to be seen. Research results have not been conclusive given the inherent difficulties in measuring price elasticities of a miscellany of goods loaded at a great number of ports around the world (Sjostrom 1992).
13.3 The issue of monopoly power
The pricing behaviour of a firm gives an indication on the competitiveness of the market in which it operates. How competitive is, therefore, container shipping as an industry? Have conferences been able to abuse their price setting privilege, discriminate, and charge prices well above costs? Do alliances “manage capacity” and are their practices compliant with competition law? At first sight the answer should be no in both cases.
Figure 18 shows that, in the 35 years from 1968 to 2003, real tariffs in the Pacific have declined by 75%. One could, therefore, legitimately claim that even if conferences did have some monopoly power over their rates, they have been quite unsuccessful in exercising it. The counter argument is of course that this decline in rates has been the result of the economies of scale of the larger ships and that, as a result, in the absence of conference-pricing, rates could have declined even more.

Liner tariffs, trans-Pacific east-bound, 1968–2003, $/FEU
Whatever the case, how can abuse be defined and measured? Are tariffs cost-based (competition) or do companies charge according to what the traffic can bear (monopoly)? Such studies have been done in aviation but not yet in shipping, due to secrecy and unavailability of cost and tariff data.
Abuse can be established by calculating a firm’s degree of market power: a measure showing by how much a producer, such as a conference, can maintain prices above marginal costs. Let us try to formalize somewhat our discussion here, assuming for the time being that container shipping is an imperfectly competitive market, such as a monopoly, where the producer is a price-maker, able to discriminate among buyers, selling different quantities (q) at different prices (f). In such a case:
While price, f, is now no longer externally determined but a function of quantity sold, q; i.e. \( f = g\left(q \right) \)
Marginal revenue, MR, would then be: \( \text{MR} = \frac{\partial R}{\partial q} = f + q\frac{\partial f}{\partial q} = f\left({1 + \frac{q}{f}\frac{\partial f}{\partial q}} \right), \) or:
where e is the price elasticity of demand and MC is marginal cost.
Finally, this can be written as:
This expression (Eq. 19), in other words, the inverse of the price elasticity of demand at equilibrium, 1/e, is known as the Lerner Index of Monopoly Power (Lerner 1934). Knowledge of e (of different cargoes or of different shippers) is of paramount importance for the pricing strategy of a liner shipping company. Often, this strategy is known under the term market segmentation (see also what follows): through a large sales force, carriers are in constant contact with shippers, offering them a miscellany of logistics services, mining in this way their willingness to pay for them. This information is subsequently collected centrally and analyzed by the carrier’s research department to calculate e.
We should remember that the source of welfare loss under monopoly is the restriction of output, which raises the price above marginal cost. It is natural therefore to measure the degree of market power by the extent to which the monopolist can hold the price above MC. (Equation 19 gives the proportional excess of price over marginal cost.)
Even for a monopolist, however, there is a limit to his control over price: this is determined by the extent to which customers leave when prices increase. If the quantity demanded is sensitive to price, the price elasticity of demand will be large. The right hand side of Eq. 19 will thus be small and so would have to be the numerator of the left-hand side. In other words, the profit-maximising price will have to be close to marginal cost. In such a market, the profit-maximising monopolist will restrict output only slightly below the competitive level.
On the other hand, if the price elasticity of demand is small, the monopolist has more leeway to raise prices. When the quantity demanded does not decline much as the price rises, the profit maximising monopolist will be able to raise the price above marginal cost without suffering substantial losses in patronage.
14 Carrier strategies
14.1 “Retailer–wholesaler” cargo attraction strategies of carriers
A digression might be in order at this point on the issue of market segmentation, i.e. a carrier’s ability to split its customer base according to customers’ (shippers) willingness to pay for certain tailor-made services.
One can distinguish two carrier strategies which I have earlier coined the retailer and the wholesaler strategies (Fig. 19). In the former, the carrier is himself targeting the individual shipper/consignee, through a large global salesforce which could easily eat up a substantial chunk of his budget (see “marketing and sales” in Fig. 19). The salesperson would call up his account at least once a week, while I still remember consignees complaining of being overwhelmed by SMSs, many times a day, telling them the exact whereabouts of their container. This information is subsequently collected centrally so as to decide (a) which shipper should be targeted further with a higher sales effort and resources, and who should be instead ignored;Footnote 38 (b) the sales targets for the following year, to be subsequently disseminated downwards to the whole sales network.

Retailer–wholesaler strategies of carriers
In order to fill the ship, the wholesaler strategy depends instead on the freight forwarder, or the Non Vessel Owning Common Carrier (NVOCC), or both. The former assumes no risk, simply matching shipper demand with available shipping capacity. The NVOCC instead—and here one should include all global logistics service providers (LSP)—purchases shipping space in advance, thus becoming a “virtual” non-vessel owning carrier, and by doing so he assumes the market risk of filling the capacity he has pre-paid.
14.2 Differentiation and vertical integration along the supply chain: a premium price for a superior service?
The retailer strategy is of course part of a carrier’s wider strategy of differentiation and vertical integration along the supply chain. This is why:
Containerization has gradually led to the commoditization of the ocean (port-to-port) liner service: All carriers have more or less the same ships, sail at the same speeds, call at the same ports with the same frequency, and charge fairly similar spot tariffs. Thus, for the shipper, a slot is a slot is a slot and—other things being equal—he should normally care little if his container arrived in Rotterdam on a Maersk or NYK ship. He should also care little if his container arrived in Vienna through Hamburg, Rotterdam or Antwerp.
This situation has led to excruciating competition among carriers who—in the 1990s—realized that survival meant differentiation.Footnote 39 They thus started to invest in the other components of the supply chain, such as container terminals, distribution centres, road, rail and air transport means, as well as in a miscellany of other value-adding services, such as bar-coding, assembly, documentation, customs clearance, etc. I remember, during my 10 years of training the managers of NOL/APL of Singapore, managers telling me that they would advise a shirt manufacturer, all the way from his production line in Shenzhen, to the shelf his shirts should be placed on in downtown New York. A retailer carrier, at that time, had a global sales-force which, for some, was representing 20% of their running costs, if not more (Fig. 19). Today (2019), in the carriers’ cost-cutting strife, this has dropped to zero. “There is no one to talk to”, one shipper complained to me. “Well”, I replied, “you should have known better, my friend. But it is never too late. You have saved more than enough from the shipping industry’s rock bottom tariffs. And if now, after having ‘killed’ conference stability, you want higher quality, predictability, traceability, lower inventory and supply chain costs, like in the past, I am afraid you will have to put your hand deeper in your pocket…”.
Investment in logistics services and related infrastructure, rather than in ships, which, incidentally, could be chartered in from private equity investors (e.g. the KG funds in Germany), allowed carriers to become more asset light, thus more agile in coping with the fluctuations of the business cycle.Footnote 40 The example of global forwarders and 3PLs was very convincing: They suffered the least from the 2009 economic meltdown just because they didn’t own any ships but were able to “buy” capacity as and when required. There is considerable anecdotal evidence to support this: The return on investment (RoI) of global forwarders and NVOCCs is much higher (and more stable) than that of carriers, just because the former can “ride the business cycle”, chartering in and out at will, while carriers are stuck and burdened with ship tonnage, “sinking” with it in every market downturn.
In addition to service differentiation, vertical integration also serves in increasing both the complexity of operations and the sunk costs of aspiring new competitors (carriers),Footnote 41 particularly if shippers are convinced, through effective marketing, that an integrated service is the only way to better serve their requirements.
14.3 Bundle your services and price them intelligently
All of this would be fine, were it not for carriers who, in their anxiety to fill their ever bigger ships, have been found quite willing to sell capacity to NVOCCs, thus making them both their customers and their competitors. Recent estimates raise the percentage of NVOCC-managed capacity to 40% of total liner shipping slot capacity. I have always maintained that this carrier strategy is a folly: Building larger and larger ships, while knowing that you will be unable to fill them, and then selling the extra capacity to your competitor corresponds to nothing less than offering him the knife to stab you in the back (each time I raise this question with a carrier, the answer is invariably the same: “What can I do? They are big clients and help me fill the ship”. It hasn’t dawned on them—or has it finally—that perhaps they build bigger ships than necessary!).
In the carrier-NVOCC arm-wrestling for the control of the supply chain, the carrier possesses a distinct comparative advantage his competitor doesn’t but desperately needs: the ship. Why should a carrier share this advantage with his competitor? Wouldn’t in fact be more reasonable, instead of creating surplus carrying capacity, to coordinate better with his alliance partners?
A novel idea we have recently proposed to carriers (Haralambides and Acciaro 2010), in an effort to create “leverage” for them against 3PLs, is pricing of all-in, door-to-door, services that is leveraged around the component carriers maintain a comparative advantage; i.e. the ocean transportation leg of the supply chain. In economics, this pricing strategy is known as raising rival’s costs; i.e., the rival is forced to buy an essential input (shipping) at a higher price. Simply put, this means that the carrier charges a higher price for the ocean transportation leg, where they maintain a comparative advantage (i.e. also the component with the lowest price elasticity of demand), and lower prices for the other components of the supply chain (e.g. road transport) where they compete. From a competitiveness perspective, the door-to-door transport price should remain the same as before, but the NVOCC would now have to pay much more for his ocean freight requirements and this would put him at a comparative disadvantage.
At the time of writing, the situation I have described has started to change. Carriers appear to be returning back to core business, shedding the idea of vertical integration in favor of better horizontal integration (alliances) and dominance in the sector (shipping) where they have the comparative advantage. With all due modesty, for one more time I have been proven right and I argue that this return to roots has been the result of the weakening or banning of conferences, and the low freight rates and service unreliability that have ensued as a result. In 2016, one could bring a TEU from Hong Kong to Rotterdam for $300, far below breakeven point. Laid up container tonnage was 5% of the total fleet (over one million slots) and, interestingly, it was often the largest and newest ships, such as MSC Oscar, which were laid up. To no avail, consignees were desperately looking for someone to talk to on the phone. In complex ports like Los Angeles, the terminal of arrival was often unknown until the last minute. At the other end, in Asia, to be filled, a mega ship would call at far more ports than what its size would warrant, something creating a stowage nightmare at the receiving ports. In short, you had a ghastly mess.Footnote 42
15 Market power: econometric studies
Although the discussion here is dated and it has only historical value in view of the evolution of containerization, I use it because it can still explain, to some extent, differences in tariffs for Asian cargoes destined for the Mediterranean, vis à vis northern European ports, or Asian cargo destined for the East- and West Coast of the United states; differences that cannot be explained merely by differences in transportation costs, as the latter are proxied by navigational distances. Readers could omit this part on econometric studies without loss in textual continuity. I owe thanks to Albert Veenstra for discussing some earlier publications in this section.
The issue of monopoly power has been approached through other avenues as well. A number of econometric models, using cross-section data, have been estimated with varying degrees of success. They all attempt to explain prices (tariffs) through such explanatory variables as the “unit value of the transported goods” (an indicator of price discrimination), “stowage factor” (an alleged cost indicator expressed by the volume/weight ratio of the goods), and the “total trade volume on a route” (indicating the potential for outside competition).
Several authors have presented results on such pricing models, where tariffs were regressed on the above variables. Examples are Deakin and Seward (1973), Bryan (1974), Heaver (1973a), Shneerson (1976), Jansson & Shneerson (1987), Talley and Pope (1985) and Brooks & Button (1994). The models of the first five of these works are rather similar in terms of the selected variables. Their results are also fairly comparable and indicate that both “unit value” and “stowage factor” are important explanatory variables of liner tariffs.
The basic idea with these two variables is that if the “unit value” variable proves to be significant, conferences are able to discriminate on price, and there is thus a considerable degree of monopoly power. If, however, the stowage factor is shown to be the most important explanatory variable, this implies that conferences compete on costs and thus considerable competition prevails in the market.
The inclusion of the “trade volume” variable has given rise to the examination of an interesting phenomenon, which has come to be known as the “inbound-outbound freight rate controversy” (Heaver 1973b). A number of authors have observed that inbound routes usually involve different rates, vis à vis outbound ones in certain areas, even when small trade imbalances exist. This was first noticed in the transatlantic route, but it appeared to exist in other routes as well. Bennathan and Walters (1969), Heaver (1973b), Devanney et al. (1975) and Byington and Olin (1983) have contributed in this discussion. They found that explanations lie in the commodity structure of the inbound and outbound routes, as well as cargo imbalances, which give rise to different levels of competition on the two legs of the route. In this respect, more competition means lower rates.
In the case of the United States and the transatlantic route, Bennathan and Walters (1969) observed a cargo imbalance favouring the outbound leg (US-Europe). This was of course reasonable due to the reconstruction of Europe after a ruinous WWII and the European imports demand this generated; the picture (and the imbalance) is the opposite nowadays. As a result, the authors argued, tramps (i.e. unscheduled independent carriers) were sailing from the US full with bulk cargo, leaving all outbound liner cargo to conferences. Competition from tramps was thus minimal and as a consequence tariffs on the outbound leg were higher than the inbound one (Europe-US) where more competition prevailed. This situation could be explained reasonably well by variables such as trade volume and number of conference and non-conference operators on the route.
In the 1960s, but particularly in the 1970s, containerization virtually eliminated competition from tramps. Obviously, large company size, cargohandling technologies and infrastructural requirements could not be met by the often single-ship tramping companies whose advantage was merely “flexibility”. Interest in the inbound-outbound controversy was thus lost together with the importance of the “stowage factor” as an explanatory variable of liner tariffs.
The demise of the stowage factor was illustrated in the work of Talley and Pope (1985) who obtained data similar to this of Deakin and Seward, Heaver, Bryan, and Jansson and Shneerson, but on a containerised route. These authors found that the stowage factor, previously an important explanatory variable, disappeared from the equation and, at the same time, the coefficient of “unit value” was much smaller than in previous results. Because of the uniform way of treating cargo in a container, these results are not difficult to understand. Brooks and Button (1994) confirmed these results and suggested alternative variables that should nowadays be considered: customer type, direction of trade and type of service.
16 Concentration in container shipping and contestable markets
It is often argued that liner shipping is a highly concentrated industry. The mere fact that, at the time of writing, three global shipping alliances move 80% of global trade in general cargo would prima facie come in support of this assertion (OECD/ITF 2018). But how can we measure concentration and is concentration necessarily a bad thing? Does concentration always lead to market power and if so how do we measure concentration?
16.1 Concentration in liner shipping
In most industrialised countries, central government bodies like the US Bureau of the Census (something like the national statistical service of other countries), the UK Ministry of Industry (where the competition authority also belongs), and the Japanese Fair Trade Commission classify firms in industries according to a system known as the Standard Industrial Classification (SIC). The SIC divides the economy into a hierarchy of industries, ranging from broadly defined categories to very specialized products.
Obviously, the broader the definition of an industry, i.e. the greater the number of dissimilar firms included in it, the less concentrated the industry would appear to be. Unfortunately, disaggregated data are either not collected or are difficult to get by, mainly due to reasons of confidentiality. In 1997, the US replaced SIC by NAICS—North American Industry Classification System—in order to account for new industries and production technologies. NAICS applies to USA, Canada and Mexico (NAFTA) who no longer support SIC. Similar efforts to industry reclassifications are attempted by other countries and competition authorities, tacitly or formally, in order to account for the fact that companies tend to become, again, more focused on core business, i.e. on specific business areas where they can dominate, and, therefore, industries tend to become less fragmented (i.e., more concentrated) (Fig. 20).

Concentration: back to core business
Figure 20 shows that, in the past 20 years, companies have become more focused, while, at the same time, the market share of the top four companies (CR4), in the 900-odd US sectors examined in the example of Fig. 20, has increased from 26% in 1997, to 32% today.
Shipping provides a good and fairly representative example of the new course inversion described above. As we have seen, and contrary to what was the tendency a few years ago, i.e. un-commoditization of service (ocean transportation) and investment in complimentary sectors (logistics), so as to differentiate and thus command a premium price from the willing shipper, companies are again reverting to core business, shedding “peripheral activity” and aiming at greater market share (and thus long-term profit) in core business (transportation), through mergers and the strengthening of strategic alliances.
An easy to use measure of concentration is the concentration ratio, CRx, showing the cumulative market share of the x largest firms in the industry. CR4 = 37.9, for instance, means that the top four liner shipping companies of Fig. 21 have a joint market share of 37.9%.Footnote 44

Liner shipping concentration (2013)
Although the CR makes comparisons between similar industries possible, it suffers from a number of shortcomings. First, the CR returns information only on the largest x firms, ignoring information about the relative size of smaller firms and their size distribution in the market. An example could illustrate this point:Footnote 45
A CR4 of 60% could for instance mean that the largest firm in the market has a market share of 54%, sharing the market with 23 firms, each with a 2% share. However, it could also mean that the four largest firms in the market have 15% each, which they share with four smaller firms, each with a 10% market share. From an industrial policy point of view, the two cases are quite different: the first case is a market with a dominant firm, while the second is an oligopoly. The 4-firm CR provides little guidance here.
Another commonly used method for calculating industry concentration is the Hirschman Herfindahl Index (HHI) or, as it is also known, the Herfindahl Index, H. This measure has the merit of combining information on the market shares of all firms in the industry, not just the largest four or eight of them. The H-index is also used for policy purposes; competition authorities employ it in order to decide which proposed mergers or acquisitions they might consider challenging.
Assume there are N firms in the industry, and si is the market share of firm i. The H-index is the sum of the squared market shares of the N firms:
-
$$ H = \mathop \sum \limits_{i = 1}^{N} s_{i}^{2} = s_{1}^{2} + s_{2}^{2} + \ldots s_{N}^{2} $$
-
$$ 0 \le H \le 1 \left({or 0 \le H \le 10,000} \right) $$
The H-Index ranges between 0 and 1, or 0 and 10,000 depending on how market shares are expressed (i.e. 0.1 or 10%). If a market is supplied by a monopolist, their market share is one (100%) and the value of the index is also one (or 10,000). If there are two firms, each supplying half of the market, then the value of the index would be one half. In the case of three equal-sized firms, the value of the index would be one third, and so on. in general, if there are N equal-sized firms in the industry, the value of the H-index is 1/N; i.e.:
-
$$ H = \left({\frac{1}{N}} \right)^{2} + \left({\frac{1}{N}} \right)^{2} + \ldots + \left({\frac{1}{N}} \right)^{2} = N\left({\frac{1}{N}} \right)^{2} = \frac{1}{N} $$
Thus, as the number of industry firms increase, the value of the index falls from 1 to 0. The larger the value of the H-index, the fewer the number of companies competing in the industry. Often, an industry is considered concentrated if the HHI exceeds 1,800, corresponding to four to five equal-sized firms. What if, however, firms are not of equal size? Let’s consider the following example.
-
1.
$$ H = \left(1 \right)^{2} = 1 $$
-
2.
$$ H = \left({\frac{1}{2}} \right)^{2} + \left({\frac{1}{2}} \right)^{2} = 0.500 $$
-
3.
$$ H = \left({\frac{1}{3}} \right)^{2} + \left({\frac{1}{3}} \right)^{2} + \left({\frac{1}{3}} \right)^{2} = 0.333 $$
-
4.
$$ H = \left({\frac{1}{2}} \right)^{2} + \left({\frac{1}{4}} \right)^{2} + \left({\frac{1}{4}} \right)^{2} = 0.375 $$
The first case represents a monopolist, the second, a duopolist. In the third case, three firms share equally the market among them, while in the last case, one firm supplies half of the market, and two more firms divide equally between them the remaining 50%. The value of the H-index in this last case is 0.375. This is less than 0.5 (the value of the index for two equal-sized firms), but more than 0.333 (the value of the index for three equal-sized firms). In other words, three firms, one larger than the other two, represents a greater industry concentration than three equal-sized firms but a smaller concentration than two equal-sized firms. As an example, in December 2015, Dow Chemical and DuPont announced their intended merger. Subsequently, and if everything would go well, the two chemicals giants planned to split into three specialist companies each of which would have a higher share of its market than either original company had before the deal (The Economist 2016).
Is liner shipping, therefore, a concentrated industry? By inputting the market shares of the top 20 carriers of Fig. 21 in a spreadsheet and calculating and adding their squared values, the result of 548.41 should be derived. Moreover, the number N of equal-sized firms with an H-index = 548.41 should be given by: N = 10,000/548.41 = 18 firms. As 548.41 < 1,800 (normally considered as a threshold), liner shipping should not be considered as a concentrated industry, but this is only half the truth, if not even less than that.
16.2 The concept of the relevant geographic market
From a competition economics and law point of view, the concept of market, which is of interest is the relevant geographic market. In other words, this is the physical place where consumers and suppliers interact for the acquisition/provision of a good or service, and competition among suppliers is prevalent. The consumer is expected to have ample choice, i.e., enough substitute goods should exist to choose from. In the form of a witticism, although, say, Maersk covers a global network (market), the services it offers in South America are not of much use (i.e., relevant) to a shipper in Antwerp, and unless the latter decides to move house to Buenos Aires, they cannot substitute those services for a bad one they may be receiving in Antwerp; neither can they do so if Antwerp tariffs go up. In this sense, the two markets of our example are distinct and geographically irrelevant. Global concentration, in this sense, or to say that Maersk has a 19% worldwide market share, means very little, if anything at all.
A market has thus a geographical attribute which is of relevance in determining concentration and competition.Footnote 46 For instance, the market of the city where the port is located is fairly captive. But as the port tries to extend its hinterland towards the region, the country or the continent, the market becomes just a potentially targetable market, with more players and thus more competition (Fig. 22). To give another example: The Shanghai-Rotterdam port-to-port market may be highly concentrated, with just a handful of carriers offering services, but if one were to consider that, actually, the market is the door-to-door importation of bicycles made in Wuhan, China to Paris, France, then the market is highly competitive with many players offering services, using not only those two ports but many others, at both ends of the trade. Simply put, if the market is port-to-port, it could indeed be concentrated; however, if the market is door-to-door, including a miscellany of add-on logistics services, it could well be considered not concentrated at all.

Source NetMBA.com
Market definition
Therefore, without defining the geographically relevant market, one cannot express opinions as to whether liner shipping as an industry is concentrated or not. Finally, one should not forget that the example and calculations of Fig. 21 hinge on the assumption that these firms operate independently. However, this is not true and, as we have seen, carriers operate within (price-setting) conferences and (capacity-managing) alliances. In some way, it should be these organisations and not the independent carriers themselves which should enter into the concentration calculations.
16.3 Contestable markets
The monopoly/cartel approach to liner shipping has not been able to give convincing answers to a number of important questions. For instance: Does the industry realise supernormal profits (i.e., economic rent)? How is it possible that carriers consistently post meagre financial results and at the same time have such an impressive newbuilding programme? Do alliance members coordinate the size and timing of their investments in new ships? As a result of market structure, are there inherent barriers to entry in container trades? Is vertical integration (logistics) a necessity or an anticompetitive contrivance, meant to keep new competition out? William Baumol’s Theory of Contestable Markets (Baumol et al. 1982), although not universally accepted as conventional wisdom in industrial economics, has been more successful in providing plausible answers to many questions such as this.
In mainstream neoclassical economics, competition is seen to progressively diminish as the number of firms in an industry is reduced.Footnote 47 The reason for this is that the techniques of large-scale production which allow the number of firms to be reduced; effective, complex and expensive government lobbying by incumbent firms; and restrictive trade and product standards regulations, can create difficulties to aspiring newcomers in the form of, for example, capital or scale barriers, or very high transaction costs. During the past 25 years, for instance, the number of start-ups in the US economy has declined precipitously while in the same period, concentration has increased by at least 6% (Fig. 20). With regard to capital requirements, in container shipping, it should be remembered, the provision of a weekly service between SE Asia and NW Europe could require investments in excess of one billion US$ in ships alone.
On the opposite, the theory of contestable markets contends that concentration does not necessarily lead to market power, provided markets are contestable; i.e. easily accessible by new entry. In such cases, only the threat of new entry (potential entry) is enough to discipline incumbents (existing producers) from abusing their market share, thus obliging them to charge prices not far from marginal costs. In this sense, to quote Baumol, “lack of new entry can be a virtue, rather than a vice”.
The theory of contestability brings out one major difference between the European and the American regulator. In Europe, equal emphasis is placed on market share, as well as on its abuse. It is believed that a large market share would, in all likelihood lead to market power, which in turn can lead to loss of social welfare and transfer of income from consumers to producers (Fig. 17). These are aspects less easily acceptable in Europe than in the US.
In the US instead, where the Chicago School has had a marked influence on competition law-making, market share per se is not a major issue. Market share is often considered the outcome of normal business processes, or the most efficient way of organising production. It is rather market power, i.e. the abuse of market share (through high prices, collusion or price discrimination) that ought to be prevented or punished.
The threat of entry is particularly relevant in network industries, such as liner shipping, offering hundreds of services around the world, albeit not all of them equally profitable (e.g. north–south or south–south shipping services). Short-run profitability notwithstanding, such services are important to a liner company, in order to maintain its market share (i.e. long-term growth) and all that comes with it. In such cases, a carrier is susceptible to market niching or cherry-picking: A new entrant, e.g. a regional carrier, with minimum infrastructure and low costs, can target only the profitable, or dense, parts of the network, i.e. the cherry, which was, however, cross-subsidizing the cherry tree (network). If sustained for long, this competition in the market could easily become competition for the market and the incumbent carrier could lose its entire output. A good example of cherry-picking can be found in the demise of the majority of national, legacy, air carriers with the liberalization of the air transport market and the appearance of budget companies, targeting only the dense parts of the network.
In addition to capital requirements and other barriers to entry, however, ease of entry requires also ease of exit. If a potential entrant can recoup the bulk of their initial (entry) costs upon their eventual exit, they will deem themselves to be in a relatively safe situation, and this can make the entry decision much simpler. The existence of sunk costs, i.e. non-recoverable costs, is thus a major consideration that could inhibit new entry and more competition; in their absence, even price wars or other retaliatory responses by the incumbent carrier need not worry a potential entrant, and the entry decision should be based only on the prospect of short-run profit.
Sunk costs are often confused with fixed costs. However, the latter are simply costs that do not vary with output, such as capital costs or depreciation. Sunk costs instead are those costs that cannot be recovered once the firm decides to leave the market. Advertising and brand-name-building costs are good examples here. It is thus possible for fixed costs not to be sunk (you can always sell or charter out a containership if you decide to exit that market) and many variable costs (such as advertising and brand name building) to be sunk. The issue, however, is that the lower the sunk costs, the easier it is to enter and eventually exit a market, i.e., the more contestable the market is.
If potential new carriers have access to the same technology as incumbents (i.e. ships, infrastructure, capital, knowhow, networks, etc.), and they assess entry to be riskless, in terms of limited sunk costs, then even the prospect of a fairly small profit might convince them to enter the market. Industry structure (concentration and number of firms) becomes thus irrelevant and the only way an incumbent monopolist could maintain his position is to make profitable entry impossible. This will necessitate setting prices equal (if not below) to the average cost incurred in producing the desired output, yielding him thereby only normal profit. Such a pricing strategy is known as limit pricing (Fig. 23). Yet, such behaviour is normally expected in competitive markets. Again, this is the full explanation lying behind Baumol’s assertion that an absence of entry in a highly concentrated industry may be a sign of virtue and not vice.

Limit pricing of a dominant firm
Assume MCe, ACe and MRe in Fig. 23 are respectively the marginal cost, average cost, and marginal revenue of the prospective entrant. If the incumbent commits to a capacity QQd (= to 0Qd), the residual demand, i.e. the demand left to the new prospective entrant, is R. The price pe that the latter would achieve, however, at point A where his marginal revenue is equal to his marginal cost, is lower than his average cost and entry is not profitable. By committing to 0Qd capacity instead, the incumbent enjoys a prise Pd which is the limit price.Footnote 48
However, has there been new entry (and exit) in the liner shipping industry? A simple look at the list of carriers of Fig. 21 tells us that the same companies—household names, really—have been there for years, and the only thing that changes from year to year is their ranking. But again, the concept of geographically relevant market comes into play. The real question is not whether new companies appear and vanish in the global liner shipping market, as it regularly happens in bulk shipping, but whether new services, of the same incumbent companies, appear and vanish in a certain market segment or trade route (e.g. Asia-Europe, Transatlantic, and Transpacific), and here, the picture is very different, with entry and exit taking place incessantly. Entering ships may be new, but could also be existing previously active in another route, and it is this possibility of shifting ships between routes that makes contestability theory so appealing in container shipping.
16.4 Contestability: the jury is still out
In conclusion, we are living in an era of consolidation that permeates all aspects of life, from economics to politics and international relations. Decision-making power is again centralized, rather than delegated and as a result democratic institutions and values are often under threat. In spite of its alleged and incessantly proclaimed efficiency gains, consolidation is bad news for both employment and price levels. In imperfectly structured markets, such as container shipping, it is doubtful if efficiency gains are passed on to the consumer through lower prices, or are appropriated by the producer through higher profits. Two thirds of Americans believe that their markets are rigged, and this was a central theme in Hilary Clinton’s 2017 electoral campaign.
Moreover, sooner or later, consolidation is bound to lead to market power and rent seeking. An old Greek adage tells us that he who has honey at his fingertips is bound to lick it in the end. In the United States, consolidation in railway transport has seen freight rates rising by 40% in real terms in the last 10 years, while return on capital has doubled since 2014. In the same country, rent seeking, above a “normal” 10% RoC, corresponds to 1.7% of that country’s GDP, or $300 billion (The Economist 2016).Footnote 49
Naturally, consolidation, apart from making new entry more difficult, allows for a better control of supply and the “coordination” or limitation of new investment. Shipping alliances, for instance, have as an objective the more efficient utilization of capacity through joint network planning, vessel swaps and slot-sharing amongst them. From this, however, it is only just a step further to also plan jointly individual carriers’ future investments in new ships and competition authorities have yet something to say on this. Moreover, common shareholders of dominant firms—notably large institutional investors—would have an interest to limit competition among “their” companies and this is most welcome to CEOs who’d rather have a quiet life rather than put their neck on the block by undertaking risky new investments. As Robert Gordon has so succinctly put it […] executives of large corporations do not receive the profits which may result from taking a chance, while their position in the firm may be jeopardized in the event of serious loss (Gordon 1966).
It is often said that the internet makes markets far more efficient and firms more competitive, due to higher transparency, price information to consumers, and elimination of physical distance, an obstacle to consumer choice.Footnote 50 The consumer now shops in global markets, through direct business, with little trade impediments, and low transport costs. Being as it may, though, one could also argue, price information could lead to more consolidation, so as to limit competition and the customer’s ability to shop around.
Issues such as these should normally fall in the ambit of competition authorities. The problem here, however, is that competition authorities are reactive rather than proactive regulators. In other words, their mandate is to ensure that the law is not violated, e.g. that a certain market share threshold is not exceeded by a merger, rather than look into the effects and implications of the merger itself.
17 In lieu of conclusions
Both in the beginning and all along the development of this Editorial, I have posed a great number of questions to my reader: Why do carriers sometimes neglect profitability in favor of market share? Why do they build bigger ships when they know they will be unable to fill them? Why do we use bigger ships in the Pacific Ocean, compared to those deployed in the Atlantic? Why do public ports indirectly “subsidize” (through their investments) gigantism in shipping and then complain about its negative effects? Why, for more than 20 years, Europe has been unable to come up with a coherent port policy? Why do competition authorities all over the world, show such leniency to the rather worrisome concentration in container shipping we observe today? What, if anything, has gone wrong with shipping alliances and are they as disruptive as shippers claim?
Were these the right questions to ask? And if so, have I succeeded in answering them convincingly? Is there something else I should have touched upon and I didn’t?Footnote 51 Therefore, here are, in a nutshell, the most provocative assertions I have posed and the responses I have tried to give.
17.1 The impact of containerization
A central theme that has permeated this work is the development in the size of containerships over the past 30 years or so. And rightly so. The economies that have ensued from the gigantism in ship sizes are profound and so is their role in promoting trade and economic development. Economies of scale in shipping, together with competition among carriers, have reduced transport costs to such an extent that geographical distance plays a much lesser role today, as a determinant of trade between nations, and it is being increasingly replaced in trade models by the concept of economic distance, as the latter is proxied by ocean freight rates (cf. transport costs). At the same time, the reliability of containerization has not only revolutionized cargo systems, but it has also been the “father” of modern day logistics and distribution. The latter systems, in their turn, together with information and communication technologies, have transformed not just transport, but every aspect of our everyday lives.
Although causality in economics is often difficult to establish, I have tried to demonstrate that gigantism in container shipping has been facilitated by increasingly competing ports, concentration in the form of global shipping alliances, and sailing speed of ships, as a function of bunker fuel prices.
17.2 The importance of sailing speed
We have seen that sailing speed is a crucial parameter in determining the effective supply of tonnage in the shipping market and together with “port-speed”, i.e. cargo handling efficiency, the optimum size of containerships on a certain trade route. Effective fuel management along the lines suggested here can save a company millions of dollars each year. Still, however, the present day practice of slow-steaming to save on fuel doesn’t come cheap, as it increases pipeline and other inventory costs of shippers and has, therefore, a negative impact on logistics.
17.3 Diseconomies of scale in container shipping
But let us return. For more than 30 years, I have been preaching that it is port efficiency and productivity themselves, rather than any technological developments in ship design, construction or propulsion, that have induced the gigantism in containerships we observe today. As I argued in the 2017 Editorial (Haralambides 2017), port efficiency and productivity all over the world have been advancing with leaps and bounds, as a result of port competition, brought about by globalization, trade liberalization and competition among exporting nations.
We have seen, however, that there are limits to the growth in ship sizes and these depend on freight demand; port capacity, facilities and technology; land infrastructure; other logistical costs; the future of global shipping alliances; and the attractiveness and future of the hub-and-spoke system in container transportation.
Following the thinking of Kendall (1972) of almost half a century ago, I have also shown (see Haralambides 2017; Fig. 4 on p. 12 there) that—in situations where the ship has to be turned around in a port within a fixed time interval, say with 48 h, irrespective of her size—it costs more to handle a container arriving on a large ship than if it arrived on a smaller one. In other words, cargo handling time per TEU is longer after a certain ship size, and this is a distinct “port diseconomy of scale”.
Big ships impose substantial demands on port capacity, however, without paying commensurately for this demand or, indeed, without bringing more traffic to the port; we saw that call size is only moderately correlated with vessel size. In addition, one can now simultaneously accommodate only two ships of the latest generation (400 m) in 1 km of quay wall, instead of three ships (300 m) of the earlier generation. Berth utilization obviously goes down and so does the utilization of StS cranes, for bigger ships mean lower call frequency.
One needs fewer bigger ships (and thus fewer port calls) to serve a given amount of yearly demand. Thus, connectivity goes down and, with it, the contribution of shipping to trade and development. In addition, a reduction in the frequency of carrier itineraries (i.e. number of services), caused also by slow-steaming, impacts the inventory costs of traders, thus defying the very principles of supply-chain optimization, and this is a clear diseconomy along the supply chain. Finally, filling up the bigger ship in Asia is easier said than done. To do so, the ship has to call at more Asian ports than what her size (and Eq. 12) would warrant, often picking up containers at random and at short notice, without due consideration to the importance of proper stowage planning. As a result, ship and terminal stowage planning at the other end (Europe/North America) often becomes a nightmare.
17.4 The impact of alliances on container shipping and ports
I just stated that the gigantism in shipping has been induced by both port competition and shipping alliances. Indeed, without the ability to use each other’s ships, no carrier alone would be able to achieve a capacity utilization high enough to justify the use of present day mega-ships, while at the same time offering the frequency that shippers demand.
But carriers have gone a step too far: At the time of writing, three alliances carry 80% of global trade. Such consolidation, in an industry that is already highly concentrated, is bound to take place under the increasing scrutiny of the regulator who, with the final consumer in mind, is likely to encourage more competition rather than further consolidation. If this happens, i.e., if container shipping becomes more open and competitive in the future, and alliance agreements regarding vessel sharing, investment planning, etc. are scrutinized more closely for their compatibility with competition law, as I expect, the joint filling of the ship will become more difficult and ship sizes shall by necessity decrease, together with an increase in the number of ports of call. Low prices would then be achieved through more competition rather than big ship sizes. This is more so when it is doubtful if the economies of scale in shipping are passed on to the final consumer, as required by the consortia block exception from the provisions of competition law in Europe.Footnote 52
17.5 A voice from the past: my “second scenario”
There are a number of macro-trends that, in addition to the previously stated, might advocate for smaller ships and more port calls, particularly the latter. In a nutshell: Transshipment costs and if they can help it shippers prefer to have their goods as close to them as possible; Consolidation and distribution use land infrastructure without paying full costs for the private use of a public good; The external costs of hub-and-spoking (congestion, pollution, accidents) may at times be as high as 2% of European GDP. I have thus argued that transshipment, warehousing and distribution don’t come cheap, as our enthusiasm with logistics often assumes. It is good to know this and thus make sure that the costs (internal and external) of logistics operations are paid in full, including the costs of using public infrastructure. The latter because (to a large extent) infrastructure is no longer a public good, and thus the userpays principle should in principle apply.
17.6 Liner shipping conferences
But industry concentration is not something new in liner shipping, and before alliances were invented we had, and still do, liner conferences for more than 100 years. Without going too much in length in these conclusions, one could say that the difference between the two forms of carrier “cooperation” is that, in conferences, profit maximisation is pursued through price-setting while, under alliances, the same objective is pursued through better cost control. From the viewpoints of market efficiency, consumer welfare and shipper interests, the latter pursuit (cost control) is a much better alternative.
Conferences are perhaps the only international price-fixing cartels that have stayed outside the ambit of antitrust regulations for a long time. There are good reasons for this and I would be amiss not to repeat them here.
All national declining cost industries, i.e. “high fixed—low variable” cost industries, from agriculture and pharmaceuticals to steel, aviation, railroads and shipbuilding, have historically enjoyed some degree of protection from price competition. But shipping is a predominantly international industry and, thus, no national laws could possibly apply to regulate competition. It has thus been considered that price competition should be limited through a self-regulating mechanism, allowing carriers to charge on the basis of long-run average costs, to the benefit of a sustainable, regular, frequent and reliable service, according to the requirements of demand (i.e. the shippers themselves). This rate-stabilizing mechanism was found in the face of conferences.
In 2008, the European Commission, under strong lobbying from the European Shippers’ Council (ESC), banned conferences to and from its territory. In the “Erasmus Report” (Haralambides et al. 2003), prepared for the European Commission, I have shown this to be a very wrong decision: the removal of some self-regulatory power from an industry as international as liner shipping, I had argued, where no national competition law could apparently apply, would lead—with mathematical certainty—to higher rate instability and transport system unreliability, seriously jeopardizing global Just-in-Time systems of production and distribution. In addition, such a step was bound to invoke further consolidation in shipping, in the form of alliances, mergers and acquisitions. At the end of the day, the European citizen would again have to foot the bill of ill-conceived and introvert policies that ran against global European competitiveness. At the time of writing (2019—i.e. 16 years since my 2003 report), these findings have been fully confirmed.
17.7 Concentration in container shipping
There is little doubt that cooperative schemes among carriers, such as those of conferences and alliances constitute forms of industrial concentration, which, in principle, should be abhorred. In spite of its alleged and incessantly proclaimed efficiency gains, consolidation is bad news for both employment and price levels. Also, in imperfectly structured markets, such as container shipping, it is doubtful if efficiency gains are passed on to the consumer through lower prices, or are appropriated by the producer through higher profits. In this regard, I have tried to discuss two things: (a) whether concentration is necessarily a bad thing; (b) in order to say something meaningful about concentration one first needs to define the relevant market to which concentration measures should apply.
17.8 Is container shipping a contestable market?
My answer to (a) has not been very convincing. Using Baumol’s theory of contestable markets, I have argued that concentration might not matter after all, i.e. concentration should not necessarily lead to monopoly power (and its abuse), as long as markets are contestable; in other words, they are markets where entry and exit are easy and exit is relatively costless. The easiness of entry, we have seen, means threat of entry and this is enough to “discipline” incumbent carriers from abusing any monopoly power and charge prices equal (if not below) to the average long-run cost incurred in producing the desired output, yielding them thereby only normal profit. We also argued that in multi-product network industries such as liner shipping, cherry-picking (or cream-skimming or market-niching, as the terms go) by aspiring new entrants could eventually cost incumbents not just a share of their market, but, indeed, their entire market. This, because the cherry (dense liner service) was cross-subsidizing the cherry tree (liner network). As most industrial economists these days, however, I have concluded with a well-known Greek adage: “he who has honey at his fingertips is bound to lick them in the end”; in our case, sooner or later, concentration is bound to lead to monopoly power and rent-seeking by carriers.
17.9 Concentration and the “relevant market”
My reply to (b) is very clear: the wider (geographically) the potential outreach of a seller, the less concentrated his market would be. For instance, the market of the city where the port is located is fairly captive. But as the port tries to extend its hinterland towards the region, the country or the continent, the market becomes just a potentially targetable market, with more players and thus more competition. Simply put, to say that the (global) market share of Maersk Line is 19% means very little as, from a competition point of view, what Maersk does in Latin America has very little relevance in northern Europe. Therefore, to talk about concentration we first need to define a “marketplace”, i.e., the relevant market, in which carriers “actually” compete. But, with global logistics and distribution, this is easier said than done. For instance, The Shanghai-Rotterdam port-to-port market may be highly concentrated, with just a handful of carriers offering services, but if one were to consider that, actually, the market is the door-to-door importation of bicycles made in Wuhan, China to Paris, France, then the market is highly competitive with many players offering services, using not only those two ports but many others, at both ends of the trade. Simply put, if the market is port-to-port, it could indeed be concentrated; if however the market is door-to-door, including a miscellany of add-on logistics services, it could well be considered as not concentrated at all.
17.10 Carrier strategies and a novel pricing concept
Containerization has gradually led to the commoditization of the ocean (port-to-port) liner service. This situation has led to excruciating competition among carriers who—in the 1990s—realized that survival meant differentiation. Investment in logistics services and related infrastructure, rather than in ships, allowed carriers to become more asset light, thus more agile in coping with the vagaries of the business cycle. The example of global forwarders and 3PLs was very convincing: They suffered the least from the 2009 economic meltdown just because they didn’t own any ships but were able to “buy” capacity as and when required. They could thus “ride the business cycle”, chartering in and out at will, while carriers were stuck and burdened with shipping tonnage, “sinking” with it in every market downturn.
All of this would be fine, were it not for carriers who, in their anxiety to fill their ever bigger ships, have been found quite willing to sell capacity to NVOCCs, thus making them both their customers and their competitors. Recent estimates raise the percentage of NVOCC-managed capacity to 40% of total liner shipping slot capacity. I have always maintained that this carrier strategy is a folly: Building larger and larger ships, while knowing that you will be unable to fill them, and then selling the extra capacity to your competitor corresponds to nothing less than offering him the knife to stab you in the back. One could in this sense also argue that the industry has fallen into some sort of vicious circle where the need to cut costs leads to the construction of larger ships, creating overcapacity that depresses rates thus leading to a stronger need to cut costs and so on and so forth.
A novel pricing concept I have recently proposed to carriers, in an effort to create “leverage” for them against 3PLs is pricing of all-in, door-to-door services that is leveraged around the component carriers maintain a comparative advantage; i.e. the ocean transportation leg of the supply chain. In economics, this pricing strategy is known as raising rival’s costs; i.e., the rival is forced to buy an essential input (shipping) at a higher price. Simply put, this means that the carrier charges a higher price for the ocean transportation leg, where he maintains a comparative advantage (i.e. also the component with the lowest price elasticity of demand), and lower prices for the other components of the supply chain (e.g. road transport) where he competes. From a competitiveness perspective, the door-to-door transport price should remain the same as before, but the NVOCC would now have to pay much more for his ocean freight requirements and this would put him at a comparative disadvantage.
By the mid-2000s, the situation I have described had started to change. Carriers appeared to be returning back to core business, shedding the idea of vertical integration in favor of greater market share (and thus long-term profit) in core business (transportation), through mergers and the strengthening of shipping alliances. Better horizontal integration (alliances), therefore, and dominance in the sector (shipping) where they had the comparative advantage was the predominant strategy of carriers. This return to the roots was been the result of the weakening or banning of conferences, and the low freight rates and service unreliability that have ensued as a result.
At the time of writing (December 2018), the situation may again be changing soon, in view of the impending review of the EU consortia regulation. I expert trouble for carriers and so do they. In response, they have started preparing for an attack on alliances by investing again along the supply chain.
Throughout its history, liner shipping has been a never-ending story, opposite to this editorial which, finally, has come to its end.
HE Haralambides
February 2019
Notes
MEL Editorial, Vol. 5, No. 1 (March 2003).
In spite of distances, China buys more iron ore from Brazil, four times farther than Australia; it costs one dollar to transport one can of Heineken beer from Rotterdam to New York and less than 10 dollars to bring an expensive TV set from Busan (Korea) to London. Actually, what matters most these days is not transport costs, but the time of the sea passage (as well as time in port) and the way these times impact the logistics and warehousing costs of traders.
Things nowadays may be somewhat different, but I remember a Greek shipowner friend, years back, telling me that, to run a dry bulk shipping company, the only things you needed were a telephone, a shared office and a part-time secretary.
As we discuss next, Europe these days is served by only three global shipping alliances.
C. Ernest Fayle, in his magnificent account “A short history of the world’s shipping industry”, and in an effort to distinguish tramp from liner shipping, gave us the following definition of a liner service, still fully applicable 85 years later (Fayle 1933): [A liner service is]… one implying…a fleet of ships, under common ownership or management, which provides a fixed service, at regular intervals, between named ports, and offer themselves as common carriers of any goods or passengers requiring shipment between those ports and ready for transit by their sailing dates. A fixed itinerary, inclusion in a regular service, and the obligation to accept cargo from all comers and to sail, whether filled or not, on the date fixed by a published schedule….
Labor productivity in those days was roughly 1 ton per man-hour; with containerization, this went up hundredfold. In the first case, a docker would climb up the gangway 10 times an hour, with a sack of rice on his shoulder. In the second, a crane-driver would load 20 containers of rice onboard the containership, comfortably seated and handling a “joystick” from the cubicle of a ship-to-shore gantry-crane, or from the terminal office, or even from his home! The first docker would be paid peanuts (if he was lucky) while the second has a salary every worker in the world would envy today.
Cases have also been known where inefficient ports were welcomed (if not deliberately pursued) by governments, as an effective tariff and barrier to foreign imports.
The innovation entailed in the concept of containerization is credited to Malcolm Mclean: an American trucker who thought of separating the tractor from the trailer part of his trucks, standardizing (unitizing) the latter (trailer) so as to be able to be transported—with its contents intact—by various transport means, handled at ports by standardized cargo handling equipment (quay cranes), and stacked uniformly one on top of the other, both on ships and at terminals. The container, or the maritime container, as it is often called, is a fairly robust and sturdy structure, manufactured at very high standards, intended to withstand the harshest of conditions, such as those often prevailing on the high seas (Fig. 4). Containers are waterproof, vandal-proof, and adequately ventilated, to avoid possible accumulation of condensation, and, if treated well, they could give their owner many years of problem-free service (the average economic life of a container is 15 years). There are many types of containers (high cube, flat rack, open side, open top, tank, reefer [refrigerated], etc.), depending on the intended use. For more on containers, their production, use, leasing market, etc., see Haralambides (2016).
See below on the economics of hub-and-spoking systems.
This research has been pioneered by Maritime Economics & Logistics (palgrave.com/41278).
With the old locks, the size of a Panamax ship was determined by its beam which could not exceed the 33.53 m width of the locks of the canal. As the “beam-to-length” ratio of a ship is—for safety purposes—fairly fixed, and length alone cannot be extended much (in heavy weather, a “sausage” type ship could easily break in two if, when loaded, it found itself at the top of two wave crests), the maximum size of a Panamax containership was about 4,700 TEU. At a beam of 33.5 m, such a ship can carry 33.5/2.5 = 13.4, or 13 containers across (counting containers astern is fun and an easy way to impress your interlocutor, when asked about the size of a containership sailing at a distance. My students used to do this also with distant bulk carriers, counting their hatch covers: five hatches a handy-max, nine hatches a caper, etc.). The 4,700 TEU Panamax remained the biggest containership afloat for more than 10 years, until 1988, when American President Lines introduced the first post-panamax vessel (5,000–6,000 TEU), which, coming from Asia, would reach the East Coast of the USA no longer through the Panama Canal, but either intermodally, by road/rail over the US “land-bridge” from Los Angeles—Long Beach to New York or by sailing around Cape Horn. Thus, 1988 was the year when the apparently unstoppable gigantism in shipping started.
The shipping or port professional need to realize that examples like this have an expository and educational scope, rather than a technical one, and thus a number of, sometimes oversimplified, assumptions need to be made. Otherwise, the complexity of the actual case could easily and quickly distract and deprive the reader of any educational benefit, insight or understanding of the wider issues. One thing is for sure though, and I could confidently reassure the reader that our over-simplifications do not in any way distort or alter the “larger picture” I am trying to paint. Thus, here, port time is actually berth time, and waiting for the pilot or for an available berth are not taken into account. It is also assumed that, to load the ship, you first need to unload it completely. Our boldest assumption is that call size, i.e. the number of containers intended for that particular port only, in the ship’s rotation, is not taken into account but we instead assume that the ship comes in full, unloads everything, and loads down to her marks again before leaving; but on all this I am reverting below.
Atlantic and Pacific Oceans, Europe-Far East and Intra-Asian (+Australasia).
Canal dues (Suez and Panama) are not included in voyage (i.e. fuel) costs.
In Europe, the Consortia Block Exemption Regulation (Commission Regulation 906/2009) expires on 25 April 2020. The Regulation declares Article 101(1) TFEU not applicable to certain types of agreements between carriers, to cooperate in “consortia”. The European Commission is presently in the middle of public consultation, evaluating the impact and relevance of the Regulation, in order to determine whether it should be prolonged and, if so, under which conditions.
Crane density is defined as the number of cranes per 300 m of quay length.
UNCTAD’s concept of connectivity is broadly described by the number of weekly services and liner companies active on a certain route. Bigger ships and shipping alliances reduce both the number of services (bigger ships) and the number of (independent) competitors on the route (alliances). For more information on UNCTAD’s Connectivity Index, see Fugazza and Hoffmann (2017).
Similar observations can be made for yard operations, productivity and costs.
In economic terminology, “physical supply” is as stock variable, i.e. it reports the (shipping) capital stock at a point in time, usually at the beginning of the year, while “effective supply” is a flow variable, that is to say it reports the amount of work done (cargo carried) by the “physical supply” over a period of time (such as one year).
Where one ton-mile is the transportation of one ton of cargo over a distance of one mile. To make this point as clear as possible: if you need one ship to carry one million tons of coal from Australia to China in 1 year, you will need four ships to do the same job, if this time, however, you must bring the coal from distant Brazil.
Most people know that Jan Tinbergen (Erasmus University Rotterdam) shared the first Nobel Prize in Economics (1969) with the Norwegian Ragnar Frisch. Not so many maritime economists however know that Tinbergen’s favorite student, Tjalling Koopmans, also shared the 1975 Nobel Prize in Economics with Leonid Kantorovich for their work on activity analysis, the precursor of operations research. Before moving to the United States, at the beginning of WW2, to eventually take over the Cowles Commission, Koopmans was also teaching at Erasmus, filling in for the classes in Mathematical Economics of Jan Tinbergen who had (temporarily) moved to Geneva. Naturally, the book that should lie on each maritime economist’s desk is Koopmans (1939).
This figure is borrowed from my graduate classes in maritime economics and although our concern here is only the “S-line”, the figure, I hope, will prove of interest, if not of use, to the student of maritime economics. It highlights the inelasticity of the demand for tonnage; the existence of a very large “consumer surplus” (a fundamental concept when it comes to the pricing of liner shipping services), and the demand shift factors which, together with the rather unusual shape of the supply curve, give rise to the infamous, pronounced fluctuations in freight rates and ship prices.
In a rising market, a shipowner would prefer to operate spot, rather than lock-in a fixed time-charter hire. His preferences are the opposite in a declining market and, unsurprisingly, the intentions of the charterer are the opposite to those of the shipowner in both market situations.
Anecdotal evidence has it that the newbuilding order would come in first, and then the makeshift shipyard would be quickly put together. Same evidence was reporting 800 new shipyards in China in 2007–2008, demolished eventually in 2009.
From this point on, cargo handling rate and port (terminal) productivity will be used interchangeably.
Off-hire periods, as they are often called, are necessary for statutory maintenance, dry-docking, etc., and, on average, one may safely assume that they last 2 weeks per year.
The graph of the relationship between cargo handling performance and ship productivity is similar and it is not presented here.
Invariably, in the past 10 years, companies slow-steam to save on fuel. Savings are so big that easily allow carriers to introduce an extra ship in their rotations (nine instead of eight, Asia-Europe) to maintain sailing frequencies. This however increases pipeline inventory costs of shippers who dislike this practice.
In our period of time, T, capital costs are those meant to service the loan for the acquisition of the ship, or the amount of money put aside for its amortization. Operating costs consist of salaries, insurance, lubricants and other costs, necessary for the running of the vessel (thus the alternative name often used: “running costs”). Finally, voyage costs consist only of fuel costs, since our calculations, in this instance, do not include port and canal dues.
As I have already explained, perhaps the example is not so “simplified” these days, as ships coming from Asia stop at more ports now to fill up and this causes serious stowage challenges at the other end.
i.e. a couple hundred dollars at most.
Europe’s agricultural policy; Korea’s and China’s shipbuilding subsidies; or the decades-long war between Boeing and Airbus are good cases in point.
The dark blue, declining line shows the development of the Hirschman-Herfindahl (concentration) Index (see what follows). As concentration declines, i.e. competition increases, prices fluctuate more wildly (red line), compared to their relative stability during conference price-setting.
The directorate responsible for the review/repeal of Regulation 4056/86 (liner conferences).
See below section on market segmentation and price discrimination.
In industrial economics, the area ABE is known as “deadweight loss”, having nothing to do, of course, with the deadweight of ships! This is a loss to both carrier and shipper, in other words a loss to society, as a result of monopoly pricing. For the sake of completeness: DD′ is the conference’s demand curve—being also the industry’s demand curve, DQc is its marginal revenue curve, and ATC and MC are respectively the “average total cost” and “marginal cost” curves.
The idea of “fighting ship” is met even today in certain ports, especially in passenger and Ro-Ro transport. In Brindisi, during my term there as president of the port, the Ro-Ro traffic with Greece was virtually monopolized by a certain line. As soon as a second operator appeared, the incumbent line lowered prices and doubled capacity, a textbook example of limit pricing (see what follows). This was enough to dissuade the newcomer from even attempting to enter that market.
Marginal analysis applies here too: the effort I make towards a certain customer is a function of the amount of business I am expecting to get from him, and I shouldn’t waste time and effort on someone who is indifferent to what I have to offer.
The need to differentiate for survival became painfully felt by carriers as soon as the price-setting privilege of conferences was taken away from them in their trades to/from Europe. Differentiating to avoid price competition is a seller’s prime strategy, often achieved through tacit competitor agreements.
At the time of writing, about 50% of total slot capacity is operated capacity, owned in practice by private investors rather than the carriers themselves.
Investing in new tonnage, even when market conditions do not warrant it, may have a similar “dissuasive” effect on new competition (see limit pricing part below).
Lyrics from “The life I Lead” (Mary Poppins) […] A British bank is run with precision. A British home requires nothing less. Tradition, discipline and rules must be the tools; without them: disorder, catastrophe, anarchy, in short you have a ghastly mess.
Interested readers note that this figure is updated daily by Alphaliner (https://alphaliner.axsmarine.com/PublicTop100/).
This and the following example are credited with thanks to Stephen Martin of Krannert Business School on whose book (Advanced Industrial Economics; Blackwell Publishers, 2001) this part leans.
This said, one couldn’t help but wonder: When I can instantly scan the globe to find my next Ferrari (which, most likely, will be located somewhere in China), isn’t geography irrelevant? When any LSP will have the car at my doorstep in Rome in 1 month at most, isn’t geography irrelevant? And should I care as a buyer (consignee) if the car will arrive on a Cosco, MSC, Maersk, Evergreen ship, through Rotterdam, Hamburg or Genoa?
We shouldn’t forget that one of the assumptions of perfect competition is the large number of sellers, none of which are able to influence market prices through their own actions.
For completeness, I should have included the cost curves of the incumbent firm too. In this way, I could have shown to you that, for the incumbent, limit pricing means offering more capacity at a lower price. This though would have complicated the graph unnecessarily.
One could of course question whether, with interest rates nearing zero, a 10% return on capital could be considered “normal”.
In many cities, to draw a parallel, zoning arrangements is a good case in point. You would rarely find two competitors next to each other and even if you do, in all likelihood they will not be selling an identical product.
But of course there is! For a next editorial, hopefully in February 2021, I would like to raise container shipping one notch or two up, through such ratchets as “green” and autonomous ships, Internet of Things, blockchain technologies and more.
Commission Regulation 906/2009.
References
Baumol, W.J., J.C. Panzar, and R.D. Willig. 1982. Contestable Markets and Theory of Industry Structure. New York: Harcourt Brace Jovanovich.
Beenstock, M., and A. Vergottis. 1993. An Econometric Model of World Shipping. London: Chapman & Hall.
Bennathan, E., and A.A. Walters. 1969. The Economics of Ocean Freight Rates. Praeger, New York: Frederick A.
Brooks, M.R., and K.J. Button. 1994. The Determinants of Shipping Rates: A North Atlantic Case Study. Dalhousie University Nova Scotia, Centre of International Business Studies, Report No. 139.
Bryan, I. 1974. Regression Analysis of Ocean Liner Freight Rates on Some Canadian Export Routes. Journal of Transport Economics and Policy 8 (2): 161–173.
Byington, R., and G. Olin. 1983. An Econometric Analysis of Freight Rate Disparities in US Liner Trades. Applied Economics 15: 403–407.
Cariou, P., and H.E. Haralambides. 1999. Capacity Pools in Liner Shipping; An Allocation Model for the East-West Trades. International Association of Maritime Economists, Halifax, Canada, 13–14 September 1999.
Deakin, B.M. in collaboration with T. Seward. 1973. Shipping Conferences—A Study of Their Origins, Development and Economic Practises. Cambridge: Cambridge University Press.
Devanney III, J.W., V.M. Livanos, and R.J. Stewart. 1975. Conference Ratemaking and the West Coast of South America. Journal of Transport Economics and Policy 9: 154–177.
Ernest, C.E. 1933. A Short History of the World’s Shipping Industry. New York: L. MacVeagh, The Dial Press.
European Commission. 1995. Strengthening the Mediterranean Policy of the European Union: Establishing a Euro-Mediterranean Partnership. Communication from the Commission to the Council and the European Parliament. COM(94) 427 final.
Fugazza, M., and J. Hoffmann. 2017. Liner Shipping Connectivity as a Determinant of Trade. Journal of Shipping and Trade 2: 1.
Gordon, R.A. 1966. Business Leadership in the Large Corporation. Berkeley: University of California Press.
Haralambides, H.E. 1998. Future Trends in International Transport and Their Impact on the Mediterranean Region. Second International Transport Conference on the “Development of Transport Connections Between Western Europe, the Mediterranean and the Black Sea”, Sochi, Russia, 2–3 April 1998 (Published also in Shipping International Monthly Review 177 (332), May 1998).
Haralambides, H.E. 2000a. A Second Scenario on the Future of the Hub-and-Spoke System in Liner Shipping. Latin Ports and Shipping 2000 Conference, Lloyd’s List, 14–16 November 2000, Miami, FL, USA.
Haralambides, H.E., S. Tsolakis, and C. Cheung Tam He. 2000b. ‘The Future of the Hub-and-Spoke System in Liner Shipping: From Land- to Sea-Based Logistics’. Special Interest Group on Maritime Transport and Ports (SIG2), World Conference on Transport Research Society (WCTRS), Workshop, University of Genoa, Italy, June 2000.
Haralambides, H.E. 2002. Competition, Excess Capacity and the Pricing of Port Infrastructure. International Journal of Maritime Economics 4: 323–347.
Haralambides, H.E., M. Fusilo, U. Hautau, W. Sjostrom, and A.W. Veenstra. 2003. The Erasmus Report (Consultation Paper on the Review of Council Regulation 4056/86 (Liner Conferences). European Commission Competition Directorate General, Contract No. COMP/2002/16/SI2.346635.
Haralambides, H.E. 2004. Determinants of Price and Price Stability in Liner Shipping. Workshop Proceedings on the Industrial Organization of Shipping and Ports, National University of Singapore, 5–6 March 2004, Singapore.
Haralambides, H.E., S.D. Tsolakis, and C. Cridland. 2005. Econometric Modelling of Newbuilding and Secondhand Ship Prices. In Shipping Economics, ed. K.P.B. Cullinane. Research in Transportation Economics, vol. XII. Amsterdam: Elsevier.
Haralambides, H.E. 2016. Liner Shipping, Containerization, and the Container Leasing Market. Hong Kong: Davenport Laroche.
Haralambides, H.E. 2017. Globalization, Public Sector Reform, and the Role of Ports in International Supply Chains. Maritime Economics & Logistics 19 (1): 1–51.
Haralambides, H.E., and M. Acciaro. 2010. Bundling Transport and Logistics Services in Global Supply Chains. In International Handbook of Maritime Business, ed. K. Cullinane, 123–149. Cheltenham: Edward Elgar.
Heaver, T.D. 1973a. The Structure of Liner Freight Rates. Journal of Transport Economics and Policy 4: 257–265.
Heaver, T.D. (1973b) The Inbound/Outbound Freight Rate Controversy. University of British Columbia, Report.
Hirschman, A.O. 1958. The Strategy of Economic Development. New Haven, CT: Yale University.
Jansson, J.O., and D.O. Shneerson. 1987. Liner Shipping Economics. London: Chapman & Hall.
Kendall, P.M.H. 1972. A Theory of Optimum Ship Size. Journal of Transport Economics and Policy IV (2): 128–146.
Koopmans, T. 1939. Tanker Freight Rates and Tankship Building: An Analysis of Cyclical Fluctuations. Netherlands Economic Institute No. 27. Haarlem: De Erven F. Bohn N.V.
Lerner, A.P. 1934. The Concept of Monopoly and the Measurement of Monopoly. Review of Economic Studies 1: 157–175.
Martin, S. 2001. Advanced Industrial Economics. Malden: Blackwell.
Marx, Daniel. Jr. 1953. International Shipping Cartels: A Study of Industrial Self-Regulation by Shipping Conferences. New York: Greenwood Press.
Myrdal, G. 1957. Economic Theory and Underdeveloped Regions. London: Gerard Duckworth & Co.
Norman, V.D. 1979. The Economics of Bulk Shipping. Report. Bergen: Institute for Shipping Research.
OECD, ITF. 2018. The Impact of Alliances in Container Shipping. Paris: International Transport Forum.
Pettersen Strandenes, S. 2000. The Shipbroking Function and Market Efficiency. International Journal of Maritime Economics 2 (1): 17–26.
Shneerson, D. 1976. The Structure of Liner Freight Rates. Journal of Transport Economics and Policy 10 (1): 52–67.
Sjostrom, W. 1992. Price Discrimination by Shipping Conferences. Logistics and Transportation Review 28: 207–216.
Stiglitz, J.E. 2006. Making Globalization Work. New York: W.W. Norton and Company, Inc.
Stopford, M. 2008. Maritime Economics, 3rd ed. London: Routledge.
Talley, W.K., and J.A. Pope. 1985. Determinants of Liner Conference Rates Under Containerization. International Journal of Transport Economics 12: 145–155.
The Economist. 2016. Too Much of a Good Thing, 26 March 2016.
Tran, N.K., and H.D. Haasis. 2015. An Empirical Study of Fleet Expansion and Growth of Ship Size in Container Liner Shipping. International Journal of Production Economics 159: 241–253.
Veenstra, A.W. 1999. Quantitative Analysis of Shipping Markets. PhD Thesis, Delft University Press, Delft.
Wergeland, T. 1981. Norbulk, a Simulation Model for Bulk Market Freight Rates. Report, Institute of Shipping Research, Bergen.
Author information
Authors and Affiliations
Corresponding author
Rights and permissions
About this article

Cite this article
Haralambides, H.E. Gigantism in container shipping, ports and global logistics: a time-lapse into the future. Marit Econ Logist 21, 1–60 (2019). https://doi.org/10.1057/s41278-018-00116-0
Published:
Issue Date:
DOI: https://doi.org/10.1057/s41278-018-00116-0