
Abstract
Cassava growth in Côte d’Ivoire is affected by the variation in weather conditions and various pests and diseases. Cassava Bacterial Blight is a particularly destructive disease influenced by weather conditions which can lead to 100% yield loss. In order to provide sustainable control strategies, it is essential to understand the occurrence and the behaviour of the disease in the different ecological zones in Côte d’Ivoire. Surveys were carried out in cassava fields from 2014 to 2017 in the seven Ivorian agro-ecological zones. These fields were assessed for the disease presence/absence, the severity index (SI) and the disease incidence (DI). Weather data were provided by weather stations in Côte d’Ivoire. The results of this study showed that the disease was present in mainly the agro-ecological zones 1, 2, 3 and 4 representing the higher yield potential zones of cassava production. Disease expression was variable depending on the years and the prevalent weather conditions in each agro-ecological zone. The high SI and DI were found in the agro-ecological zones 1, 4 and 6. The disease was able to reach rates of 100% in many zones for both SI and DI with dieback incidence mainly in the agro-ecological 1, 4 and 6 zones under unfavourable (low rainfall, RH, NRD) and favourable conditions. It is therefore urgent to implement control strategies such as such as the integration of new cassava varieties, screening under different agro-ecological zones and improvement of varieties in order to provide resistant varieties to the farmers.
1 Introduction
Plant diseases constitute one of the major constraints to agricultural productivity [1]. They are responsible for great damage and can significantly reduce crop performance and yield [2, 3]. These losses have been estimated to reduce global food production by 10–20%, representing a threat to food security [1, 4]. Disease occurrence is strongly related to the interaction between plant-pathogen-environment. According to the climate model predictions, extreme weather conditions would affect the interactions between plants and pathogens and increase risks of plants infection, spatial distribution, incidence and severity of plant diseases [1, 5]. The main weather factors influencing disease development are temperature, light and water [5] and unpredictable disease outbreaks are expected to happen in the event of rapid changes in these factors [6].
Plant disease pathogens infect diverse hosts and in the case of cassava, the major diseases are caused by viruses, fungi and bacteria [7]. The main bacterial disease is Cassava Bacterial Blight (CBB) caused by Xanthomonas phaseoli pv. manihotis (Xpm) [8]. CBB is present in countries where cassava is produced, but its incidence and severity varies [9, 10]. The infectious cycle is strongly dependent on environmental conditions and takes place in two synchronous stages: the survival phase in the dry season and the parasitic phase corresponding to the disease expression in the rainy season. It is mainly during the parasitic period that the disease symptoms are manifested and are influenced by rainfall, high temperature, high relative humidity and high differences between day and night time temperatures [10]. CBB is responsible for high economic losses up to 100% of the total production [11, 12]. The characteristic symptoms of the disease are the wilting of leaves, blighting, angular leaf lesions and stem cankers, stem and leaf exudates and dieback of stems [13]. Loss of fresh roots, planting material, low accumulation of starch in the roots and reduced leaf cover which affects the availability of leafy vegetables and reduces cash income in communities where cassava roots and leaves are sold have been observed and can be high under favourable environmental conditions [10].
The geographical distribution, incidence and severity of the disease have been studied in some countries like Colombia, Togo and Guinea [14,15,16]. These studies were conducted during the rainy seasons and highlighted the prevalence zones of CBB, and the zones with high severities and incidences.
In Côte d’Ivoire, CBB was first reported in the North-western part in 1979 after the devastation caused by the disease [17]. Its presence was confirmed by Kone et al. in 2013 [18] through surveys in the central part of the country and later by Affery et al. [19] in six agro-ecological zones. These studies showed that almost all Ivorian varieties are susceptible to CBB. They also focused on the identification of the sites where CBB was absent/present, the different severities and incidences in these zones. They also helped to establish the health map of the disease in these six agro-ecological zones [19]. Nevertheless, the effect of weather parameters on CBB expression has not been taken into account, despite their important role in the disease expression. Therefore, the study determines the expression and distribution of CBB and the relationship between the weather conditions, the varieties’ susceptibility and the disease’s expression under different agro-ecological zones. This will help to identify the zones susceptible to the disease as well as the weather conditions favouring its expression. Subsequently, this will inform decision making with regards to the control of CBB in Côte d’Ivoire.
2 Materials and methods
2.1 Surveys
Surveys were conducted from 2014 to 2017 in the agro-ecological zones (AEZ) during the short rainy season for the AEZ1, AEZ2, AEZ4 and AEZ5; and unimodal rainy season for the AEZ3, AEZ6 and AEZ7 in different cassava producing areas of Côte d’Ivoire. The period of the surveys, taking into account the length of the short rainy season in the AEZ1, AEZ2, AEZ4 and AEZ5 and the length of the long rainy season in the AEZ3, AEZ6 and AEZ7, has been considered as a limitation of the study because of its possible impact on the observation of the disease expression. The seasons described by EDSCI-II [20] and FAO [21] are in Table 1.
Six agro-ecological zones in 2014 and seven agro-ecological zones in the other years were considered for the survey (Table 1). These zones were identified and defined by Halle and Bruzon [22] according to the pedoclimatic conditions. These zones were grouped into Forest zones for the AEZ1, AEZ2, AEZ3 and AEZ4, Transition zone between the Forest and the Savannah for the AEZ5 and Savannah zone for the AEZ6 and AEZ7. The country was divided into 75 × 75 km grids in QGIS in order to cover all the agro-ecological zones. This was done according to the method used by Poubom et al. [23] in Cameroon. Within each previous 75 × 75 km grid, sampling sites were selected randomly from grids measuring 18 × 18 km in the different agro-ecological zones (AEZ). The grids and cells did not have the same sizes and number of fields because of the shape of the country’s map and those of the AEZ. In each AEZ, three fields per locality were considered for the high cassava production areas. For areas with very low cassava production, one to two fields were considered. The same localities were considered during the surveys and additional localities were visited from one year to another. The fields were different according to the years because famers are practicing land rotation and fallow to break pest and disease cycles, and are harvesting the roots after 8 or 12 months. These aspects constitute a limitation of the study. The fields were chosen 5–10 km apart and their geographical coordinates were recorded using a GARMIN OREGON 550 GPS.
2.2 Observations
Each field was assessed for CBB presence/absence from a random sample of thirty cassava plants. Some diseases such as cassava mosaic diseases caused by the Begomoviruses (African cassava mosaic virus and East-African cassava mosaic virus), anthracnose caused by Colletotrichum gloesoroides f. sp. manihotis Henn and cercospora leaf diseases caused by Colletotrichum (Mycosphaerella) henningsii Allesch, Colletotrichum caribaea Cif. (Phaeoramularia manihotis) and Colletotrichum (Mycosphaerella) vicosae Muler and Chupp were found in some fields and in this case or in case of coinfection between these diseases and CBB, plants only infected by CBB were considered. The meeting point of two diagonal lines was taken as a reference point for the plants’ assessment but this point has not been assessed. The varieties were assessed based on the most representative in the fields. The assessment of different varieties also constitute a limitation of the study. The disease severity and incidence were evaluated based on assessment sheets. Ten plants of the thirty plants were randomly selected for the sampling of leaves, stems and leafstalks per field showing CBB symptoms. The rating scale of CBB severity described by Wydra and Msikita [24] was used. The ratings ranged from 1 to 5 as follows: 1: no symptom; 2: only angular leaf spot; 3: angular leaf spots, wilting, blighting, defoliation, and some exudates on stems/leafstalks; 4: blighting of leaves, wilting, defoliation, exudates, and tip die-back; 5: blighting of leaves, wilting, defoliation, exudates, tip die-back, and plant stunting. The severity index (SI) and disease incidence (DI) were calculated for each field following the formula below as used by Mamba-Mbayi et al. [12].
Maps were developed using the software QGIS version 2.18.4. Weather data (Temperature, Relative Humidity and Rainfall) were collected at the level of the zones from 14 meteorological stations by Sodexam, the weather monitoring institution.
2.3 Data analyses
The data saved in the software Excel were used for the statistical analyses. These analyses were done with the software R version 3.3.3 to identify the areas affected by CBB based on incidence and severity for each of the years. Shapiro statistical tests performed gave significant p-values (p < 2.2e − 16) and showed that the residuals didn’t follow the normal distribution so Kruskal–Wallis test at a threshold of 5% was performed to test for significant differences between the values.
Multiple Linear regression model with interactions was used for the impact of weather parameters and varieties on CBB expression. The selection of the predictive variables explaining the dependent variable was done by the comparison of AIC (Akaike Information Criteria). The residuals didn’t follow a normal distribution therefore, the non-parametric test included the link function Family Gamma was performed to highlight the factors explaining CBB parameters. The correlations (using Spearman test) and interactions were studied in the case of presence of factors explaining the dependent variable.
3 Results
3.1 Varieties encountered in the fields
The varieties assessed during the surveys were constituted of improved (Yavo) and local varieties (Yace, Akama and Diarrassouba). Yavo and Akama were not found in the AEZ7. Yace was found in all the agro-ecological zones. Diarrassouba was found in the AEZ6 and AEZ7. Regarding the varieties’ susceptibility, on the set of the 4 years, Akama was more susceptible in the AEZ6 (SI = 17.28 ± 3.45% and DI = 20.22 ± 4.13%), Yace in the AEZ4 (SI = 16.58 ± 3.11% and DI = 18.14 ± 3.48%), Yavo in the AEZ5 (SI = 19.72 ± 12.98% and DI = 22.78 ± 15.93%) and Diarrassouba in the AEZ6 (SI = 33.65 ± 5.52% and DI = 40.43 ± 6.72%).
By considering the unbalanced set of varieties and the absence of some of them in certain AEZ, the statistical tests showed significant differences between the varieties’ susceptibility (pSI = 7.469e − 05 and pDI = 4.979e − 05) over the set of the years. These differences were mainly between Diarrassouba and the other varieties (Online Resource 1).
The relative information on the significant tests between the varieties’ susceptibility in the different agro-ecological zones are consigned in the Online Resource 2.
In 2014, Akama was more susceptible in the AEZ5 (SI = 15.67 ± 15.67% and DI = 20 ± 20%), Yace in the AEZ4 (SI = 26.33 ± 16.38% and DI = 31.33 ± 20.37%), Yavo in the AEZ1 (SI = 25 ± 16.37% and DI = 25 ± 16.37%) and Diarrassouba in the AEZ6 (SI = 35 ± 20.62% and DI = 42.5 ± 41.23%). The significant tests between the varieties’ susceptibility in the year 2014 and in the different AEZ are summarised in the Online Resources 1 and 3.
In 2015, Akama was more susceptible in the AZE4 (SI = 14.44 ± 6.76% and DI = 16.3 ± 8.19%), Yace in the AEZ6 (SI = 15.17 ± 4.17% and DI = 17.66 ± 5.00%), Yavo in the AEZ1 (SI = 9.28 ± 3.88% and DI = 10.43 ± 4.66%) and Diarrassouba in the AEZ6 (SI and DI = 38.10 ± 13.47%). The significant tests between the varieties’ susceptibility in the year 2015 and in the different AEZ are summarised in the Online Resources 1 and 4.
In 2016, Akama was more susceptible in the AZE4 (SI = 17 ± 0.07% and DI = 18.75 ± 7.79%), Yace in the AEZ1 (SI = 15.17 ± 4.18% and DI = 20.56 ± 5.56%). Yavo presented the highest SI in the AEZ2 (SI = 21.67 ± 12.29%) and the highest DI in the AEZ1 (DI = 27.22 ± 14.46%) and Diarrassouba in the AEZ6 (SI = 25.84 ± 15.05% and DI = 30.00 ± 18.16%). The significant tests between the varieties’ susceptibility in the year 2016 and in the different AEZ are summarised in the Online Resources 1 and 5.
In 2017, Akama was more susceptible in the AZE 4 (SI = DI = 16.67 ± 3.87%), Yace in the AEZ4 (SI = 22.06 ± 5.1% and DI = 23.56 ± 5.74%), Yavo in the AEZ5 (SI = 39.44 ± 21.31% and DI = 45.55 ± 27.38%) and Diarrassouba in the AEZ6 (SI = 33.32 ± 5.59% and DI = 43.54 ± 7.45%). The relative information on the varieties are summarized in Fig. 1a–d and the significant tests between the varieties’ susceptibility in the year 2017 and in the different AEZ are summarised in the Online Resources 1 and 6.

a–d Varieties susceptibility to CBB in the agro-ecological zones of Cote d’Ivoire respectively in 2014, 2015, 2016 and 2017 where SI: Severity Index, DI: Disease Incidence and AEZ: Agro-Ecological Zones
3.2 CBB dispersion
These results refers to the presence/absence of the disease and do not take into account the severity index and incidence of the disease.
-
In 2014: CBB was present in the six agro-ecological zones surveyed.
Regarding the set of the AEZ and based on the assessment of the presence/absence of the disease, of 121 fields distributed across 78 localities, CBB was found present in 40 fields (33.06%) situated in 34 localities (43.59%). The disease was mostly presented in the localities (50.00%) and fields (45.00%) in AEZ1 while the least affected localities (2.94%) and fields (5.00%) were in AEZ6. The relative information on the presence/absence of the disease in the fields/localities of the different AEZ are summarised in Fig. 2a.
Fig. 2 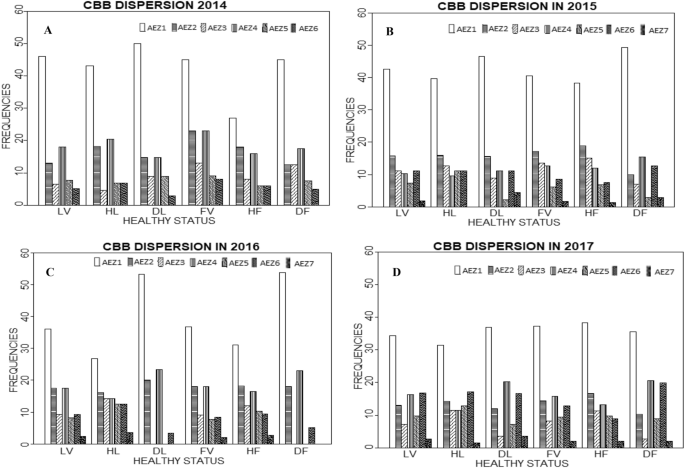
a–d Health status of the localities and fields visited in the agro-ecological zones (AEZ) in 2014, 2015, 2016 and 2017, respectively where LV: Localities Visited; HL: Healthy Localities; DL: Diseased Localities; FV: Fields Visited; HF: Healthy Fields; DF: Diseased Fields
-
In 2015: CBB was present in the seven agro-ecological zones visited.
The assessment of CBB presence/absence in the AEZ showed that of 363 fields distributed across 108 localities, 71 fields (19.56%) situated in 45 localities (41.67%) were diseased. All the localities of AEZ7 were diseased (4.44%). However, the localities and fields of AEZ1 were the most diseased at respectively 46.67% and 49.30%. The least diseased localities were in AEZ5 (2.22%). At the field level, both AEZ5 and AEZ7 were less diseased than the others at 2.82%. The relative information on the presence/absence of the disease in the fields/localities of the different AEZ are presented in Fig. 2b.
-
In 2016: CBB was present in the seven agro-ecological zones visited.
Regarding the set of AEZ, the assessment of CBB presence/absence showed that of 116 fields spread across 86 localities, CBB was present in 39 fields (33.62%) belonging to 30 localities (34.88%). However, it was absent in AEZ3, AEZ5 and AEZ7. The localities and fields of AEZ1 at respectively 53.33% and 53.84% were the most diseased while those of the AEZ5 at respectively 3.33% and 5.13% were the least diseased. The relative information on the presence/absence of the disease in the fields/localities of the different AEZ are summarised in Fig. 2c.
-
In 2017: CBB was also present in the seven agro-ecological zones visited.
The assessment of CBB presence/absence in the AEZ showed that of 404 fields regrouped in 154 localities, 146 fields (36.14%) belonging to 84 localities (54.55%) were diseased. The AEZ1 presented the most diseased localities (36.9%) and fields (35.62%) while AEZ3 and AEZ7 had the least diseased localities with 3.57% both. At the field level, these two AEZ were less diseased but those of the AEZ7 were less affected with 2.05% compared to 2.74% for AEZ3, followed by the other AEZ. The relative information on the presence/absence of the disease in the fields/localities of the different AEZ are presented in the Fig. 2d.

3.3 CBB expression under weather parameters
The amount of Rainfall (RF), Temperature (Temp), Relative Humidity (RH) and Number of Rainy season days (NRD) collected from the meteorological stations were respectively 143.47 ± 2.11 mm, 26.17 ± 0.02 °C, 81.09 ± 0.12% and 14.79 ± 0.21 days during the rainy season across all the AEZ and for the set of the 4 years. RF, Temp, RH and NRD of the dry season before the rainy season are presented in Fig. 3a.

a and c Weather parameters during the dry season respectively on the set of the 4 years and in the agro-ecological zones on the set of the 4 years where RFDS: Rainfall of the Dry Season (mm); TDS: Temperature of the Dry Season (° C); RHDS: Relative Humidity of the Dry Season (%); NRDDS: Number of Rainy Days of the Dry Season (days). b and d Cassava Bacterial Blight (CBB) expression during the rainy season respectively on the set of the 4 years and in the agro-ecological zones on the set of the 4 years where SI: Severity Index (%); DI: Disease Incidence (%); RF: Rainfall (mm); T: Temperature (° C); RH: Relative Humidity (%); NRD: Number of Rainy Days (days)
At the agro-ecological zone level, RF varied from 208.6 ± 4.30 mm (AZE3) to 80.82 ± 3.80 mm (AZE5) while Temp varied from 26.65 ± 0.09 °C (AEZ5) to 25.5 ± 0.07 °C (AEZ3), RH and NRD varied respectively from 83.83 ± 0.14% and 16.72 ± 0.49 days (AZE1) to 77.09 ± 0.13% and 11.93 ± 0.30 days (AZE7) during the rainy season across the years. The dry season’s parameters that prevailed before the rainy season are summarized in Fig. 3c.
CBB severity and incidence assessed during the rainy season were calculated at respectively 10.16 ± 0.64% and 11.27 ± 0.72% for the set of 4 years. The expression of the disease during the rainy season on the set of the four year is presented in Fig. 3b. There were significant differences in CBB expression (pSI = 0.00023, pDI = 0.00020) and weather conditions (pRF = 0.01247, pTemp = 3.491e − 12, pRH = 6.552e − 06, pNRD = 1.961e − 11). The relative information on the significant tests for the disease expression and the weather conditions in the different years are summarised in the Online Resource 7.
CBB was more severe in the AEZ6 with 17.28 ± 2.56% and had a higher incidence with 20.22 ± 3.10% across the 4 years. The AEZ3 recorded the lowest SI (1.99 ± 0.61%) and DI (2.01 ± 0.61%). Regarding SI and DI and going from the most susceptible to the less susceptible, the AEZ4, AEZ1, AZE7, AEZ2 and AEZ5 followed respectively the AEZ6. The data on CBB expression on the set of the 4 years is presented in Fig. 3d.
Statistical analyses showed significant differences for CBB parameters (pSI = 2.042e − 08, pDI = 1.645e − 08) and weather parameters (p < 2.2e − 16) over the set of the AEZ. The relative information on the significant tests for the disease expression and the weather conditions in the different agro-ecological zones are summarised in the Online Resource 8.
3.3.1 CBB expression in 2014
Regarding all the AEZ, this year was characterized by RF of 126.14 ± 3.88 mm while Temp was 26.1 ± 0.04 °C, RH was 80.73 ± 0.35% and the NRD was 16.01 ± 1.65 days during the rainy season. The dry season’s parameters that preceded this rainy season are presented in Fig. 4a.

a and c Weather parameters during the dry season respectively in 2014 and in the agro-ecological zones in 2014where RFDS: Rainfall of the Dry Season (mm); TDS: Temperature of the Dry Season (°C); RHDS: Relative Humidity of the Dry Season (%); NRDDS: Number of Rainy Days of the Dry Season (days). b and d Cassava Bacterial Blight expression during the rainy season respectively in 2014 and in the agro-ecological zones in 2014 where SI: Severity Index (%); DI: Disease Incidence (%); RF: Rainfall (mm); T: Temperature (° C); RH: Relative Humidity (%); NRD: Number of Rainy Days (days)
At the AEZ level, RF varied from 227.10 mm (AZE6) to 36.18 ± 1.10 mm (AZE5) while Temp varied from 26.51 ± 0.38 °C (AEZ5) to 25.88 ± 0.03 °C (AEZ2), RH varied from 84.58 ± 0.27% (AEZ1) to 75.80% (AEZ3) and NRD varied from 21.67 days (AEZ3) to 5.50 days (AEZ6) during the rainy season. The dry season's parameters that prevailed before the rainy season and the rainy season’s parameters are summarized in Fig. 4c, d respectively.
DI and SI for the year were respectively 18.46 ± 2.98% and 16.79 ± 2.68%. The expression of the disease during the rainy season of the year 2014 is presented in Fig. 4b. Regarding the different fields/localities in the AEZ, SI and DI varied from 0 for healthy localities to 100%. The higher severities (75–100%) were found in the localities of AEZ1, AEZ2 and AEZ4 while the higher incidences (75–100%) were found in those of AEZ1, AEZ2, AEZ4 and AEZ6 (Fig. 5a, b).

Overview of CBB severity and incidence in the Agro-ecological zones in 2014. a CBB severity in the Agro-ecological zones. b CBB incidence in the Agro-ecological zones
Statistical analyses did not show significant differences for CBB parameters (pSI = 0.47, pDI = 0.43). Differences were, however, significant for weather parameters (pRF = 2.845e − 15, pTemp = 0.00, pRH = 2.242e − 15 and pNRD < 2.2e − 16). The relative information on the significant tests for the disease expression and the weather conditions in the different agro-ecological zones are summarised in the Online Resource 9.
CBB was more severe in the AEZ4 with a mean of 23.98 ± 6.78% and had a higher incidence with a mean of 27.87 ± 8.12%. The AEZ5 had the lowest rates of CBB with 5.42 ± 5.42% for both SI and DI. The AEZ6 followed the AEZ4 and then AEZ1, AZE7, AEZ2 and AEZ5 for the severity and the disease incidence rates. The relative information on CBB expression is presented in Fig. 4d.
3.3.2 CBB expression in 2015
In 2015 and across all the AEZ, the means were 156 ± 4.16 mm, 26.31 ± 0.02 °C, 81.66 ± 0.19% and 14.04 ± 0.10 days respectively for RF, Temp, RH and NRD for the rainy season. The parameters of the dry season are presented in Fig. 6a.

a, c Weather parameters during the dry season respectively in 2015 and in the agro-ecological zones in 2015 where RFDS: Rainfall of the Dry Season (mm); TDS: Temperature of the Dry Season (° C); RHDS: Relative Humidity of the Dry Season (%); NRDDS: Number of Rainy Days of the Dry Season (days). b, d Cassava Bacterial Blight expression during the rainy season respectively in 2015 and in the agro-ecological zones in 2015 where SI: Severity Index (%); DI: Disease Incidence (%); RF: Rainfall (mm); T: Temperature (° C); RH: Relative Humidity (%); NRD: Number of Rainy Days (days)
At the AEZ level during the rainy reason, RF varied from 253.8 mm (AZE3) to 82.55 ± 1.67 mm (AZE2). Temperature varied from 26.74 ± 0.11 °C (AEZ4) to 25.95 ± 0.04 °C (AEZ5). The highest RH and NRD were respectively 83.78 ± 0.30% and 15.54 ± 0.08 days (AEZ1). The lowest RH was 76.93 ± 0.45% (AEZ4) while the lowest NRD was 10.00 ± 0.00 days (AEZ5). The dry season’s parameters and the rainy season’s parameters are presented in Fig. 6c, d.
SI and DI also varied between 0 for healthy fields/localities to 100% with the higher severities and incidences (75–100%) recorded in AEZ1, AEZ4 and AEZ6 (Fig. 7a, b). Mean SI and DI for the year were respectively 8.17 ± 1.00% and 8.61 ± 1.06%. The expression of the disease during the rainy season of the year 2015 is presented in Fig. 6b.

Overview of CBB severity and incidence in the Agro-ecological zones in 2015. a CBB severity in the Agro-ecological zones. b CBB incidence in the Agro-ecological zones
Statistical analyses did not show significant differences for CBB parameters in the different AEZ (pSI = 0.06, pDI = 0.07). However, differences were significant for weather parameters (pRF = pTemp = pRH = pNRD < 2.2e − 16). The relative information on the significant tests for the disease expression and the weather conditions in the different agro-ecological zones are summarised in the Online Resource 10.
The highest SI (18.60 ± 5.52%) and DI (19.57 ± 5.83%) were recorded in AEZ6. The lowest SI and DI rates were recorded by AEZ5 with 1.67 ± 1.27% for both. The AEZ6 was followed by AEZ7, AEZ1, AZE4, AEZ2 and AEZ3 in term of severity indexes and disease incidences. The relative information on CBB evolution is presented in Fig. 6d.
3.3.3 CBB expression in 2016
In 2016, the amount of RF was 130.86 ± 3.41 mm, Temp was 26.03 ± 0.08 °C, RH was 81 ± 0.30% and NRD was 14.56 ± 0.23 days during the rainy season. The means of the dry season’s parameters are presented in Fig. 8a.

a, c Weather parameters during the dry season respectively in 2016 and in the agro-ecological zones in 2016 where RFDS: Rainfall of the Dry Season (mm); TDS: Temperature of the Dry Season (° C); RHDS: Relative Humidity of the Dry Season (%); NRDDS: Number of Rainy Days of the Dry Season (days). b, d Cassava Bacterial Blight expression during the rainy season respectively in 2016 and in the agro-ecological zones in 2016 where SI: Severity Index (%); DI: Disease Incidence (%); RF: Rainfall (mm); T: Temperature (° C); RH: Relative Humidity (%); NRD: Number of Rainy Days (days)
At the AEZ level, during the rainy season, RF varied from 209.6 mm (AZE3) to 85.47 ± 14.14 mm (AZE5). The temperature varied from 26.79 ± 0.03 °C (AEZ1) to 23.74 °C (AEZ3). RH varied from 84.81 ± 0.52% (AEZ2) to 76.25% (AEZ7). NRD varied from 16.86 ± 0.31 days (AEZ1) to 11.67 ± 0.12 days (AEZ4). The dry season’s parameters that prevailed before the rainy season and the rainy season’s parameters are summarized in Fig. 8c, d.
SI and DI for the year were respectively 9.32 ± 1.55% and 11.51 ± 1.91%. The expression of the disease during the rainy season of the year 2016 is presented in Fig. 8b. SI and DI varied between 0 for healthy localities to 100% for CBB expression. The repartition of the severities and incidences in each AEZ are presented in the Fig. 9a, b.

Overview of CBB severity and incidence in the Agro-ecological zones in 2016. a CBB severity in the Agro-ecological zones. b CBB incidence in the Agro-ecological
Statistical analyses showed significant differences for CBB parameters (pSI = pDI = 0.02), and also for weather parameters (pRF = 9.925e − 15, pTemp = pRH = pNRD < 2.2e − 16). The relative information on the significant tests for the disease expression and the weather conditions in the different agro-ecological zones are summarised in the Online Resource 11. The higher SI (13.92 ± 3.01%) and DI (18.07 ± 3.92%) were found in AEZ1. The lower SI and DI rates were presented by AEZ2 with respectively 6.55 ± 2.70% and 7.98 ± 3.20%. The AEZ1 was followed by AEZ4, AZE6 and AEZ2 in term of severity indexes and disease incidences. The relative information on CBB expression is presented in Fig. 8d.
3.3.4 CBB expression in 2017
In 2017, RF was 142.02 ± 3.45 mm, Temp was 26.13 ± 0.03 °C, RH was 80.71 ± 0.18% and NRD was 15.20 ± 0.18 days for the rainy season. The means of the dry season’s parameters are presented in Fig. 10a.

a, c Weather parameters during the dry season respectively in 2017 and in the agro-ecological zones in 2017 where RFDS: Rainfall of the Dry Season (mm); TDS: Temperature of the Dry Season (°C); RHDS: Relative Humidity of the Dry Season (%); NRDDS: Number of Rainy Days of the Dry Season (days). b, d Cassava Bacterial Blight expression during the rainy season respectively in 2017 and in the agro-ecological zones in 2017 where SI: Severity Index (%); DI: Disease Incidence (%); RF: Rainfall (mm); T: Temperature (°C); RH: Relative Humidity (%); NRD: Number of Rainy Days (days)
At the AEZ level, during the rainy season, RF varied from 187.4 ± 5.45 mm (AEZ1) to 67.42 mm (AEZ7), Temp varied from 27.33 ± 0.06 °C (AEZ5) to 25.33 °C (AEZ3), RH varied from 83.87 ± 0.21% (AEZ1) to 76.6% (AEZ3) and NRD varied from 17.51 ± 0.08 days (AEZ1) to 10.66 ± 2.81 days (AEZ6). The dry season’s parameters that prevailed before the rainy season and the rainy season’s parameters are summarized in Fig. 10c, d.
SI and DI of the year were respectively 10.28 ± 0.94 and 11.42 ± 1.08. The expression of the disease during the rainy season is presented in Fig. 10b.
SI and DI varied between 0 for healthy areas to 100% for CBB expression (Fig. 11a, b). The higher SI (17.95 ± 3.27%) and DI (22.37 ± 4.34%) were found in the AEZ6. The lower SI (0.84 ± 0.43%) and DI (0.91 ± 0.46%) were presented by the AEZ3. The AEZ6 was respectively followed by the AEZ4, AZE1, AEZ5, AEZ7 and AEZ2 in terms of severity indexes and disease incidences. The relative information on CBB expression is consigned in Fig. 10d.

Overview of CBB severity and incidence in the Agro-ecological zones in 2017. a CBB severity in the Agro-ecological zones. b CBB incidence in the Agro-ecological
Statistical analyses showed significant differences for CBB parameters (pSI = 5.226e − 05, pDI = 4.252e − 05) and for weather parameters (p < 2.2e − 16). The relative information on the significant tests for the disease expression and the weather conditions in the different agro-ecological zones are summarised in the Online Resource 12.
3.3.5 Impact of weather parameters and the varieties on CBB expression
Over the four year period, Rainfall and the varieties were the main factors that could explain SI and DI. The Generalized Linear Model showed that across the 4 years, Rainfall had a significant effect on SI and DI (p = 0.01 for both SI and DI). The varieties also had a significant effect on SI (p = 0.00) and DI (p = 6.472e − 05) while RH did not have a significant effect on SI (p = 0.13) and DI (p = 0.10). There was a positive and non-significant interaction between RH and RF (p = 0.31). RH and RF had negative and non-significant interactions with the varieties for both SI and DI (Table 2). However, there was no interaction between RH and Akama, RF and Akama. Spearman’s correlation tests for the set of 4 years showed that, when Rainfall increased, SI and DI decreased (r = − 0.07; p = 0.03 for both), and when RH increased this also lead to a non-significant decrease of SI (p = 0.49) and DI (p = 0.53).
There was no relationship between SI, DI and climatic parameters in 2014.
In 2015, the results of the GLM showed that Rainfall and NRD had a significant effect on SI (p = 3.694e − 05 for RF and p = 0.00 for NRD) and DI (p = 3.207e − 05 for RF and p = 0.00 for NRD). The varieties did not have a significant effect on SI (p = 0.11) and DI (p = 0.14). There was no interaction between Rainfall and NRD on disease expression. The interactions between RF and the varieties and NRD and the varieties on the disease expression were negative and non-significant (Table 3). There was no interaction between the weather parameters and the variety Akama on the disease expression. The correlation tests showed that increased Rainfall decreased SI and DI while NRD increased SI but this correlation was not significant (rRF = − 0.08, pRF = 0.12; rNRD = 0.10, pNRD = 0.06 for both).
In 2016, Temp had a significant effect on SI and DI (p = 0.01 for both). Spearman’s correlation test showed when temperature increased, both SI and DI increased with r = 0.17, p = 0.03 for both.
In 2017, Temp, RH, NRD and the varieties explained the expression of the disease. The results of the GLM showed that Temp, NRD and the varieties had a significant effect on SI (p = 0.00 for Temp, p = 0.01 for NRD and p = 1.487e − 05 for the varieties) and DI (p = 0.00 for Temp, p = 0.02 for NRD and p = 2.042e − 06 for the varieties). RH did not have a significant effect on SI (p = 0.08) and DI (p = 0.10). The interaction between RH and NRD on the disease expression was negative and significant (p = 0.00) while there was non-significant interactions between Temp and NRD on the disease expression (p = 0.78 for SI and p = 0.07 for DI). The interaction between Temp and RH was significant on SI (p = 0.01) and non-significant on DI (p = 0.78). Except for the significant (p = 0.01) interaction between RH and the variety Yace on SI, the interactions between the other weather parameters and the varieties were non-significant on the disease expression (Table 4). The correlations tests showed that the increase of Temp significantly increased SI and DI (r = 0.10, p = 0.04 for both). The increase of RH decreased SI and DI but not significant (r = − 0.03, p = 0.6 for both). The increase of NRD increased SI and DI but was not significant (r = 0.03, p = 0.60 for both).
4 Discussion
This study has some limitations among others the surveys carried out during the short rainy season in the AEZ1, AEZ2, AEZ4 and AEZ5. The disease rates could have been higher if the surveys were carried out in the long rainy season. The different fields considered from one year to another could have played a role in the variation of CBB rates and the impact of the environmental conditions on the disease expression could have been minimized. The high variation in the data due to the fact that in the same AEZ the SI and DI varied from 0 to 100% also constitutes a limitation of the study. The assessment of different varieties also constitute a limitation of the study.
Cassava Bacterial Blight was present in all Ivorian AEZ surveyed and its distribution varied over the years. Fanou et al. [10] also highlighted in their study that CBB is widespread in all worldwide cassava production zones and its distribution varied according to the years. Shaw and Osborne [25] suggested that the persistence of plant pathogens can be infrequent with a low severity in some regions.
Considering the AEZ, CBB prevalence was high in AEZ1 followed by AEZ4 and AEZ2. These results showed that the geographical distribution of the disease was more concentrated in the forest zone (mainly in AEZ1, AEZ2 and AEZ4; except in AEZ3). It could be explained by the fact that cassava is predominantly grown in these zones as previously described by Perrin et al. [26]. According to these workers, farmers use cuttings already contaminated in previous fields and that could explain CBB persistence in subsequent fields. Coakley et al. [27] cited by Ghini et al. [5] also stated that the pathogen geographical repartition is related to those of its host. Their statement could justify CBB distribution in the Ivorian forest zones. The sharing and use of contaminated cuttings could also contribute to the disease dissemination in these zones.
CBB expression depends on the relationship between the pathogen and the host. Almost all Ivorian varieties are susceptible to CBB [19]. Survey results showed that the varieties did not have the same reaction to CBB from one AEZ to another. This fact, also known as an interaction genotype x environment could explain the high disease expression in the AEZ6 where Diarrassouba, the most susceptible variety is grown. Resistance to CBB in cassava is partially hereditary, depending largely on environmental conditions and inoculum pressure [28, 29]. In the event of infection by the pathogen, cassava is likely to respond with a hypersensitivity reaction which reduces pathogen multiplication, leading to an absence of disease symptoms [30, 31]. This hypersensitivity host reaction could explain the low activity in the AEZ3 and the AEZ5 during the different years and also the absence of symptoms in the AEZ3, 5 and 7 in 2016. The bacteria strains would have been unable to overcome the cassava varieties’ defence reactions, in addition to a possible low inoculum pressure in these zones. In the case of compatible host interaction, bacteria strains infect cassava plants and overcome host defence barriers causing the characteristic symptoms of the disease [31]. This could explain CBB manifestation mainly in the other AEZ. According to Elad and Pertot [32], plant’s susceptibility to diseases could increase under abiotic stress. This could explain the high rates of CBB in the different years in the AEZ4 and AEZ1. Indeed, because the strains need marked dry and rainy seasons for their life cycle, the continual rainy conditions in these AEZ should normally constitute a barrier to the disease expression. But the stress imposed by weather conditions to the varieties and the pathogen led to a possible adaptation of the strains and the biggest rates of dieback reached in many localities/fields of these zones. The AEZ3 is characterized by a short dry season and a long rainy season [20, 21]. Its microclimate is therefore unfavourable for CBB development since it rains practically the whole year and Xpm needs a dry season in addition to a wet season for disease development.
In 2014 where CBB disease levels were higher than the other years, weather parameters of the dry seasons, mainly Rainfall and RH, were higher except Temp which was only higher than that of 2015 and NRD that was lower than that of 2015. CBB expression in 2014 could be explained by the possible ability of Xpm strains to overcome unfavourable environmental conditions. The pathogen needs both dry and rainy seasons for its development and to cause the disease. The absence of a marked dry season in 2014 could have affected the pathogen cycle. Only those strains that were able to adapt would have achieved their cycle and caused the disease during the rainy season of 2014. The dry season of 2015 were characterized by a decrease in weather parameters; these parameters then showed an increase during the rainy season except NRD that was lower than that of 2014. The decrease of CBB parameters could be explained by the variation in weather conditions from 2014 to 2015. This would have played an important role in the setting up of the epiphytic period and also affected the expression of the disease during the rainy season of the year 2015.
In 2016, except for Temp, all the weather parameters decreased during the dry season. During the rainy season, the parameters decreased except NRD. These variations in weather conditions would have been less favourable to the disease expression. In 2017 dry season, weather parameters decreased except Temp. During the rainy season, they increased except for RH. There was also an increase in CBB expression. The decrease of weather parameters during the dry season could have provide a more or less stable environment for the primary inoculum establishment. This could have increased Xpm strains ability to cause CBB during the rainy season.
The variation in weather parameters could have played a role in disease expression by providing favourable to unfavourable conditions for disease development in the different AEZ and in the different years. The highest disease level in AEZ6 could be explained by the fact that in Côte d’Ivoire, the AEZ6 is characterized by a long dry season and a long rainy season [20, 21]. During the dry season, weather parameters are characterized by a very low amount or an absence of rainfall, an increase in Temp, a reduction in RH and a short NRD. While the disease expression mainly in the AEZ1 and AEZ4 could be explained by an adaptation of the strains to the environmental conditions and also by the development of new mutant stains in the different AEZ.
The correlation test showing that when Rainfall increased CBB parameters decreased for the set of 4 years could be explained by the continual rain in the dry and the rainy seasons over the years that disrupted the pathogen cycle and the occurrence of the disease. Conditions that prevailed in the AEZ should have been either a total barrier to disease development in the forest zone where CBB was mostly found such as the AEZ1 and the AEZ4 or the main driving factor of its expression in the AEZ6 and AEZ7. Nevertheless, under conditions where CBB should not occur or should occur at a lower extent, Xpm strains were able to cause disease symptoms. It seemed that pathogen is adapting itself to the environmental conditions it is facing in the years of the study and the AEZ so that as soon as it is in the presence of low rates of weather parameters, it caused the disease. This change in a pathogen’s expression due to climate change has been predicted by Harvell et al. [33]. In 2015, the correlation tests indicated that when Rainfall increased, SI and DI decreased. However, an increase in NRD led to an increase in CBB parameters. The increase in Rainfall could have affected the rate of contamination by to the primary inoculum, the concentration and the quality of the secondary inoculum of Xpm. This could have affected their ability to cause the disease and thus, decreased SI and DI. However, the extension of the number of rainy days could have provided a better environment to the strains to adapt, to cause and to increase the disease expression.
Temperature has been described by Yáñez-López et al. [34] and Rana and Randhawa [1] as the main climatic parameter involved in plant disease expression. This explains the positive correlation between Temp and CBB parameters in 2016 where disease parameters increased with an increase in Temp. From 2016 to 2017, SI increased while DI decreased. The increase in SI could be explained by the effect of Temp, RH and NRD in 2017. These weather parameters could have predisposed the varieties to Xpm strains infection by providing a conducive environment to the strains. This could have facilitate the increase of SI. However, the effect of Temp, RH and NRD could have a play a role in the decrease in DI by affecting the rate of Xpm strains reproduction. This could have reduce the extension of the disease.
5 Conclusion
Cassava Bacterial Blight expression from 2014 to 2017 in Côte d’Ivoire showed that the geographical distribution of the disease was concentrated in the forest zone more than in the savannah and the transition zones. From one year to another, it was more prevalent in AEZ1, the larger of the cassava producing zones. The high disease incidence in AEZ1 could lead to higher rates of disease expression due to the planting of infected material. CBB expression varied over the years and also from one agro-ecological zone to another. Dry and rainy seasons were disturbed in Côte d’Ivoire at a level where the dry season was less marked mainly in AEZ1, AEZ2, AEZ3 and AEZ4 which impacted on CBB expression. The AEZ1 and AEZ4 were more affected than they should be and the AEZ3 was still less affected by the disease than the AEZ2. However, while AEZ6 had conditions conducive to its expression, CBB also reached high rates in AEZ4 and AEZ1 where environmental conditions were unfavourable. It means that CBB expression rates and variety susceptibility could increase or decrease according to weather conditions since the pathogen is trying to adapt to them. The occurrence and expression of the disease is thus difficult to predict based on weather parameters and this would lead to dramatic damage in the event of a disease outbreak. Especially given that surveys were carried out during the short rainy season in AEZ1, AEZ2, AEZ4 and AEZ5, disease rates could be higher in these zones if the surveys were conducted in the long rainy season. Sustainable control strategies must be utilised to mitigate the variation in weather parameter effects on CBB expression to ensure cassava food security in Côte d’Ivoire. The integration of new cassava varieties to increase the biodiversity and in breeding programmes could be considered. The changing of planting dates, the development of cassava varieties resistant to both CBB and weather conditions stresses could be undertaken. This could contribute to release disease resistant varieties and disease free cuttings under the various weather conditions to farmers The interaction between the varieties and Xpm strains interaction could be undertaken to highlight the changes that could occurred in the varieties’ response to CBB under the changes in weather conditions. This could give an orientation to the development of resistant varieties. Climate prediction models against plants diseases could be used for monitoring and forecasting CBB epidemic and thus, to reduce the expression of the disease in the different agro-ecological zones.
References
Rana I, Randhawa SS (2014) Impact of climate variations on plant diseases. State Centre on Climate Change (H.P State Council for Science Technology & Environment) Block-34, SDA Complex, Kusumpti, Shimla (H.P)-71009
Reynolds MP (2010) Climate change and crop production. CAB International, Wallingford
Ikram K, Sarra B (2017) Classification algorithms for plant disease forecasting. Thesis, Research Gate. https://doi.org/10.13140/RG.2.2.22515.84009
Strange RN, Scott PR (2005) Plant disease: a threat to global food security. Ann Rev Phytopathol 1:83–116
Ghini R, Hamada E, Bettiol W (2008) Climate change and plant diseases. Sci Agric (Piracicaba, Braz.) 65:98–107
Kliejunas JT, Geils BW, Glaeser JM, Goheen EM, Hennon P, Kim MS, Kope H, Stone J, Sturrock R, Frankel SJ (2009) Review of literature on climate change and forest diseases of Western North America. United States Department of Agriculture Forest Service Pacific Southwest Research Station General Technical Report PSW-GTR-225. October 2009 2–5(6–9):60
Bart RS, Taylor NJ (2017) New opportunities and challenges to engineer disease resistance in cassava, a staple food of African small-holder farmers. PLoS Pathog 13(5):e1006287. https://doi.org/10.1371/journal.ppat.1006287
Constantin EC, Cleenwerck I, Maes M, Baeyen S, Van Malderghem C, De Vos P (2016) Genetic characterization of strains named as Xanthomonas axonopodis pv. Dieffenbachiae leads to a taxonomic revision of the X. axonopodis species complex. Plant Pathol 65:792–806. https://doi.org/10.1111/ppa.12461
Fanou AA, Zinsou VA, Wydra K (2017) Survival of Xanthomonas axonopodis pv. manihotis in weed species and in cassava debris: implication in the epidemiology of Cassava Bacterial Blight. Int J Adv Res 5(4):2098–2112. https://doi.org/10.21474/ijar01/4057
Fanou AA, Zinsou VA, Wydra K (2018) Cassava bacterial blight: a devastating disease of Cassava. IntechOpen. https://doi.org/10.5772/intechopen.71527
Restrepo S, Vélez CM, Verdier V (2000) Measuring the Genetic Diversity of Xanthomonas axonopodis pv. manihotis in Different Fields in Colombia. Phytopathol 90:683–690
Mamba-Mbayi G, Tshilenge-Djim P, Nkongolo KK, Kalonji-Mbuyi A (2014) Characterization of Congolese Strains of Xanthomonas axonopodis pv. manihotis associated with Cassava Bacterial Blight. Am J Plant Sci 5:1191–1201. https://doi.org/10.4236/ajps.2014.59132
Jorge V, Fregene MA, Duque MC, Bonierbale MW, Tohme J, Verdier V (2000) Genetic mapping of resistance to bacterial blight disease in cassava (Manihot esculenta Crantz). TAG Theor Appl Genet 101:865–872
Verdier V, Restrepo S (1997) Répartition géographique de la bactériose vasculaire du manioc en Colombie et variabilité de l’agent pathogène. Dossier: racines, tubercules et plantains n°2. Les cahiers de le Recherche Développement, n°44-1997
Banito A, Verdier V, Kpémoua KE, Wydra K (2007) Assessment of major cassava diseases in Togo in relation to agronomic and environmental characteristics in a systems approach. Afr J Agric Res 2(9):418–428p
Bamkefa BA, Bah ES, Dixon AGO (2011) Survey of the current distribution and status of bacterial blight and fungal diseases of cassava in Guinea. Afr J Root Tuber Crops 9(1):1–5
Aïdara S (1984) Aperçu sur la culture du manioc, Etude du système racinaire du manioc (Variété CB) suivant le système de coupe des boutures et le mode de planting. Rapport de stage. Institut Agricole de Bouaké (I.A.B.), Office de la Recherche Scientifique et Technique Outre-Mer (O.R.S.T.M.), Fonds Documentaire
Kone D, Dao S, Tekete C, Doumbia I, Koita O, Abo K, Wicker E, Verdier V (2013) Confirmation of Xanthomonas axonopodis pv. manihotis Causing Cassava Bacterial Blight in Ivory Coast. Disease Notes. http://dx.doi.org/10.1094/PDIS-02-15-0172-PDN
Affery AM, Abo K, Tuo S, N’Zue B, Kone D (2016) Geographical distribution and incidence of Cassava Bacterial Blight (Manihot esculenta Crantz) Caused by Xanthomonas axonopodis pv. manihotis in Two Agro-ecological Zones of Côte d’Ivoire. Plant Pathol J 16(1):1–11. https://doi.org/10.3923/ppj.2017.1.11
EDSCI-II (1999) Enquête Démographique et de Santé, Caractéristiques du pays et méthodologie de l’enquête, 11
FAO (2005) L’irrigation en Afrique en chiffres—Enquête AQUASTAT 2005, 10
Halle B, Bruzon V (2006) Profil Environnemental de la Côte d’Ivoire. Commission Européenne. Offre de service dans le secteur de la coopération relatif au Contrat Cadre Europe Aid/119860/C/SV/Multi, Consortium AGRIFOR Consult, Rapport final 133P
Poubom CFN, Awah ET, Tchuanyo M, Tengoua F (2005) Farmers’ perceptions of cassava pests and indigenous control methods in Cameroon. Int J Pest Manag 51(2):157–164
Wydra K, Msikita W (1998) Overview of the present situation of cassava diseases in West Africa. In: Akoroda MO, Ekanayake I (eds) Proceedings of 6th Trienn. Symp. Intern. Soc. Trop. Root Crops Africa Branch (ISTRC-AB), Lilongwe, Malawi, 22–28 October 1995, pp. 198–206
Shaw MW, Osborne TM (2011) Geographic distribution of plant pathogens in response to climate change. Plant Pathol 60:31–43. https://doi.org/10.1111/j.1365-3059.2010.02407.x
Perrin A, Ricau P, Rongead CR (2015) Etude de la filière Manioc en Côte d’Ivoire. Projet Promotion et commercialisation de la Banane Plantain et du Manioc en Côte d’Ivoire financé par le Comité Français pour la Solidarité Internationale (CFSI), 84
Coakley SM, Scherm H, Chakraborty S (1999) Climate change and plant disease management. Annu Rev Phytopathol 399-426, 0066-4286/99/0901-0399$08.00. www.annualreviews.org
Hahn SK, Terry ER, Leuschner K, Akobundu IO, Okali C, Lal R (1979) Cassava improvement in Africa. Field Crop Res. 2:193–226
Wydra K (2002) The concept of resistance, tolerance and latency in bacterial diseases: examples from cassava and cowpea. New Aspects of Resistance Research on Cultivated Plants’ Bacterial Diseases. Beitr Züchtungsforsch BAZ 9(3):36–43
Fargier E (2007) The study of the pathology of Xanthomonas campestris and the nature of the genetic structure of its pathovars allowed the improvement of pathogen detection in seeds of Brassicaceae. Doctoral School of ANGERS 65–67:236
Hamza AA (2010) Taxonomy and diagnosis of Xanthomonas species associated with scabies of tomato and Capsicum spp.: situation in the South West Islands of the Ocean Indian, University of Reunion, Faculty of Science and Technology, UMR Peuplements Plants and Bio-aggressors in Tropical Environment CIRAD—University of Reunion 33, 34:234
Elad Y, Pertot I (2014) Climate change impacts on plant pathogens and plant diseases. J Crop Improv. 28:99–139. https://doi.org/10.1080/15427528.2014.865412
Harvell HC, Mitchell CE, Ward JR, Altizer S, Dobson AP, Ostfeld RS, Samuel MD (2002) Climate warming and disease risks for terrestrial and marine biota. Science 296:2158–2162
Yáñez-López R, Torres-Pacheco I, Guevara-González RG, Hernández-Zul MI, Quijano-Carranza JA, Rico-García E (2012) The effect of climate change on plant diseases. Afr J Biotechnol 11(10):2417–2428. https://doi.org/10.5897/ajb10.2442
Funding
This study was funded by German Federal Ministry of Education and Research through the Doctoral Programme (BMBF) West African Science Service Centre on Climate Change and Adapted Land Use (WASCAL) and World Bank through the Centre d’Excellence Africa in sur les Changements Climatiques, la Biodiversité et l’Agriculture Durable (CEA-CCBAD)/Côte d’Ivoire.
Author information
Authors and Affiliations
Corresponding author
Ethics declarations
Conflict of interest
The authors declare that they have no conflict of interest.
Additional information
Publisher's Note
Springer Nature remains neutral with regard to jurisdictional claims in published maps and institutional affiliations.
Electronic supplementary material
Below is the link to the electronic supplementary material.
Rights and permissions
About this article

Cite this article
Toure, H.M.A.C., Ehui, K.J.N., Abo, K. et al. Four years assessment of Cassava Bacterial Blight expression according to weather conditions in Côte d’Ivoire. SN Appl. Sci. 2, 1301 (2020). https://doi.org/10.1007/s42452-020-3135-z
Received:
Accepted:
Published:
DOI: https://doi.org/10.1007/s42452-020-3135-z