
Abstract
Kashmir Valley has witnessed a catastrophic flood in 2014, which led thousands of people homeless and devastated the agricultural lands. In the present study, the impact of 2014 flood occurred during the month of September was analysed in the vicinity of Dal lake using the pre- and post-flood periods satellite observations. The study exhibited an inundation of 42.50 km2 area (52.47% of total area) during September 2014 flood period, which is primarily topographical low-lying area (i.e. below 1530 m). The land use/land cover (LULC) analysis during pre- and post-flood periods exhibited significant impact over the built-up land with 20.4% decrease in the built-up (from 25.44 to 20.25 km2), which was mostly evident in the western, southern and eastern parts of Dal lake. It has also severely affected the road network with inundation of 220.84 kms (55.62% of total road network). The road network in the lower elevation (< 1530 m) not only disrupted but also acted as a carrier for the flood water dispersal in the region. The long-term impact and recovery of flood inundation were assessed using spatio-temporal built-up growth during 2014, 2015 and 2018 within the flooded zone through geospatial overlay analysis. The flood (September 2014) affected a total 10.42 km2 of built-up, wherein the built-up was reduced to 7.50 km2, due to the low-lying topography and nearest proximity to flow path of Jhelum river. Later, the built-up was increased to 9.60 km2 within the flooded zone during 2018 primarily in the southern parts, representing the long-term recovery after the flood aftermath. Although the impact of flood (2014) was evident in both the flooded and non-flooded zones, the built-up growth was reduced significantly in the flooded zone (− 25.18% change) as compared to non-flooded zones (− 17.32% change). Also, the long-term recovery was comparatively higher in the non-flooded zone (31.84% growth) as compared to the flooded zone (28.03% growth). The study necessitates towards implication of effective urban planning method primarily along the major lakes in order to reduce the increasing impact of catastrophic flood.
1 Introduction
The lakes in the world are facing the tremendous environmental problems due to combination of rapid urbanization and natural hazards [25, 55, 77]. The lakes contribute an important role in ecological balance as well as serve as a primary source for local economy, cultural heritage and socio-economic values. The major lakes of the world are affected by eutrophication affecting the lake ecosystem [60]. There are several lakes (Dal, Anchar, Khanpur, Manasbal, Naranbagh, Pashkuri, Tilwan, Trigam, Waskur and Wular) located in Kashmir valley (Western Himalayas) at high altitude (1510–1600 m) [84]. The structural and functional process of these aquatic ecosystem has been the major attraction for the researchers [32, 33, 35, 75, 85]. Dal lake is multi-basined-shaped lake located in Srinagar city, Kashmir valley. It is one of the major sources of irrigation and economy including floating gardens for fresh vegetables and flowers and referred as urban type lake [29]. Rapid urban growth intensified agricultural practices, disposal of municipal drainage and sewage has altered the aquatic ecosystem in the Dal lake, which results rapid increase in eutrophication and pollution in the lake [34, 35, 82].
Nevertheless, flood has emerged as important threat, affecting large area and population around the world [53]. More than 75% of natural hazard occur worldwide due to flooding with often immeasurable impact, affecting 170 million. people annually [36]. Floods are the natural disasters causing enormous damage to the mankind and environment throughout the globe [76]. Being integral part of hydrological cycle, floods occur due to heavy precipitation and / or extreme flows of rivers inundating the neighbouring floodplains or terrains [5, 26, 41]. About 82% population of world and one-third of the total landscape of earth is prone to flood [19, 54]. Though flood over the aquatic vegetation was observed to be a natural process, which rejuvenates lake ecosystem with rich sediments [1, 2, 81]. The change in climate has evident as increase in global temperature coupled with anthropogenic influence and aggravated the impact of floods [8, 46, 64, 83]. It has been reported that the flood also occurs due to manmade rampant alteration on the natural landscape, loss of wetlands and deforestation [20, 43, 56, 57]. In recent decades, the short incidence of high flood intensity has increased due to changing climatic condition [11, 44]. As the climate shapes the earth being a major force, the frequent occurrence of extreme events has increased and will continue to create devastation with greater force in the coming decades [21, 24, 30, 73]. Climate change in the mountain areas is significant, which can be observed as increasing temperature, receding glaciers, and decreasing precipitation [15].
Resilience to potential environmental disasters can be increased through proper urban land use planning [78]. In this, geoinformatics has emerged extensively been used to monitor flood inundation and preparation of management plans [39, 59, 70, 76] urban studies [18, 28, 45, 74] monitoring of flood control, drainage improvement and bank protections, etc. [16, 27, 79]. Satellite-based flood inundation mapping provides accurate information about the inundation, which can be used to estimate the inundated area [3, 10, 49] monitoring flood inundation as well as supports in quick response in mitigation [7, 39, 51, 69]. Geoinformation science also contributes to flood hazard risk zonation as well as modelling to understand the dynamics of increasing flood episodes in various physiographical regions.
In India, about one-eighth of total area in Indo-Gangetic Plains (IGP) are prone to floods [23, 50, 66], which is increasing rapidly with 0.014 million. hectare/year [40, 71]. The incidence of cataclysmic flood in the mountainous regions has been increased throughout the globe in the last few decades [37, 68].
The location of Srinagar city in the flood plains of Jhelum basin makes it the most vulnerable to flood hazards [4, 48, 67]. Further, the region has fragile ecosystem and is extremely sensitive to global climatic variability [52]. The rapid urbanization and filling of wetlands in the city vicinity have significantly altered the natural setup which leads to urban flood situation [4, 63]. The analysis of historical meteorological data exhibited excessive precipitation is the main cause of floods in this region [38, 47]. Flash floods are often occurring in the mountain basin, which provides insufficient time to warning leading to high devastation and loss of life [12].
In 2014, catastrophic flood in Kashmir valley leads to colossal loss lives of more than 100 people along with economic loss of INR 1 trillion [80]. This was the worst flood witnessed in last 50 years in the region, which highlights the inability of the drainage system to handle the heavy discharge from Jhelum River as it was flowing 1.2 m above the danger mark [3, 10, 31]. Due to the absence of any diversion for the excess water at the floodgates near Rammunshi bagh, it leads to large increase in water in Dal lake [65]. The heavy rain leads to overspill of the Jhelum river beyond its course induced the pressure in the flood plain and neighbouring low-lying areas [9]. It has affected 2.2 million. people residing in 287 villages of Kashmir valley. The long duration (~ 2 weeks) inundation in the northern and central part of Kashmir valley made the conditions worst [10]. The built-up and agricultural land along Jhelum and lake environment was affected due to 2014 flood in Srinagar [1, 2]. Being in the central part of the Srinagar city, Dal lake was overloaded due to high precipitation and overflow of excess water inundated the surrounding built-up [22]. Therefore, in the present study, the impact of 2014 flood on the Dal lake environment was analysed using spatio-temporal satellite datasets. Also, the short and long-term recovery was evaluated using temporal satellite observations to deduce comprehensive implication of 2014 flood on Dal lake environs.
2 Study area
In the present study, Dal lake and its vicinity, Kashmir Valley, Western Himalayas was considered as study area (Fig. 1). The study area lies between 34° 06′ to 34° 16′ N latitude and 74° 79′ to 74° 90′ E longitudes at an average elevation of 1586 m above mean sea level comprising 81 km2 of area. Dal lake covers ~ 20 km2 area and is located at the foot of Zabarwan mountains and surrounded by Shankaracharya hill to the east and Kohi-Maran hills on the west [84]. It was formed as the ox-bow of the River Jhelum due to progressive shrinkage of a glacial lake [14, 18]. It is lake is surrounded by the road network from three sides. The major inflow in Dal lake receives from Telbal Nallah, whereas outflow through a weir and lock system located at Dal gate. Telbal Nallah is the main source of water in the Dachigam territory. The maximum depth of Dal lake is 6.5 m and average depth is under 3 m. The permanent source of water in the lake is due to the presence of multi-springs [42]. The precipitation in the Dal lake and surroundings receives in the form of snow in winter and rain in remaining seasons. The region receives an average annual rainfall of 655 mm and the temperatures range from 1 to 11 and 12 to 30 °C during winter and summer seasons, respectively [72]. The Dal lake is properly connected from all possible directions by roadways, whereas south-western part is directly linked to the major urban centre. A number of gardens like Nishat garden, Shalimar garden, Naseem bagh park, Tulip garden, Pari Mahal, Botanical garden and different religious places like Hazratbal shrine, Shankaracharya temple, etc., found on the periphery of Dal lake. Rapid urbanization has become challenge as excessive growth of water weeds and deterioration of water quality due to discharge of large quantities of waste from human built-up including house boats, agricultural land and the ecological stress. Dal lake is affected by the dense growth of macrophytes which leads to heavy mineral loading due to cultural eutrophication. The urban centre (Srinagar) accommodates 1,236,829 persons with 53% of male and 47% of female population [13]. During the last 42 years (1972–2014), the concomitant population growth in the Srinagar city was 224% [4]. The economy of the city is basically dependent on tourism and agriculture. The work force participation rate (WFPR) of gainfully occupied persons for the Srinagar city is 26% [13].

Location map of Dal lake and its surroundings
3 Data and methodology
In the present study, the impact of flood (10 September 2014) on land use/land cover (LULC) of Dal lake and its surrounding was analysed during the pre- and post-flood periods using temporal satellite datasets (Table 1). The LULC map was prepared using LANDSAT satellite images of pre- flood (25 August 2014), during flood (10 September 2014), and post-flood (13 September 2015 and 25 October 2018) periods, which were acquired from USGS website (https://glovis.usgs.gov). The outer buffer of 2 kms was created around the Dal lake for delineating the study area. The supervised classification technique was performed on the satellite images of 25 August 2014 and 13 September 2015 using maximum likelihood classifier, in which a pixel with the maximum likelihood is classified into corresponding class [62]. The supervised classification was performed by taking number of training sets for assigning the signature editor. The quality of a supervised classification technique basically depends on the validity of the training sets [58]. Therefore, in this study, 45 training sets were selected considering all LULC classification with minimum of 20 pixels for each training set. The region was classified into six LULC class, viz., terrestrial vegetation, aquatic vegetation, agriculture, built-up, water bodies and others. The terrestrial vegetation includes evergreen forest, semi-evergreen forest, and scrub forest. The agriculture class includes cultivated areas, plantation, and fallow land. All the vegetation grown within the water bodies (hydrophytes) considered under aquatic vegetation class. The built-up class incorporates built-up area including buildings, transport, etc. The surface water bodies including lakes, ponds, river, reservoirs, etc., were categorized under waterbodies. And the remaining areas including wasteland, barren land, sandy area, rock out crops, etc., were categorized under “others” class. To map the inundation, the two classes, namely land and water classes, were generated for the satellite image of 10 September 2014. The satellite image dated 25 October 2018 was used to delineate the built-up area of 2018. The satellite image dated 10 September 2014 was used to map flood water and correlated with LULC maps. The Kappa coefficient and overall accuracy were established method for assessing the accuracy of land use classifications [61], and therefore the Kappa coefficient and overall accuracy were determined using the following formulae:
where r is the number of rows in the matrix, \({x}_{ii}\) is the number of observations in row i and column i, \({x}_{i+}\) and \({x}_{+i}\) are marginal totals for row i and column i, respectively, and n is the total number of observations (pixels).
where \({x}_{ii}\) is the diagonal elements in the error matrix, and x is the total number of samples in error matrix.
The overall accuracy was calculated for the LULC maps based on selective field checks during the month of March 2018 as well as using Google Earth images. The overall accuracy for each map (dated 25 August 2014, 10 September 2014, 13 September 2015 and 25 October 2018) was ranging between 92% to 95% with the Kappa Coefficient range of 0.6901 to 0.8814 (Table 2). The accuracy obtained for all the four raster layers is acceptable so the results obtained can be used for further calculations [6]. The wrong identified pixels were corrected and area calculation was performed. The stereo satellite image of Cartosat-1 during 24 September 2006 was acquired from NRSC (National Remote Sensing Centre) and was used to prepare digital elevation model of 10 m spatial resolution. The region was classified into various elevation zones, viz., very low (< 1530), low (1530–1550), medium (1550–1560) and high (> 1600). The flood inundation as well as DEM was spatially correlated with built-up of September 2015 and October 2018 to map the long and short-term recovery after 2014 flood. The methodology adopted in the present study is given below in the flowchart (Fig. 2).
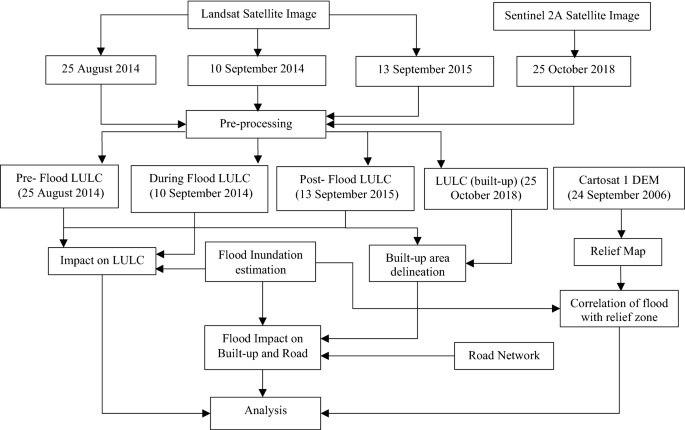
Flow chart of the methodology
4 Results and discussion
In the present study, the Kashmir flood inundation (occurred during September 2014) in and around Dal lake and its impact on varied land use/land cover were analysed. Later, the built-up growth dynamics during 2015 and 2018 within the inundated zone was evaluated to deduce the recovery in the Dal lake environment.
4.1 Flood inundation mapping
The LANDSAT OLI satellite image of 10 September 2014-based assessment of flood inundation exhibited that the ~ 42.50 km2 (52.47% of total area) area was affected due to flood inundation (Fig. 3). The inundation was primarily observed in the northern, southern, western, and south-western parts. In contrast, the area located in the eastern and south-eastern parts comprising of 38.50 km2 (47.53%) was not affected by inundation due to its geographical location at higher elevation (Table 3). The level of inundation was correlated with DEM-based relief of the region. The result indicated that the majority of the area (41.14 km2; 86% of total area) below the elevation 1530 m (47.62 km2) was inundated during 2014 flood, which is equivalent to 96% (42.50 km2) of total inundation in the Dal lake and its vicinity. This signifies that the 2014 flood was limited to the elevation of ~ 1530 m in the region.

Flood water inundation in the Dal lake and its surroundings along with the satellite image (Landsat 8 OLI) during 10 September 2014
4.2 Flood impacts on land use/land cover
The pre-flood LULC based on LANDSAT 7 ETM+ (dated 25 August 2014) exhibits that built-up (25.44 km2; 31.4%) was the dominant land use followed by agriculture (20.93 km2; 25.8%), terrestrial vegetation (12.10 km2; 14.9%) and water bodies (12.31 km2; 15.2%) (Table 4 and Fig. 4 (a.1 and a.2)). The aquatic vegetation (6.73 km2; 8.31%) and others (3.25 km2; 4%) were comprised of very less area. The post-flood LULC based on LANDSAT 8 OLI (13 September 2015) exhibited that agriculture was the dominated land use (20.82 km2) followed by built-up (20.25 km2; 25%), terrestrial vegetation (15.44 km2), aquatic vegetation (8.37 km2) and others (3.88 km2) LULC classes.

Satellite image of 25 August 2014 (a.1) and 13 September 2015 (b.1) along with its corresponding land use/land cover maps (a.2, b.2)
The pre- and post-flood LULC exhibited the significant decrease in built-up area (from 25.44 km2 to 20.25 km2) during the period, which was primarily evident in the western, southern and eastern parts of Dal lake, where the considerable proportion of built-up was reduced. In contrast, the floods impact was very less on agricultural land (0.11 km2) and waterbodies (0.29 km2). Also, the significant to minor increase in terrestrial vegetation (3.34 km2; 27.6%), aquatic vegetation (1.64 km2; 24.2%) and others (0.63 km2; 19.4%) were evident. The impact of flood on built-up area was evident as the flood water impression on the buildings primarily observed in the southern part of the Dal lake observed during the field verification (Figs. 5f, 6).

Impact assessment of flood inundation (2014) on built-up area during 2014 (a), 2015 (b) and 2018 (c), digital elevation model (d), road network (e), and built-up dynamics during 2014–2018 (f)

Flood impression on the buildings within the Srinagar city (a, b, c, e, f) and breaching of river bank due to flood (d) and corresponding locations on the Satellite image (I and II)
The impact of flood (2014) was also observed on the transportation network in the Dal lake and its vicinity. The study exhibited a total road length of 220.84 kms (55.62% of total road network) including National Highway, and streets were inundation during September 2014, which was observed primarily in the southern part of the Dal lake (Fig. 5e). The inundation leads to catastrophic situation in the region by distrusting and damaging all the transportation communication primarily the roads located at the lower elevation (< 1530 m), which also acted as a carrier for the flood water dispersal in the built-up area [4].
4.3 Assessing long-term recovery after 2014 flood
The long-term impact and recovery of flood inundation were assessed using spatio-temporal built-up growth during 2014, 2015 and 2018 within the flooded zone through geospatial overlay analysis. The flood (September 2014) has affected total 10.42 km2 of built-up, wherein the built-up was reduced to 7.50 km2, which was primarily evident in the southern and south-western parts of the Dal lake due to the low-lying topography and nearest proximity to flow path of Jhelum river (Fig. 5a). This may be attributed to the direct impact of inundation on built-up led the marooned population to shift to more safer places. Later, the built-up was increased to 9.60 km2 within the flooded zone during 2018 primarily in the southern parts, representing the long-term recovery after the flood aftermath (Tables 5, 6).
It is to note that the built-up outside the flooded zone was 15.42 km2 during the pre-flood period, which was reduced to 12.75 km2 considering the probability of flood hazard in the region. Later, the built-up outside the flooded zone was increased to 16.81 during 2018, representing the natural built-up growth in the safer locations. Although the impact of flood (2014) was evident in both the flooded and non-flooded zones, the built-up growth was reduced significantly in the flooded zone (− 25.18% change) as compared to non-flooded zones (− 17.32% change). Also, the long-term recovery was comparatively higher in the non-flooded zone (31.84% growth) as compared to the flooded zone (28.03% growth) (Table 7).
Although the nature of flood was very devastating, the high influx of population led to built-up growth in the higher flood risk zone, which were considered relatively more suitable for the growth of built-up and having irregular occurrence of such as severe flood incidences. It is to note that the flood-affected areas were the active flood plain of Jhelum river, which were encroached by rapid built-up growth.
5 Conclusion
The Kashmir flood (September 2014) has severely affected primarily the low lying regions around Dal lake. A total of 52.47% (42.50 km2) area in the Dal lake and its vicinity were inundated. The considerable and immediate impact of flood was evident on the built-up land, which was decreased by 20% (25.44–20.25 km2) during observed during pre-flood (25 August 2014) and post-flood (13 September 2015) assessment. In contrast, the area coverage of terrestrial vegetation (28% growth) and aquatic vegetation was increased (19% growth) due to flood inundation in the region. It also disrupted the major length of road network (220 kms; 55.62%) including National Highway and streets in the region. The long-term impact and recovery of flood inundation using spatio-temporal built-up growth within the flooded zone exhibited comparatively higher built-up recovery in the non-flooded zone (31.84% growth) as compared to the flooded zone (28.03% growth). The relief-based analysis indicated that the region below the elevation of 1530 m was almost completely inundated (96%; 42.50 km2) during the 2014 Kashmir flood. The population mostly residing in the higher flood-risk zone near the lake were considered relatively more suitable for built-up growth. The future built-up should be constructed away from the flood margin, preferably to the higher elevated (> 1530 m) region. As flooding is very frequent in Kashmir valley of varied intensity, therefore an adequate drainage system should be made to channelize the storm water during such flood to safeguard population from flood devastation. The temporal monitoring over the Dal lake should be performed, and measures should be taken to clean the lake environment to reduce eutrophication which will also increase the water holding capacity of lake. Numerous natural wetlands in the Kashmir valley may be rejuvenated and preserved to reduce the increasing impact of flood inundation.
References
Ahmad T, Pandey AC, Kumar A (2017) Evaluation of flood impacts vis-à-vis urban sprawl and changing climate in Srinagar city and its environs. SGVU J Clim Change Water 1(2), 38–46. ISSN: 2347–7741
Ahmad T, Pandey AC, Kumar A (2017) Impact of flooding on land use/ land cover transformation in Wular Lake and its environs Kashmir Valley, India using Geoinformatics. ISPRS Ann Photogramm Remote Sens Spatial Inf Sci. https://doi.org/10.5194/isprs-annals-1V-4-W4-13-2017
Ahmad T, Pandey AC, Kumar A (2018) Flood hazard vulnerability assessment in Kashmir Valley, India using geospatial approach. Phys Chem Earth. https://doi.org/10.1016/j.pce.2018.02.003
Ahmad T, Pandey AC, Kumar A (2019) Evaluating urban growth and its implication on flood hazard and vulnerability in Srinagar city, Kashmir Valley, using geoinformatics. Arab J Geosci 12:308. https://doi.org/10.1007/s12517-019-4458-1
Alfieri L, Bisselink B, Dottori F, Naumann G, de Roo A, Salamon P, Wyser K, Feyen L (2017) Global projections of river flood risk in a warmer world. Earth’s Future 5:171–182. https://doi.org/10.1002/2016EF000485
Anderson JR, Hardy EE, Roach JT, Witmer RE (1976) A land-use and land-cover classification system for use with remote sensor data. US Geological Survey Professional Paper 964, Washington, DC
Arca D (2012) Geographic information system and remote sensing in disaster management. Karaelmas Sci Eng J 2(2):53–61 (in Turkish)
Berz G, Kron W, Loster T, Rauch E, Schimetschek J, Schmieder J, Siebert A, Smolka A, Wirtz A (2001) World map of natural hazards—a global view of the distribution and intensity of significant exposures. Nat Hazards 23:443–465. https://doi.org/10.1023/A:1011193724026
Bhat MS, Alam A (2014) Tracking the reasons: strong monsoon currents triggering multiple cloud bursts caused the catastrophe. https://www.greaterkashmir.com/news/gk-magazine/tracking-the-reasons/179066.html
Bhatt CM, Rao GS, Farooq M, Manjusree P, Shukla A, Sharma SVSP, Kulkarni SS, Begum A, Bhanumurthy V, Diwakar PG, Dadhwal VK (2016) Satellite-based assessment of the catastrophic Jhelum floods of September 2014, Jammu & Kashmir, India. J Geomatics Nat Hazards Risks. https://doi.org/10.1080/19475705.2016.1218943
Bhutiyani MR, Kale VS, Pawar NJ (2009) Climate change and the precipitation variations in the northwestern Himalaya: 1866–2006. Int J Climatol 30(4):535–548
Borga M, Gaume E, Creutin JD, Marchi L (2008) Surveying flash floods: gauging the ungauged extremes. Hydrol Process 22(18):3883–3885. https://doi.org/10.1002/hyp.7111
Census of India (2011) Office of the Registrar General & Census Commissioner, New Delhi
De H, Paterson TT (1939) Studies on Ice-Age in India and associated human cultures. Carnegie Institute of Washington, No. 493
Dar RA, Rashid I, Romshoo SA, Marazi A (2013) Sustainability of winter tourism in a changing climate over Kashmir Himalaya. J Environ Monit Assess. https://doi.org/10.1007/s10661-013-3559-7
Dar RA, Mir SA, Romshoo SA (2019) Influence of geomorphic and anthropogenic activities on channel morphology of River Jhelum in Kashmir Valley, NW Himalayas. Quat Int. https://doi.org/10.1016/j.quaint.2018.12.014
Dianelle G (1922) Studi Sul glacial Sped. It al de Flilipi Res. Sci. 13 pp
Diksha K, Kumar A (2017) Analysing urban sprawl and land consumption patterns in major capital cities in the Himalayan region using Geoinformatics. Appl Geogr 89C:112–123
Dilley M, Chen RS, Deichmann U, Lerner-Lam AL, Arnold M, Agwe J, Buys P, Kjekstad O, Lyon B, Yetman G (2005) Natural disaster hotspots: a global risk analysis. International Bank for Reconstruction and Development/The World Bank and Columbia University, Washington, DC
Dölek I (2015) Identification of the areas susceptible to flooding and overflows in Sungu and its surrounding (Muş). Marmara Geogr Rev 31:258–280 (in Turkish)
Field CB (2012) Managing the risks of extreme events and disasters to advance climate change adaptation: special report of the intergovernmental panel on climate change. Cambridge University Press, Cambridge
Govt. of J&K and NRSC, National Remote Sensing Centre (2005) A satellite based rapid assessment on floods in Jammu & Kashmir—September, 2014. Dept. of Ecology, Environment and Remote Sensing Government of Jammu and Kashmir & NRSC, Department of Space. https://jkenvis.nic.in/pdf/jkenvis_floodreport.pdf
Gupta S, Javed A, Datt D (2003) Economics of flood protection in India. Nat Hazards 28:199–210
Gujree I, Wani I, Muslim M, Farooq M, Meraj G (2017) Evaluating the variability and trends in extreme climate events in the Kashmir Valley using PRECIS RCM simulations. Model Earth Syst Environ. https://doi.org/10.1007/s40808-017-0370-4
Guyer GT, Ilhan EG (2011) Assessment of pollution profile in Buyukcekmece Watershed, Turkey. Environ Monit Assess 173:211–220
Hallegatte S, Green C, Nicholls RJ, Corfee-Morlot J (2013) Future flood losses in major coastal cities. Nat Clim Change 3:802–806. https://doi.org/10.1038/NCLIMATE1979
Hemmelder S, Marra W, Markies H, De Jong SM (2018) Monitoring river morphology & bank erosion using UAV imagery—a case study of the river Buëch, Hautes-Alpes, France. Int J Appl Earth Obs Geoinf 73(4):428–437
Herold M, Couclelis H, Clarke KC (2005) The role of spatial metrics in the analysis and modeling of land use change. Comput Environ Urban Syst 29(4):369–399
Hutchinson GE (1973) Eutrophication. The scientic background of a contemporary practical problem. Am Sci 61:269–279
IPCC (2015) Mitigation of climate change, vol 3. Cambridge University Press, Cambridge
Kar SC, Tiwari S (2015) Model simulations of heavy precipitation in Kashmir, India, in September 2014. Nat Hazards. https://doi.org/10.1007/s11069-015-2073-3
Kaul V (1977) Limnological survey of Kashmir lakes with reference to trophic status and conservation. Int J Ecol Environ Sci 3:29–44
Kaul V, Handoo JK, Qadri BA (1977) Seasons of Kashmir. Geogr Rev India 41(2):123–130
Kaul V (1979) Water characteristics of some fresh water bodies of Kashmir. Curr Trends Life Sci 9:221–246
Khan MA (2008) (2008) Chemical environment and nutrient fluxes in a flood plain wetland ecosystem, Kashmir Himalayas, India. Indian For 134(4):505–514
Jan K (2008) Climate, poverty, and justice: What the Poznań UN climate conference needs to deliver for a fair and effective global deal. Oxfam Policy Pract Clim Change Resil 4(3):117–148
Korup O, Clague JJ (2009) Natural hazards, extreme events, and mountain topography. Quat Sci Rev 28:977–990. https://doi.org/10.1016/j.quascirev.2009.02.021
Kumar R, Singh RD, Sharma KD (2005) Water resources in India. Curr Sci 89:794–811
Kumar A, Pandey AC, Hoda N, Jeyaseelan AT (2011) Evaluating the long-term urban expansion of Ranchi Urban Agglomeration, India using geospatial technology. J Indian Soc Remote Sens 39(2):213–224
Kumar M (2013) A geographical study of floods and flood management in India. MPhil dissertation. Department of Geography, Kurukshetra University, Kurukshetra, India, pp 34–35
Kumar R, Acharya P (2016) Flood hazard and risk assessment of 2014 floods in Kashmir Valley: a space-based multi-sensor approach. Nat Hazards. https://doi.org/10.1007/s11069-016-2428-4
Kundangar MRD, Sarwar SG, Shah MA (1995) Limnological characteristics of Hazaratbal basin of Dal lake (1992–1993). Tech. Report. HRL. S.P. College, Srinagar, Kashmir
Lal P, Prakash A, Kumar A, Srivastava P, Saikia P, Pandey AC, Srivastava P, Khan ML (2020) Evaluating the 2018 extreme flood hazard event in Kerala. India Remote Sensing Letters 11(5):436–445. https://doi.org/10.1080/2150704X.2020.1730468
Landry JS, Partanen AI, Matthews HD (2017) Carbon cycle and climate effects of forcing from fire-emitted aerosols. Environ Res Lett 12:025002. https://doi.org/10.1088/1748-9326/aa51de
Lawda JK (1998, 1999, 2000) Jammu and Kashmir lakes and water ways authority, Technical Reports on Dal Lake, Srinagar
McBean G (2004) Climate change and extreme weather: a basis for action. Nat Hazards 31:177–190
Meraj G, Romshoo SA, Yousuf AR, Altaf S, Altaf F (2015) Assessing the influence of watershed characteristics on the flood vulnerability of Jhelum basin in Kashmir Himalaya: reply to comment by Shah 2015. Nat Hazards 78:1–5. https://doi.org/10.1007/s11069-015-1861-0
Meraj G, Yousuf AR, Romshoo SA (2013) Impacts of the Geo-environmental setting on the flood vulnerability at watershed scale in the Jhelum basin; M Phil dissertation, University of Kashmir, India. https://dspaces.uok.edu.in/jspui//handle/1/1362
Milan DJ (2012) Geomorphic impact and system recovery following an extreme flood in an upland stream: Thinhope Burn, northern England, UK. Geomorphology 138(1):319–328
Mohapatra PK, Singh RD (2003) Flood management in India. Nat Hazards 28:131–143
Mosammam HM, Nia JT, Khani H, Teymouri A, Kazemi M (2016) Monitoring land use change and measuring urban sprawl based on its spatial forms: the case of Qom city, Egypt. J Remote Sens Space Sci. https://doi.org/10.1016/j.ejrs.2016.08.002
Muslim M, Romshoo SA, Rather AQ (2015) Paddy crop yield estimation in Kashmir Himalayan rice bowl using remote sensing and simulation model. Environ Monit Assess 187(6):316
Munich Re (2017) TOPICS GEO. Natural catastrophes 2016. Analyses, assessments, positions Munich
National Adaptation Programme of Action (NAPA) (2011) GIS based flood hazard mapping and vulnerability assessment of people due to climate change: a case study from Kankai watershed. East Nepal, 51 pp
Oczkowski A, Nixon S (2008) Increasing nutrient concentrations and the rise and fall of a coastal fishery: a review of data from the Nile Delta. Egypt Estuar Coast Shelf Sci 77:309–319
Özcan O, Musaoğlu N, Seker DZ (2009) Assessment of inundation areas using GIS and remotely sensed data and risk management; Sakarya Basin. Turkey chamber of architects, engineers union of Map and Cadastre Engineers 12. Scientific and Technical Map of Turkey, Ankara (in Turkish)
Özşahin E, Kaymaz ÇK (2013) A sample of flood risk assessment: floods in the Amik Valley. Turk Stud 8(8):2021–2039 (in Turkish)
Palaniswami C, Upadhyay AK, Maheswarappa HP (2006) Spectral mixture analysis for subpixel classification of coconut. Curr Sci 91(12):1706–1711
Pandey AC, Singh SK, Nathawat MS (2010) Water logging and flood hazards vulnerability and risk assessment in Indo Gangetic plain. Nat Hazards 55:273–289. https://doi.org/10.1007/s11069-010-9525-6
Pandit AK (2002) Lakes in Kashmir Himalaya. In: Pandit AK (ed) Natural Resources of Western Himalayas. Valley Book House Hazratbal, Srinagar, Kashmir, pp 12–13
Peng J, Wu J, Yin H, Li Z, Chang Q, Mu T (2008) Rural land use change during 1986–2002 in Lijiang, China, based on remote sensing and GIS data. Sensors 8(12):8201–8223
Phiri D, Morgenroth J (2017) Developments in landsat land cover classification methods: a review. Remote Sens 9:967
Rashid H, Naseem G (2008) Quantification of loss in spatial extent and wetlands in the suburbs of Srinagar city during last century using geospatial approach. In: Sengupta M, Dalwani R (eds) Proceedings of Taal 2007: The 12th World Lake Conference, pp 653–658
Romshoo SA, Altaf S (2018) Geomatics applications for Himalayan Region. ISG NEWSLETTER. vol 24, No. 3 & 4; December 2018
Romshoo SA, Altaf S, Rashid I, Dar RA (2017) Climatic, geomorphic and anthropogenic drivers of the 2014 extreme flooding in the Jhelum basin of Kashmir, India, Geomatics. Nat Hazards Risk. https://doi.org/10.1080/19475705.2017.1417332
Roy PS, Bhanumurthy V, Murthy CS, Chand TK (2008) Space for disaster management: lessons and perspectives. J South Asia Disaster Stud 1:157–177
Sen D (2010) Flood Hazards in India and management strategies. In: Natural and anthropogenic. Springer, The Netherlands
Sepúlveda SA, Padilla C (2008) Rain-induced debris and mudflow triggering factors assessment in the Santiago cordilleran foothills. Cent Chile Nat Hazards 47:201–215. https://doi.org/10.1007/s11069-007-9210-6
Sevinç HK, Karaş IR (2018) The role of volunteered Geographic Information Application in disaster management. https://doi.org/10.5194/isprs-archives-XL11-3-W4-469-2018
Singh SK, Pandey AC, Nathawat MS (2011) Rainfall variability and spatio temporal dynamics of food inundation during the 2008 Kosi food in Bihar State. India Asian J Earth Sci 4:9–19
Singh O, Kumar M (2013) Flood events, fatalities and damages in India from1978 to 2006. Nat Hazards 69(3):1815–1834
Sharad JK, Agarwal PK, Singh VP (2007) Hydrology and water resources of India. Springer.
Smith MD (2011) An ecological perspective on extreme climatic events: a synthetic definition and framework to guide future research. J Ecol 99(3):656–663
Tripathy P, Kumar A (2019) Monitoring and modelling of spatio-temporal urban growth of Delhi, India using cellular automata and geoinformatics. Cities 90:52–63
Trisal CL (1985) Trophic status of Kashmir Valley lakes. Geobios Spl. Vol- I.17179. In: Mishra SD, Sen DN, Ahmed I (eds) Proc. National Symposium on Evaluation of Environment, Jodhpur, India
Tiryaki M, Karaca O (2018) Flood susceptibility mapping using GIS and multicriteria decision analysis: Saricay-Çanakkale (Turkey). Arab J Geosci 11:364. https://doi.org/10.1007/s12517-018-3675-3
UNEP (1994) The pollution of lakes and reservoirs, Environmental Library No.12, Nairobi, Kenya. pp 9–33
UN-HABITAT (2010) State of the cities 2010–11—cities for all: Bridging the urban divide. UN-Habitat, Nairobi, Kenya. Retrieved from https://www.unhabitat.org
Winsemius HC, Aerts JCJH, van Beek LPH, Bierkens MFP, Bouwman A, Jongman B, Kwadijk JCJ, Ligtvoet W, Lucas PL, van Vuuren DP (2016) Global drivers of future river flood risk. Nat Clim Change 6:381–385
World Bank (2015) Environment and social management framework, Jhelum and Tawi flood recovery project. Project management unit, J&T FRP, government of Jammu and Kashmir [Updated 2015 April 18; Cited 2016 November 8]. https://jkrevenue.nic.in/pdf/Reliefçrehab/JTFRPçDraftçESMFç18.04.2015.pdf
Yevyevich V (1992) Floods and society. Coping with Floods, NATO ASI Series, Dordrecht: YJuwer, pp 3–9
Zan F, Huo S, Xi B, Li Q, Liao H, Zhang J (2011) Phosphorus distribution in the sediments of a shallow eutrophic lake, Lake Chaohu, China. Environ Earth Sci 62:1643–1653
Zaz SN, Romshoo SA, Krishnamoorthy RT, Viswanadhapalli Y (2019) Analyses of temperature and precipitation in the Indian Jammu and Kashmir region for the 1980–2016 period: implications for remote influence and extreme events. Atmos Chem Phys 19(1):15–37. https://doi.org/10.5194/acp-19-15-2019
Zutshi DP and Khan MA (1978) On Lake typology of Kashmir. In: Environment physiology and ecology of plants, pp 465–472
Zutshi DP, Kaul V, Vass KK (1972) Limnological studies of high altitude Kashmir lakes. Verhandlungen des Internationalen Verein Limnologie 118:599–604
Acknowledgements
The authors would like to acknowledge USGS for online availability of LANDSAT satellite data and NRSC (ISRO) for providing Cartosat 1 DEM data. The authors express gratefulness to the anonymous reviewers for their valuable comments and suggestions which significantly improved the content and structure of the manuscript. The first author “Tauseef Ahmad” acknowledges the financial assistance from the UGC—India, for providing Maulana Azad National Senior Research Fellowship (F1-17.1/2016-17/MANF-2015-17-BIH-61896).
Author information
Authors and Affiliations
Corresponding author
Ethics declarations
Conflict of interest
There is no conflict of interest (financial or non-financial). The work done in this paper involves satellite images which are freely available or purchased from NRSC (ISRO) and authors informed or accepted the conditions from the different sources.
Human and animal rights
There is no human or animal participation during this study.
Additional information
Publisher's Note
Springer Nature remains neutral with regard to jurisdictional claims in published maps and institutional affiliations.
Rights and permissions
About this article

Cite this article
Ahmad, T., Pandey, A.C. & Kumar, A. Impact of 2014 Kashmir flood on land use/land cover transformation in Dal lake and its surroundings, Kashmir valley. SN Appl. Sci. 2, 681 (2020). https://doi.org/10.1007/s42452-020-2434-8
Received:
Accepted:
Published:
DOI: https://doi.org/10.1007/s42452-020-2434-8