
Abstract
Soil flushing technology is an ‘in situ’ remediation technique involving the injection of a liquid solution. Applications of the soil flushing technique depend on the leachability of the pollutants and the environmental compatibility and total volumes of the solutions used. Therefore, experiments should consider these aspects by simulating the real phenomenon and using the most suitable reagents for the leachability of the different mineralogical forms present. Thirty-one laboratory tests were carried out (in batch and becker) to the complete exhaustion of the leaching capacity according to pH measurements. The reaction kinetics were studied by producing more than 300 solution samples during which the principal heavy metal concentrations, pH and Eh were measured. Leaching solutions containing various concentrations of hydrochloric, sulphuric, nitric and acetic acids were used. Mercury was leached using potassium iodide and acetic acid (pH 2). Analytes such as arsenic, cadmium, mercury, lead, selenium and zinc proved to be leachable in the investigated soil layer. However, high removal efficiencies could be obtained using different typological solutions, concentrations and volumes. The paper discusses the applicability of the soil flushing technique for different heavy metal contents and pH conditions of the flushing solution.
1 Introduction
Soil flushing is the extraction of contaminants from the soil using water or other suitable aqueous solutions. The technique can also promote mobility and migration of metals by solubilizing the contaminants so that they can be extracted (EPA 1991).
In the environment, heavy metals are generally more persistent than organic contaminants such as pesticides or petroleum byproducts and they can become mobile in soils depending on soil pH and their speciation (Hashim et al. 2011).
Generally, in situ technologies are cheaper and safer than ex situ technologies, because excavation is not required; extracting solutions are in fact directly injected into the soil and not mixed in a separate vessel. The flushing fluid is typically water and may contain additives, such as chelating agents, to improve contaminant desorption from the soil matrix (Di Palma et al. 2005).
The current study focuses on soils at a metallurgical plant (Mann 1999; Svab et al. 2009; Navarro and Martinez 2010) that produces Pb and Zn. The stratigraphy of the experimental site consists of a surface layer that contains contaminated soils up to a depth of 4 m.
The metallurgical plant, still active, is in the industrial area of Sulcis (Sardinia, Italy) and the soil removal technique cannot be applied during its operative life (Desogus and Manca 2013).
Our study reports the results of laboratory tests in order to assess the applicability of Soil Flushing Reclamation Technology (Mulligan et al. 2001). Nevertheless, flushing technology is based on the continuous flow of the flushing solution through the contaminated porous material layer. Hence, hydraulic permeability of the polluted matrix is an important limiting factor governing the applicability of the flushing technology (Khan et al. 2004). We conducted a series of laboratory tests to account for the variability due to time of conditioning between the solution and the contaminated soil.
The research was performed in the following steps: (i) selection of the survey area and soil sample formation to be used in laboratory tests; (ii) characterisation of the selected soil sample; (iii) performing batch and Becker tests and (iv) final considerations on the applicability of soil flushing methods to the sampled soil.
2 Materials and methods
2.1 Soil sampling and analysis
The sample to be subjected to laboratory tests was chosen after investigating the top soil of the industrial plant area up to a depth of 4 m. After discarding the first 1 m of topsoil, we observed that maximum pollutants occurred between 1 to 2 m of the top soil (Fig. 1). The elements above the concentration threshold of contamination (CTC) were As, Cd, Hg, Pb, Se and Zn.

Histograms of the ratios between concentrations measured and CTC for the three investigated depths
The identified soil was characterised based on main components, mineralogical composition and other physicochemical properties.
The particle size composition of soil wt% (total and < 2 mm) is shown in Table 1. The gravel fraction (> 2 mm) was excluded from the leaching tests.
The physical characteristics and organic carbon content of the samples soil are shown in Table 2. The parameters D50, D10 and D60 represent the intercepts for 50%, 10% and 60% of the cumulative mass, respectively. The hydraulic conductivity (k) from grain size analyses was calculated using the Hazen empirical formula.
We also subjected the sampled soil to mineralogical XRD analysis (JCPDS 1985; Fig. 2) for the determination of the main components and found that it mainly contained quartz, sanidine and plagioclase.

XRD analysis of the sampled soil
Chemical analyses were performed for the determination of major (Table 3) and minor components (Table 4) and LOI. Table 4 also shows the CTC values in comparison to the values of Italian regulation for industrial sites.
2.2 Instrumentation
The solids and solution leachings were analysed using inductively coupled plasma-optical emission spectroscopy (ICP-OES) technique (ICP DV 7000 Optima, PerkinElmer). Concentrations of Hg were analysed (EPA 1994) using an atomic absorption spectrometer (flow injection automatic mercury system (F.I.M.S. 100, PerkinElmer; 0.01 μg/L detection limit).
In this study, the solution was analysed using the UNI EN 12506: 2004 method, the solids were analysed using the 6010C 2007 EPA method and the EPA regulations 1994 for the determination of Hg. Batch tests were performed in a double-jacketed batch reactor.
Becker tests were carried out in a 300 cm3 container consisting of solid rotation and leach solution using magnetic anchor for a conditioning time of 1, 3, 5 and 10 min. After a sedimentation time of 10 min, the supernatant was collected and filtered through a Whatman 42 filter paper. The pH and Eh of the solution were analysed using Orion 4 and 5 Star, respectively, followed by chemical analysis of the leaching solution. Repeated washing ended when the pH of the solution reached the initial nominal value. The required total number of washings varied between 15 and 45 due to the differences in the solute used, the pH of the solution and the conditioning time. The sample volume varied from 200 to 800 cm3. For each sample, the reference volume, pH and Eh values were recorded. For each test in the reactor, 150 g of solid was used. Becker tests were performed on 10 g of solid in a total volume (solid + solution) of 150 cm3.
2.3 Metal speciation
The sequential extraction procedure was carried out according to the BCR method (Sahuquillo et al. 2003; Nemati et al. 2011).
The results (Fig. 3) showed that Cd and Zn were the most easily leachable elements with high fraction of the exchangeable phase. Both Pb and Se exhibited a low fraction of exchangeable phase. Pb also had a higher fraction of contaminants associated with metal oxides while Se had the highest fraction of metal associated with organic matter (Fig. 3). As and, in particular, Hg appeared to be hardly leachable (indicated by relatively higher percentage of residual fraction).

Fractionation of As, Cd, Hg, Pb, Se and Zn in the contaminated soil
3 Experimental results
A total of 31 tests were carried out that included 300 specimens of solutions, each analysed for six chemical elements, pH and Eh.
3.1 Batch tests
The results of the tests carried out in the reactor are shown in Fig. 4 (sum of final extraction yield) and 5 (kinetics of the reaction). Preliminary tests with hydrochloric acid (C), sulphuric acid (S) and nitric acid (N) were carried out at a pH = 2. The solid/liquid ratio (S/L) was 1/5. Subsequently, two tests were performed with acetic acid at S/L = 1/5 (A) and S/L = 1/50 (L).

Sum of extraction yield of As, Cd, Hg, Pb, Se and Zn in the five batch tests
The histogram of Fig. 4 shows the sum of the extraction yield of the six analytes calculated that refer back to the concentrations reported in Table 4.
The values of Cd and Zn were always higher than 75%–80%; while the As and Hg concentrations measured were always < 0.5 mg/kg. The best result at a Solid/Liquid = 1/5 was that obtained using sulphuric acid. With acetic acid, significant values of Pb (both with S/L = 1/5 and S/L = 50) could be achieved. Selenium values were significant only with a S/L = 50 ratio. Maximum extraction was obtained within the first 200 min (Fig. 5; compared to that of 1200 min duration of the C–L tests). Maximum extraction yield value of Se reached after 600 min only in the case of test L.

Kinetics of the five batch-leaching tests: extraction yield versus time (min)
3.2 Becker tests
Becker tests are characterised by a short duration (1, 3, 5 and 10 min) compared with that of the reactor tests and by the high number of the washing repetitions until the final pH measured is practically equal to the initial value. The test is therefore very similar to what happens in column or in situ tests (continuous replacement of the leaching solution).
First, tests were carried out with four different leaching solutions at the same conditioning time of 5 min and pH = 2. The sum of the final extraction yield obtained is shown in Fig. 6.

Becker tests: sum of final extraction yield obtained in the preliminary tests
It was observed that the extraction yield of Cd and Zn was always higher than that of other elements. Extraction yield of Pb was higher with HCl, HNO3 and CH3COOH solutions, while it was high only with H2SO4 and CH3COOH solutions in the case of Se.
Therefore, the best extraction yield could be achieved with acetic acid and it was decided to carry out a second series of tests at a variable pH (1.6, 2.0, 2.5, 3.1 and 4.0) and using different conditioning times of 1, 3, 5 and 10 min.
A total of 20 tests were carried out by using 5 pH values at four conditioning times. The results were summarized using the final efficiencies obtained in each test (Fig. 7).

Becker test: histograms of final extraction yield for As, Cd, Hg, Pb, Se and Zn with leaching solution CH3COOH in different pH conditions and for different conditioning times
The values were distinct for analytes (As, Cd, Hg, Pb, Se and Zn), for pH (as indicated in the legend) and were sorted by decreasing times.
The data analysis shows how the analytical leachability decreases as the pH increases. Low or no leachability is obtained for:
-
Hg at pH = 1.6 (see also Fig. 8a);
Fig. 8 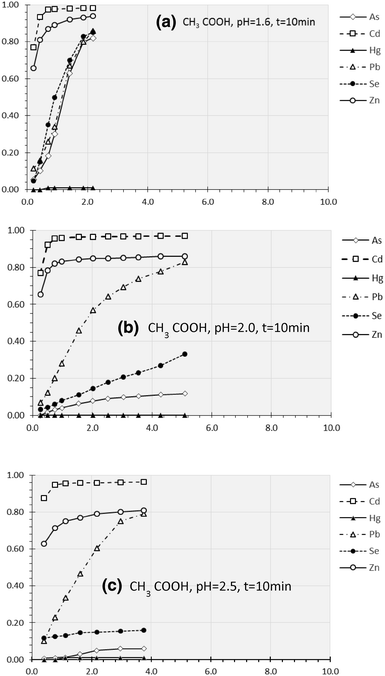
Extraction yield versus volume (liters) for t = 10 min and pH = 1.6 (a); 2.0 (b) and 2.5 (c)
-
Hg and As at pH = 2.0 (Fig. 8b);
-
Hg, As and Se at pH = 2.5 (Fig. 8c).

For pH = 3.1 and 4.0, the leachability of Pb, Zn and Cd decreased slightly but remained higher when compared to other elements (Fig. 9).

Extraction yield versus volume (L) for t = 10 min and pH = 3.1 and 4.0
Variable conditioning times between 1 and 10 min did not significantly affect the extraction yield. The kinetics showed that t = 10 min was the most representative of the extraction yield versus volumes of leaching solution used (liters).
The kinetics also showed how the increase in pH caused the reduction of leachability with the increase in time. The kinetics of Cd and Zn was always quicker and the required volume was 2 L except for pH = 4.
3.3 Mercury leachability tests
Batch and Becker tests revealed the challenges of leaching Hg, whose concentration in eluate analysis was always < 0.10 μg/L. This made it necessary to set up a new leaching procedure.
According to the literature (Abumaizar and Smith 1999; Klasson et al. 1997), potassium iodide (KI) with acetic acid at a pH = 2 have been used as a solution with a molar ratio of 0.1 for KI.
Two tests were performed, with both CH3COOH and KI. First (Fig. 10), the use of the two reagents was at the same time, with a unique solution. In the second test (Fig. 11), only CH3COOH was used for the first seven washings, after which the KI solution was added and the next nine washings were performed.

Leachability of Hg: extraction yield versus volume (L), first test

Leachability of Hg: extraction yield versus volumes (L), second test
The results of the first test showed good water-leachability of Cd, Zn and, in particular, Hg; but, a reduced water solubility of As and Se and especially of Pb. On the contrary, the use of KI after the first seven washings significantly reduced this inhibitory effect.
4 Summary of results
Becker tests with repeated washings and different conditioning times are best suited to simulating real processes. These tests are easily repeatable under different conditions of the solution, pH and contact time. They represent the exact process of soil washing and simulates the continuous replacement of the leaching solution most effectively that occurs in soil flushing.
Sequential extraction showed good leachability of Zn, Cd (all extractable > 70%); and poor leachability for As and Hg.
Reactor tests (with hydrochloric, sulphuric, nitric and acetic acids) highlight good solubility of Cd and Zn, poor solubility of As and Hg, and good leachability of Se and Pb only with a particularly low S/L ratio (1/50).
Becker tests (with repeated washings and CH3COOH in the 4–1.6 pH range) always confirmed a good solubility of Cd and Zn. Good leachability of Pb at pH ≤ 2.5 and a pH of 1.6 in the case of Se and As was observed. The nonleachability of Hg with CH3COOH, HCl, H2SO4 and HNO3 in the range of pH was also considered.
Becker tests (with repeated washings) using KI and CH3COOH and pH = 2 showed excellent Hg leachability and interesting results for other analytes. The presence of KI favors leachability, as well as Hg, As and Se. Instead, it inhibits the leachability of Pb and Cd.
The optimal result is obtained by using KI after leaching Cd, Zn and Pb with only CH3COOH.
5 Conclusions
We found that the six heavy metals viz. As, Cd, Hg, Pb, Se and Zn, in the investigated soil layer (between 1 and 4 m) were all leachable but with different solutions, at different molar concentrations (or pH) and with different volumes of leaching solution.
By using acetic acid solution, it was possible to obtain:
(1) Extraction of Cd and Zn with good results even under pH = 4;
(2) Good leachability of Pb at pH ≤ 2.5;
(3) Good leachability of Se and As at pH = 1.6.
However, leaching of Hg could not be achieved using acetic acid pH solutions in the range 4.0–1.6.
The use of potassium iodide solutions and CH3COOH at pH = 2.0 resulted in:
-
(1)
Almost complete Hg leachability.
-
(2)
Good leachability for As, Cd, Se and Zn, with the exception of Pb.
-
(3)
We showed that the optimal solution for leaching all the analytes present is the sequential use of two solutions (CH3COOH and KI).
The application of washing processes that stop at reaching the remediation objectives and does not reach the maximum extraction yield obtainable can significantly reduce the volume of solution required.
References
Abumaizar RJ, Smith EH (1999) Heavy metal contaminants removal by soil washing. J Hazard Mater B70:71–86
Desogus P, Manca PP, Orrù G (2013) Heavy metal leaching of contaminated soils from a metallurgical plant. Int J Min Reclam Environ 27(3):202–214
Di Palma L, Ferrantelli P, Medici F (2005) Heavy metals extraction from contaminated soil: recovery of the flushing solution. J Environ Manage 77(3):205–211
EPA (1991) In situ soil flushing, engineering bulletin 1991, EPA/540/2-91/021
EPA (1994) Method 245.1: determination of mercury in water by cold vapor atomic absorption spectrometry (CVAA)
Hashim MA, Mukhopadhyay S, Sahu JN, Sengupta B (2011) Remediation technologies for heavy metal contaminated groundwater. J Environ Manage 92(10):2355–2388
JCPDS 1985. International centre for diffraction data, powder diffraction file, Inorganic Phases; Printed in USA
Khan FI, Husain T, Hejazi R (2004) An overview and analysis of site remediation technologies. J Environ Manage 71:95–122
Klasson KT, Koran LJ Jr, Gates DD, Cameron PA (1997) Removal of mercury from solids using the potassium iodide/iodine leaching process. https://doi.org/10.2172/656449
Mann JM (1999) Full-scale and pilot-scale soil washing. J Hazard Mater 66:119–136
Mulligan CN, Yong RN, Gibbs BF (2001) Remediation technologies for metal contaminated soils and groundwater: an evaluation. Eng Geol 60:193–207
Navarro A, Martinez F (2010) The use of soil flushing to remediate metal contamination in a smelting slag dumping area: column and pilot-scale experiments. Eng Geol 115:16–27
Nemati K, Abu-Bakar NK, Abas MR, Sobhanzadeh E (2011) Speciation of heavy metals by modified BCR sequential extraction procedure in different depths of sediments from Sungai Buloh, Selangor, Malaysia. J Hazard Mater 192:402–410
Sahuquillo A, Rigol A, Rauret G (2003) Overview of the use of leaching/extraction tests for risk assessment of trace metals in contaminated soils and sediments. Trend Anal Chem 22:152–159
Svab M, Kubal M, Müllerova M, Raschman R (2009) Soil flushing by surfactant solution: pilot-scale demonstration of complete technology. J Hazard Mater 163:410–417
UNI EN 12506:2004 Caratterizzazione dei rifiuti—Analisi degli eluati—Determinazione di pH, As, Ba, Cd, Cl, Co, Cr, Cr(VI), Cu, Mo, Ni, NO2, Pb, S totale, SO4 2−, V e Zn
U.S. Environmental Protection Agency (1999) Superfund innovative technology evaluation program—technology profiles, 10th edn. EPA-540-R-99-500a
Funding
Funding was provided by Università di Cagliari.
Author information
Authors and Affiliations
Corresponding author
Rights and permissions
Open Access This article is distributed under the terms of the Creative Commons Attribution 4.0 International License (http://creativecommons.org/licenses/by/4.0/), which permits unrestricted use, distribution, and reproduction in any medium, provided you give appropriate credit to the original author(s) and the source, provide a link to the Creative Commons license, and indicate if changes were made.
About this article

Cite this article
Manca, P.P., Caredda, P. & Orrù, G. The applicability of soil flushing technology in a metallurgical plant. Int J Coal Sci Technol 5, 70–77 (2018). https://doi.org/10.1007/s40789-018-0190-9
Received:
Revised:
Accepted:
Published:
Issue Date:
DOI: https://doi.org/10.1007/s40789-018-0190-9