
Abstract
Anticoagulation clinics (ACCs) are specialty clinics that manage patients with blood clotting problems. Since labor costs usually account for a substantial portion of a healthcare organization’s budget, optimizing the number and types of staff required was often the focus, especially for ACCs, where labor-intensive staff-patient interactions occur. A significant portion of tasks performed by clinical pharmacists might be completed by clinical pharmacist technicians, which are less-expensive resources. While nurse staffing models for a hospital inpatient unit are well established, these models are not readily applicable to staffing ACCs. Therefore, the objective of this paper is to develop a framework for determining the right staff mix of clinical pharmacists and clinical pharmacy technicians that increases the efficiency of care delivery process and improves the productivity of ACC staff. A framework is developed and applied to build a semi-automated full-time equivalent (FTE) calculator and compare various staffing scenarios using a simulation model. The FTE calculator provides the right staff mix for a given staff utilization target. Data collected from the ACCs at VA Boston Healthcare System is used to illustrate the FTE calculator and the simulation model. The result of the simulation model can be used by ACC managers to easily determine the number of FTEs of clinical pharmacists and clinical pharmacy technicians required to reach the target utilization and the corresponding staffing cost.
Introduction
Warfarin is the most widely used anticoagulant mainly because it is proven to be very effective if used within a narrow therapeutic window as indicated by the international normalized ratio (INR). However, because of its interaction with other medications and foods, its clinical and practical use has been challenged (Garwood et al. 2008). Warfarin therapy is also challenging because the doses of Warfarin given to patients vary significantly from person to person based on individual metabolism factors (Ansell et al. 2004). Moreover, there is no good way to predict the dose a patient needs. Several successive blood tests need to be completed to make sure that the patient takes the right amount. Indeed, Warfarin monitoring is a very labor-intensive process where pharmacists or pharmacist technicians spend a significant amount of time monitoring their patients.
Staff working in anticoagulation clinics (ACCs) must manage various tasks: face-to-face (F2F) consultation with new patients, managing F2F and over the phone patient follow-ups, and other clinical and administrative tasks. Majority of ACCs in the VA Boston Healthcare System are currently staffed with clinical pharmacists (CPs). In the current practice, CPs are the only personnel performing the tasks in the majority of the ACCs. Having only CPs in such clinics will force CPs to perform many tasks for which they are overqualified (Hysong et al. 2007). Recent practices suggest that clinical pharmacy technicians (CPTs) could complete some clinic tasks that do not require knowledge or skills of CPs (Desselle and Holmes (2017). This is important for several reasons. First, it was reported that hospital pharmacist achieve more job satisfaction when working to the top of their licensure (Ferguson et al. 2011; Cox and Fitzpatrick 1999; Liu and White 2011). Second, adequate staffing of ACCs with pharmacists and pharmacy technicians is identified as one the characteristics of high-performing ACCs (Rose et al. 2012). Third, ACCs operated by only CPs are much more expensive when compared to clinics which have both CPs and CPTs. Furthermore, studies have also reported that multitasking and interruption of clinicians by clerical and administrative tasks led to reduced performance and increased error rates (Bailey and Konstan 2006; Laxmisan et al. 2007; Westbrook et al. 2010). In light of these findings, it is imperative for ACCs to have the right mix of CPs and CPTs with appropriate work assignments. However, in the current practice, there is no systematic approach to determine the right staff mix for ACCs.
The objective of this paper is to propose a framework to determine the right staff mix that increases the efficiency of care delivery at ACCs and improves the productivity of ACC staff. First, a conceptual framework for determining the required staff mix is developed. As part of the developed framework, functional job analysis (FJA) is applied to classify ACC care services into various categories of tasks. The task classification is used to determine the appropriate task assignment among CPs and CPTs. A time study is conducted to determine the standard time of each task at ACCs. Finally, the results of the FJA and time-study are used to develop a simulation model, in which several staffing scenarios are compared based on the staffing cost and staff utilization as performance measures.
The remainder of the paper is organized as follows: “Literature review” Section provides a literature review. In “Methodology” section, the detailed methodology is presented. The fourth section provides the results and discussion. Finally, conclusions and future work are presented in fifth section.
Literature review
The advent of ACCs has improved the way that Warfarin and other anticoagulation drugs are managed and monitored. When compared to the routine medical care, Warfarin therapy managed by ACCs has shown improvements in quality of anticoagulation control and cost. Recent studies related to anticoagulation therapy have mainly focused on the implementations of pharmacist-managed anticoagulation clinics (Norton and Gibson 1996; Wellman et al. 2011; Singh et al. 2015). However, studies related to process improvements and staffing modeling for ACCs are limited. Studies conducted in relation to ACCs and staff mix are reviewed.
A number of studies have been conducted in the Veterans Affairs anticoagulation clinics around the New England area. The studies mainly focus on the effect of other diseases on the quality of anticoagulation control, comparison of different patient groups (e.g., based on race) on the INR and therapeutic time in range (TTR), predictors of anticoagulation control, and the comparison of performance among ACCs. In particular, Razouki et al. (2014a, b) examine the prediction of adverse events by using the variability of INR and TTR. They conclude that the variability in INR, independent of TTR, can be used to predict Warfarin adverse effects. Rose et al. (2011) examine the relationship between anticoagulation control and follow-up intervals after obtaining an in-range INR. Although shorter intervals are generally associated with better anticoagulation control, some long intervals such as 28 days after obtaining the first or second in-range value and a longer interval after obtaining the third in-value range may be considered as appropriate. Therefore, frequent monitoring of patients in terms of INR is necessary. Efird et al. (2014) focus on identifying which patients with liver disease might safely receive Warfarin. They show that patients with liver disease have lower TTR and more hemorrhages. Rao et al. (2014) discuss racial disparity in the anticoagulation control. They report that the mean unadjusted TTR for black patients is 6.5% lower than that for white patients. However, the process of care measures has minimal additional effect on the racial disparity. Therefore, anticoagulation treatments need to be individualized, which calls for the consistent interactions between patients and their care providers.
A number of other studies have focused on identifying the predictors associated with anticoagulation control. Razouki et al. (2014a b) investigate the predictors that lead to poor anticoagulation control. They find that alcohol abuse, taking more than 16 medications, and having four or more hospitalizations during the study were among the predictors associated with poor control. Rose et al. (2011) identify patient-level predictors of oral anticoagulation control in the outpatient setting. They identify hospitalizations, medications, alcohol abuse, cancer, bipolar disorder, female sex, dementia, non-alcohol substance abuse, and chronic liver disease as significant predictors of anticoagulation control. The study by Rose et al. (2012) compares the organization and management of top-performing ACCs with those of bottom-performing ones. The result of their study identifies six factors, including adequacy of staffing (pharmacist) and effective use of (non-pharmacist) support personnel, as the characteristics of the top-performing ACCs.
FJA is a standard method that analyzes tasks for a particular job (Best et al. 2007). In FJA, tasks are considered as building blocks of human resource management (Moore 1999). In this method, each task is described by a statement which specifies the worker performing the task, actions performed, the tools and instructions used, and the accomplished goal (Best et al. 2007). FJA was applied in the Veterans Health Administration (VHA) primary care centers in the United States to examine the task assignment overlaps among different occupational groups and identify opportunities for delivery system redesign (Hysong et al. 2007). The study reported 60–96% task overlaps among the different occupational groups working at VHA primary care centers.
Time studies are mainly applied to determine the standard times and right staff mix. Several studies focus on determining the standard times for nursing activities and the best nursing ratios (Kuhn et al. 2016, Roddy et al. 1987; Myny et al. 2010). Kuhn et al. (2016) applied time study and a modified Delphi approach to determine the proportion of ACC tasks that can potentially be assigned to pharmacy technicians. In Roddy et al. (1987), work sampling and time studies are conducted to determine the amount of staff time at nursing homes required to perform specific functions for patients, such as assistance in bathing, and to determine the overall resource requirement of specific patient types. In Myny et al. (2010), time studies and observations at 48 wards in the Belgian acute hospital setting are performed to generate the standard times for nursing activities and to discover the proportion of nursing time (out of the total shift time) covered by nursing activities. Due to the differences between nursing activities and tasks performed at ACCs, the staffing models developed for nursing are not readily applicable to ACCs.
Methodology
Determination of right staff mix is a multi-stage process. A comprehensive framework is developed to be used as a guideline for determining staff mix as in Fig. 1. The framework combines FJA, time study, and simulation as the main approaches to identify the right staff mix. FJA is applied to categorize ACC care services into various categories of tasks and to determine the appropriate task assignment among the CPs and CPTs. The result of the time study is used to determine the standard time required to complete each task. The results of the FJA and time study are used as inputs to develop an Excel Visual Basic for Applications (VBA)-based tool staff mix calculator. The results of the FJA and time study are also used as inputs to compare different staffing scenarios using a simulation model, implemented in Simio simulation software, Version 7. The OptQuest tool in Simio is used to generate and compare various staffing scenarios using staffing cost and staff utilization as performance measures.

Research framework for developing staffing models
Data collection
A case study was conducted within the VA Boston Healthcare System. ACCs at five different locations (i.e., West Roxbury, Brocton, Manchester, Providence, and Causeway) were visited and observed for 15 days, between February 20, 2015 and June 12, 2015. The details are provided in “Appendix”. During the clinic observations, the face-to-face (F2F) and telephone-based clinical care processes of more than 440 patients of different categories (i.e., new patients, follow-up patients, etc.) were observed and time studied. The details of the collected data are provided in Table 1. Besides, the interactions among the ACCs staff and communications with providers, nurses, and others staff outside ACCs were observed. Other input data to the Excel VBA model such as volume of patients, salary rate of CPs and CPTs, vacation and holiday allowances, and others were retrieved from the databases of VA Boston Healthcare System.
Determination of full-time equivalents
Once the standard times are estimated and the proportion of workload for the CPs and CPTs is determined, the next important step is to estimate the base FTEs of each staff category required to serve an ACC with a given annual volume of patients. The FTE calculation is following the step-by-step procedure introduced in Ozcan (2005) and shown in Table 2. According to this method, annual volume of patient visits, the proportion of each task, and the standard time for each task are used to determine the total direct hours per year which represents the total the staffs spend giving services to the patients. On top of the direct hours, it is assumed that each ACC staff spends 20% additional indirect hours. The indirect hours represent the time that ACC staff spends performing indirect tasks such as meetings, housekeeping, private time, additional communication with patients and their families, etc. The standard time determined from the time study is used to determine the direct hours. Finally, vacation, holiday, and sick leave allowances are added to the direct and indirect hours to determine the required FTEs.
Results and discussion
Applying FJA, ACCs job are classified as clinical, administrative, and staff-to-staff communications as shown in Fig. 2. Each task category is further divided into a list of tasks that can be assigned to either CPs or CPTs. For instance, the clinical tasks are further classified into incoming calls, outgoing calls, F2F meeting, and other clinical tasks such as calculating patient dose. The tasks are then prepared as task statements following the FJA methodology (Best et al. 2007; Moore 1999).

ACC task breakdown
The appropriate assignment of each task to either the CPs or CPTs is determined in two ways. First, from the clinic visits and observations, the tasks that are currently being performed by CPTs are deemed as appropriate for CPTs to perform them. Second, for those tasks whose appropriate assignments are not clear, the results of a meeting with subject-matter experts which is reported in Kuhn et al. (2016) were used. In the meeting, ACC coordinators from eight ACC sites were asked to rate whether it is appropriate for a given task to be performed by a CPT or not. They identified that CPTs can perform ACC tasks such as triaging incoming calls, providing in-range patient advices (both F2F and telephone) with the support of CPs, call no-show patients, order labs, and do other administrative tasks.
The CPTs were classified based on their experience and training levels into regular CPTs and advanced practice CPTs (AP-CPTs). Regular CPTs are recent graduates with no experience in the ACC delivery care processes. On the other hand, AP-CPTs have experience and extra training in the ACC services. Based on this distinction, if a regular CPT is employed to work with the CP, the appropriate workload assignment is to assign 31% of the ACC workload to the CPT and the remaining 69% to the CP, as shown in Fig. 3a. On the other hand, an AP-CPT can perform around 59% of ACCs workload, as shown in Fig. 3b.

Workload assignment among ACC staff a a CP working with a CPT and b a CP working with an AP-CPT
Determination of standard times
The standard time for each of the major tasks identified by the FJA is determined by following the steps presented in Ozcan (2005), which provides a method to estimate standard times, namely: determining the observed times, normal times, and standard times, respectively. The observed time is defined as the average of the recorded times obtained from the time study. The normal time is defined as the amount of time it takes an average or “normal” worker to perform the job without interruption or delay. It is obtained by multiplying the observed time and the performance rating (PR) of the observed worker. PR would be greater than 1 if the observed worker is a faster-than-average worker, and vice versa. Finally, the standard time is obtained by multiplying the normal time by an allowance factor (AF). AF accounts for the natural inefficiencies or variations in the performance of the worker. The summary of the standard time determination is provided in Table 3. After discussion with subject-matter experts, the values of PR and AF are set to 1.3 and 1.2, respectively.
Semi-automated FTE calculator
A semi-automated FTE calculator (shown in Fig. 4) is developed to facilitate the FTE determination. In this tool, users can enter the annual number of scheduled patient visits, the different task categories and their proportions, and other parameters such as the target staff utilization level of the clinic and the holidays and leave allowances.

Semi-automated FTE calculator
The output of the semi-automated FTE calculator is the right FTEs for each type of staff that would be hired to operate an ACC. In Fig. 4, three types of outputs are shown based on the types of staff mix hired. For instance, a clinic with 17,933 annual patient visits would need around 4.33 CP FTEs and 2.62 AP-CPT FTEs.
Simulation model
The FTEs determined by the step-by-step procedure are used for developing a baseline staff mix model. Then, various staff mix scenarios were compared using a simulation model. The simulation model is built using Simio simulation software, Version 7. In building the simulation model, three types of task flow cases were considered.
-
1.
With no task transfer The tasks that are originally assigned to CPTs cannot be transferred to CPs. This task flow is represented by Fig. 5.
Fig. 5 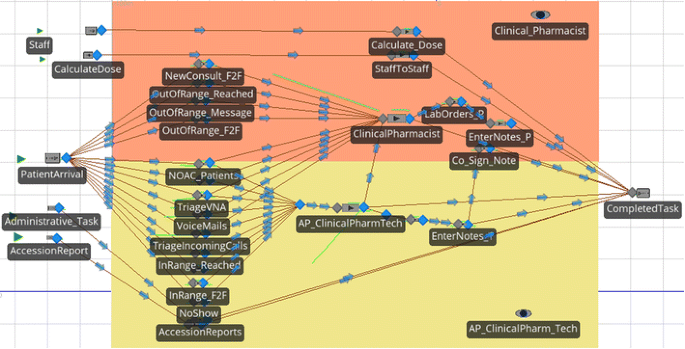
Model with no task transfer
-
2.
With task transfer The tasks that are originally assigned to CPTs can be transferred to CPs when all the CPTs are busy. This task flow is designed to make maximum use of the time of the CPs. This is shown in Fig. 6. In this task flow, two types of queuing systems are considered:
Fig. 6 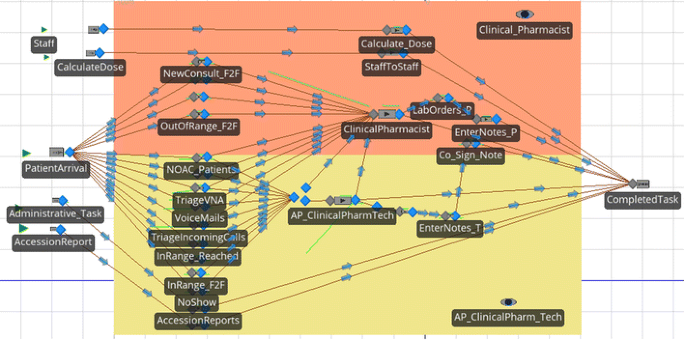
Model with task transfer
-
(a)
Threshold-based transfer Tasks are transferred to CPs when the number of a tasks waiting in a queue for the CPTs exceeds a threshold.
-
(b)
Common-waiting queue Tasks wait in a single queue and will be handled by whichever staff is available first.


System description and assumptions
It is assumed that the simulated clinic is opened at 8:00 am and closed at 4:30 pm with the ACC staff taking a one-hour break. Hence, the system is modeled as a terminating simulation where the systems start and end when the clinic is opened and closed, respectively. The sequential procedure presented in Kelton and Law (2007) was applied to determine the number of replications for the simulation model. The number of replications is determined in such a way that the average utilization levels for the CPs and CPTs have 95% confidence intervals. For α = 0.05 and r = 0.05, the number of replications was selected when the relative error reaches r/(1 + r) = 0.0476 as summarized in Table 4. For the analysis, 20 replications were used and the simulation was run for 20 weeks.
Input data modeling
The input parameters for the simulation model include task times and annual patient volume. One of the important steps in developing and analyzing a simulation model is to use appropriate distributions for the input parameters. ExpertFit software, version 7.0 is used to choose the best fitted task-time distribution for each task. The summary of the fitted distributions for each task are and the result of Goodness of Fit Test given in Table 5. A 1-year patient volume data (from July, 2014 to June, 2015) was pulled from databases of VA Boston Healthcare System. For those tasks whose sample size is small, a triangular distribution is used.
Majority of the patient visits occur in the morning. The arrival rate of patients is assumed to vary by hour of the day with more patient arrivals in the morning as shown in Table 6.
Model verification and validation
The model is verified and validated for accuracy following the methods presented in Sargent (2005). To verify the correctness of the simulation logic, model animation is used to count the flow of tasks at the different components of the simulation model as the tasks are routed through the system, and compare them with expected values. The simulation logic is compared against the process map of the ACC care delivery processes. In addition, the task assignments used in developing the FTE calculator are also compared with the task assignments used in the simulation logic.
The simulation model is validated by the subject-matter experts for its representation of the actual staffing mixes of the anticoagulation clinics. The result of the simulation model for a given ACC (represented by a given patient population and staffing mix) was compared and approved by the pharmacists. In addition, the result of the simulation was compared with the FTEs calculated from VBA tool. Table 7 shows a comparison of the result of the simulation model and the FTEs calculated using the VBA tool. For example, based on the VBA tool, a clinic with annual patient visit volume of 10,000 patients and 80% staff utilization target would require 2.44 CPs and 2.61 AP-CPTs. Based on the simulation model, the clinic’s utilization target is met with 2.5 CPs and 2.3 AP-CPTs.
Simulation study results
The objective of the simulation study is to compare different staff mix scenarios and evaluate them against the performance measures. As stated in the objective, the goal of the staffing model is to determine the right staff mix that is cost effective, productive, and improves quality of care. Staffing cost and staff utilization levels are used as performance measures to compare the different staff mix scenarios. Considering staffing cost is important because staffing cost directly affects financial performance and sustainability. The staff utilization level also affects the quality of care. As reported in Rose et al. (2012), adequate staff and staff support improves the performance of ACCs.
The OptQuest tool in Simio in which the users specifies the objective function(s), the search space defined by the independent input parameters. The tool generates various scenarios using the input parameters and computes the objective function(s) for the given inputs, from the user chooses the best scenario(s). The results of the simulation study are shown in Figs. 7 and 8. Utilization levels of an ACC for the various numbers of CP and CPT FTEs, respectively, were presented. The three types of task flow scenarios were also compared. While the utilization levels decrease with the increase of the number of FTEs, the staffing cost increases with the increase of FTEs.

Utilization levels and costs of pharmacist FTEs

Utilization levels and costs of pharmacy technician FTEs
Figure 7 provides the utilization levels and staffing cost and CP and AP-CPT when the staffing levels are varied. Comparing the task flow scenario, the “no transfer” task flow resulted in lower pharmacist utilization levels as compared to the scenarios where CPT tasks are transferred to the CPs. When task transfer is allowed, the scenario with a “common waiting queue” resulted in higher utilization level of CPs, which implies more CPT tasks are completed by CPs.
Figure 8 provides the utilization levels and staffing costs of CPTs. The utilization levels of CPTs are higher when CPT tasks are not transferred to CPs. When a common queue task flow system is used, more tasks are transferred to CPs. This lowered the utilization levels of CPTs.
Effects of changes in system parameters on staff utilization levels
It is important to analyze the effects of changes in system parameters on the performance of ACCs. Here, the effect of changes in the volume of patients visiting an ACC and task transfer policies on the utilization levels of CPs and CPTs.
Figures 9 and 10 depict the effects of the changes in patient volume on the utilization levels of CPs and CPTs, respectively. The task flow with common waiting queue is used to illustrate the effect of these changes. The annual volume of patients visiting an ACC is decreased by 10% and increased by 10 and 20%. Figure 9 provides CP utilization levels when the patient volume is varied. The figure shows that while a decrease in the volume of patient visits would lower CP utilization level, an increase in the volume of patient arrivals would also increase CP utilization level.

The effect of change in task patient volume on CP utilization level

The effect of change in task patient volume on CPT utilization level
Figure 10 shows the effect of changes in volume of patient arrivals on CPT utilization level. The figure shows that while a decrease in the volume of patient visits would lower CPT utilization level, an increase in the volume of patient arrivals would also increase CPT utilization level. However, compared to that of CP’s, the effect of change in patient volume on CPT utilization level is not that significant.
One important decision with respect to transferring CPTs’ tasks to be performed by CPs is to decide when to trigger the task transfer. The value of the threshold value represents the number of tasks waiting for a CPT before starting to transfer tasks to be completed by CPs. Figure 11 and 12 provide that changes in the threshold value for task transfer on the utilization levels of CPs and CPTs. In this illustration, the threshold value is set to 5, 10, and 20 tasks. The figures shows that an increase in the task transfer threshold value would increase the utilization level of CPTs and lower the utilization level of CPTs.

The effect of change of task transfer threshold on CP utilization level

The effect of change of task transfer threshold on CPT utilization level
Conclusions and future work
Having the right mix of staff is crucial to effectively and efficiently provide quality services. This is especially true for ACCs where patient–staff interactions are frequent and the time spent in consulting patients has a direct effect of the outcome of anticoagulation therapy. The objective of this paper is to determine the required staff mix that improves the productivity of ACC staff and increases the efficiency of delivery care. This paper developed a framework for developing staffing models and applied the framework to develop a semi-automated FTE calculator and compare various staffing scenarios with simulation modeling.
When an ACC manager tries to balance between hiring adequate level of staff and minimizing the staffing cost, it is useful to understand the utilization levels for various numbers of FTEs and the corresponding staffing cost. From the simulation outputs, one could set a given staff utilization target and easily determine the number of FTEs required to reach the target utilization and the corresponding staffing cost.
Moreover, since task assignment and the flow of tasks through the ACC process affect the staff utilization levels, understanding how tasks are assigned and routed is crucial. For instance, if the goal is to make maximum utilization of CPs, the common queue task flow system achieves this objective.
The staffing model developed in this paper is based on the observation of ACCs in VA Boston Healthcare System. Due to the fact that standard care delivery processes of ACCs are not fully developed, there are variations of the processes by which anticoagulation therapy is developed from clinic to clinic and from region to region. For future work, one could apply the framework developed in this paper in a different setting to assess whether the semi-automated FTE calculator can be used by ACC in various settings.
References
Ansell J, Hirsh J, Poller L et al (2004) The pharmacology and management of the Vitamin K antagonists: the seventh ACCP conference on antithrombotic and thrombolytic therapy. Chest 126(3):204–233
Bailey BP, Konstan JA (2006) On the need for attention-aware systems: measuring effects of interruption on task performance, error rate, and affective state. Comput Hum Behav 22(4):685–708
Best RG, Hysong SJ, Moore FI (2007) Task overlap among primary care team members: an opportunity for system redesign? J Healthc Manag 51(5):295–307
Cox ER, Fitzpatrick V (1999) Pharmacists’ job satisfaction and perceived utilization of skills. Am J Health Syst Pharm 56(17):1733–1737
Desselle SP, Holmes ER (2017) Results of the 2015 national certified pharmacy technician workforce survey. Am J Health Syst Pharm 74(17):1303–1304
Efird LM, Mishkin DS, Berlowitz DR et al (2014) Stratifying the risks of oral anticoagulation in patients with liver disease. Circ Cardiovasc Qual Outcomes 7(3):461–467
Ferguson J, Ashcroft D, Hassell K (2011) Qualitative insights into job satisfaction and dissatisfaction with management among community and hospital pharmacists. Res Social Adm Pharm. 7(3):306–316
Garwood CL, Dumo P, Baringhaus SN, Laban KM (2008) Quality of anticoagulation care in patients discharged from a pharmacist-managed anticoagulation clinic after stabilization of warfarin therapy. Pharmacotherapy 28(1):20–26
Hysong SJ, Best RG, Moore FI (2007) Are we under-utilizing the talents of primary care personnel? A job analytic examination. Implement Sci 2(1):10
Kelton WD, Law AM (2007) Simulation modeling and analysis. McGraw Hill, Boston
Kuhn H, Park A, Kim B, Lukesh W, Rose A (2016) Proportion of work appropriate for pharmacy technicians in anticoagulation clinics. Am J Health-Syst Pharm 73(5):322–327
Laxmisan A, Hakimzada F, Sayan OR et al (2007) The multitasking clinician: decision-making and cognitive demand during and after team handoffs in emergency care. Int J Med Inf 76(11):801–811
Liu CS, White L (2011) Key determinants of hospital pharmacy staff’s job satisfaction. Res Social Adm Pharm 7(1):51–63
Moore RI (1999) Functional job analysis: guidelines for task analysis and job design. Prepared for the World Health Organization. http://www.who.int/hrh/tools/job_anaiysis.pdf. Accessed 16 May 2015
Myny D, Van Goubergen D, Limère V et al (2010) Determination of standard times of nursing activities based on a nursing minimum dataset. J Adv Nur 66(1):92–102
Norton JL, Gibson DL (1996) Establishing an outpatient anticoagulation clinic in a community hospital. Am J Health-Syst Pharm 53(10):1151–1157
Ozcan YA (2005) Quantitative methods in health care management: techniques and applications, vol 4. Wiley, San Francisco
Rao SR, Reisman JI, Kressin NR et al (2014) Explaining racial disparities in anticoagulation control results from a study of patients at the Veterans Administration. Am J Med Qual 30:214–222
Razouki Z, Ozonoff A, Zhao S, Jasuja GK, Rose AJ (2014a) Improving quality measurement for anticoagulation adding international normalized ratio variability to percent time in therapeutic range. Circ Cardiovasc Qual Outcomes 7(5):664–669
Razouki Z, Ozonoff A, Zhao S, Rose AJ (2014b) Pathways to poor anticoagulation control. J Thromb Haemost 12(5):628–634
Roddy PC, Liu K, Meiners MR (1987) Resource requirements of nursing home patients based on time and motion studies. US Department of Health and Human Services Publication No. 87-3708
Rose AJ, Ozonoff A, Berlowitz DR et al (2011) Reexamining the recommended follow-up interval after obtaining an in-range international normalized ratio value follow-up interval for patients with good control results from the Veterans Affairs study to improve anticoagulation. Chest 140(2):359–365
Rose AJ, Petrakis BA, Callahan P et al (2012) Organizational characteristics of high-and low-performing anticoagulation clinics in the Veterans Health Administration. Health Serv Res 47(4):1541–1560
Sargent RG (2005) Verification and validation of simulation models. In Proceedings of the 37th conference on winter simulation conference, Orlando, FL, 4–5 December 2005
Singh LG, Accursi M, Black KK (2015) Implementation and outcomes of a pharmacist-managed clinical video telehealth anticoagulation clinic. Am J Health-Syst Pharm 72(1):70–73
Wellman JC, Kraus PS, Burton BL et al (2011) Development and implementation of a pharmacist-managed inpatient anticoagulation monitoring program. Am J Health-Syst Pharm 68(10):934–939
Westbrook J, Woods A, Rob M et al (2010) Association of interruptions with an increased risk and severity of medication administration errors. Arch Intern Med 170(8):683–690
Author information
Authors and Affiliations
Corresponding author
Appendix: ACC Task Statements
Appendix: ACC Task Statements
-
1.
Call an in-range (therapeutic) patient, patient is reached
Pull patien’s chart, determine patient’s INR result, prepare dosing plan, call patient, greet patient, ask patient standard questions, recommend dose adjustment, ask patient for refill, schedule next appointment on Vista, enter note on CPRS, close chart, notify pharmacist to co-sign, to: monitor/manage an in-range Coumadin patient.
-
2.
Call an in-range (therapeutic) patient who has recent procedure, hospitalization, changes in medication, or other special needs
Pull patient’s chart, determine patient’s INR result, prepare dosing plan, call patient, greet patient, ask patient standard questions, recommend dose adjustment, ask patient for refill, schedule next appointment on Vista, enter note on CPRS, close chart, notify pharmacist to co-sign, to: monitor/manage an in-range Coumadin patient with special need.
-
3.
Call an out-of-range (non-therapeutic) patient, patient is reached
Pull patient’s chart, determine patient’s INR result, prepare dosing plan, call patient, greet patient, ask patient standard questions, recommend dose adjustment, ask patient for refill, schedule next appointment on Vista, enter note on CPRS, close chart, notify pharmacist to co-sign, to: monitor/manage an out-of-range Coumadin patient.
-
4.
Call an in-range patient, patient is not reached, leave a message
Pull patient’s chart, determine patient’s INR result, prepare dosing plan, call patient, leave patient a message (INR came good, continue with the same dose, schedule the next appointment, etc.), ask patient to call the clinic for a refill or for any other questions, leave a call back number, schedule next appointment on Vista, enter note on CPRS, close chart, notify pharmacist to co-sign, to: monitor/manage an in-range Coumadin patient who was not reached by phone.
-
5.
Call an out-of-range patient, patient is not reached, leave a message
Pull patient’s chart, determine patient’s INR result, prepare dosing plan, call patient, leave patient a message (tell the patient that INR is high/low, ask patient to call the clinic as soon as possible, leave a phone number), enter note on CPRS, close chart, notify pharmacist to co-sign, to: monitor/manage an out of range Coumadin patient who was not reached by phone.
-
6.
Call a no-show patient
Pull patient’s chart, call patient, greet patient (leave a message), tell patient that he/she was enlisted for blood draw, but did not show up, schedule next appointment on Vista, enter note on CPRS, close chart, to: reschedule appointment for a no-show patient.
-
7.
Call patients to remind their appointments
Pull patient’s chart, call patient who is late for his lab appointment, greet patient (leave a message), remind patient that he/she was enlisted for blood draw, ask the patient if he needs to reschedule his appointment, enter note on CPRS, close chart, to: remind a patient who is late to his lab appointment.
-
8.
Call a patient on new oral anticoagulant (NOAC patient)
Pull patient’s chart, determine patient’s INR result, prepare dosing plan, call patient, greet patient, ask patient standard questions, recommend dose adjustment, ask patient for refill, schedule next appointment on Vista, enter note on CPRS, close chart, notify pharmacist to co-sign, to: monitor/manage patients on NOAC medication.
-
9.
Triage/answer patient phone calls
Answer patient call, greet patient, verify patient information (e.g., SSN, DOB), pull patient’s chart, ask reason for calling, help patients with their questions (e.g., clarify dosing, reschedule next appointment, prescription refill, advice on food and drug interactions, bleeding events, upcoming procedures, etc.), triage calls to pharmacist as needed, enter note on CPRS, close chart, to: answer patient calls with their questions.
-
10.
Receive a call from/call a visiting nurse assistant (VNA)
Answer phone call from VNA, greet VNA, ask for patient’s name, pull patient’s chart, ask for patient’s INR, ask standard questions, recommend dose adjustment, ask patient for refill, schedule next appointment on Vista, enter note on CPRS, close chart, notify pharmacist to co-sign, to: monitor/manage a Coumadin patient visited by VNA.
-
11.
Check voicemail, call returned, patient is reached
Check voicemail, enter note on CPRS, pull patient’s chart, determine patient’s INR result, prepare dosing plan, call back patient, greet patient, ask patient standard questions, recommend dose adjustment, ask patient for refill, schedule next appointment on Vista; enter note on CPRS, close chart, to: monitor/manage a Coumadin patient who left a message.
-
12.
Check voicemail, call returned, patient is not reached, leave a message
Check voicemail, enter note on CPRS, pull patient’s chart, determine patient’s INR result, prepare dosing plan, call back patient, leave patient a message, enter note on CPRS, close chart, to: monitor/manage a Coumadin patient who left a message.
-
13.
See an in-range patient face-to-face(F2F), follow-up appointment
(Get patient from waiting area), greet patient, pull patient’s chart, determine patient’s INR result, ask patient standard questions, recommend dose adjustment, ask patient for refill; schedule next appointment on Vista; enter note on CPRS, close chart, notify pharmacist to co-sign, to: monitor/manage an in-range Coumadin patient who comes to clinic.
-
14.
See an out-of-range patient F2F, follow-up appointment
(Get patient from waiting area), greet patient, pull patient’s chart, determine patient’s INR result, ask patient standard questions, recommend dose adjustment, ask patient for refill; schedule next appointment on Vista; enter note on CPRS, close chart, notify pharmacist to co-sign, to: monitor/manage an out-of-range Coumadin patient who comes to clinic.
-
15.
See a new patient consult F2F
(Get patient from waiting area), greet new patient, provide orientation to patient, educate patient on Warfarin therapy, explain to patient about Warfarin interaction with food, alcohol, and other drugs, explain to patient about over-the-counter medications and vitamin k interactions with Warfarin, print and give patient list of medications that patient should/should not take, explain to patient about lab draw and follow-ups, hand over educational package, update patient’s information on CPRS, provide patient with written dosing instructions, schedule next appt. on Vista, enter note on CPRS, close chart, to: educate and help patient start Warfarin therapy.
-
16.
Perform point-of-care (POC) service
Get the patient from the waiting area, greet, chat with patient, verify SSN in the machine, put the strip into the machine, do POC test, read INR result, ask standard questions, provide new dose adjustment, ask for refill, reschedule next appointment, provide hand-written dose instructions, enter note on CPRS, notify pharmacist to co-sign, to: monitor/manage a Coumadin patient with POC testing.
-
17.
Calculate patient’s dose
Pull patient’s chart, review patient’s previous INR results, calculate new dose, prepare a dose plan, to provide patient with optimal dose plan.
-
18.
Communicate with patient’s provider/nurse
Call/receive a call from patient’s provider/nurse, discuss about the patient’s upcoming procedure, hospitalization, Warfarin bridging, medication reconciliation, or other patient’s concerns, to: consult with the provider/nurse about the patient.
I. Administrative/miscellaneous tasks
-
19.
Run lab accession report
Open Vista, run lab accession list, view and sort incoming INRs, enter INRs into database, print and distribute to pharmacists to: see new INR results entered into the system.
-
20.
Manage secure message
Manage emails, send/receive secure message, and communicate via Lync, to: send and receive messages.
-
21.
Enter outside patient INR result
Obtain INR result from outside clinic, enter INR into CPRS using outside lab health factor, to: update the latest outside INR result of patients.
-
22.
Place lab orders, in batch
Pull patients’ chart one at a time, place lab order for all patients scheduled for the next clinic day, to: inform the laboratory unit with the list of patients coming for blood draw for the appointment day.
-
23.
Print, fax, or mail letters
Print off appointment letters, INR results, lab order labels, dose instructions, etc., fax/mail them to the patient, to provide a written information to the patient.
-
24.
Track patients
Track patients who frequently miss their visits, make arrangements for traveling veterans, etc., to: help patients continue with their Coumadin treatment.
-
25.
Organize clinic database
Maintain and update clinic database, manage and monitor TTR dashboard for quality assurance, to: have an organized database system.
-
26.
Manage clinic inventory
Check clinic supplies regularly, stock supplies when required, print educational materials, to maintain supplies needed for the clinic.
Rights and permissions
Open Access This article is distributed under the terms of the Creative Commons Attribution 4.0 International License (http://creativecommons.org/licenses/by/4.0/), which permits unrestricted use, distribution, and reproduction in any medium, provided you give appropriate credit to the original author(s) and the source, provide a link to the Creative Commons license, and indicate if changes were made.
About this article

Cite this article
Hailemariam, D.A., Shan, X., Chung, S.H. et al. Developing an appropriate staff mix for anticoagulation clinics: functional job analysis approach. J Ind Eng Int 15, 103–118 (2019). https://doi.org/10.1007/s40092-018-0267-5
Received:
Accepted:
Published:
Issue Date:
DOI: https://doi.org/10.1007/s40092-018-0267-5