Abstract
This study aims towards the improvement of a reinforced concrete rigid-frame bridge in an effort to reduce the construction and maintenance costs, and achieve an improved seismic performance. Correspondingly, a new structural rigid connection is proposed for H-shaped steel girders and reinforcing bars at the corner of the rigid-frame structure. Both experiments and numerical analyses were performed. Prototype models were constructed and subjected to static loading tests to reveal their load-carrying capacity and failure mode. Numerical models were then developed using finite elements to evaluate the experimental results. Analyses elicited good agreement between simulation and experimental data and validated the numerical models. Moreover, the validity of the proposed rigid connection was confirmed, and the failure behavior was clarified. Finally, a full-size model of the reinforced concrete rigid-frame bridge with H-shaped steel girders was constructed and subjected to destructive loading tests to evaluate structural integrity of the proposed rigid connection.
1 Introduction
In the design and construction of civil engineering structures, the cost, which is governed by the design, strength, and behavior of the structural components, is a primary concern for clients. Additionally, composite structures are extensively employed in bridge construction owing to their superior engineering features, such as high-fatigue capacity, excellent ductility, energy absorption capacity, and seismic behavior, particularly in areas of high seismic probability. Therefore, a bridge with high load-carrying capacity and high fatigue capacity is required to reduce the maintenance cost. Tokuno et al. (2005) clarified that a hybrid section could be consisted of concrete and H-shape steel without the use of stud dowels and could withstand loads until the plastic stage, and that the static load was equally distributed to each H-shaped steel section in the elasticity stage. In one of our previous studies, a low-cost, short span (up to a 20 m span), reinforced concrete (RC) slab bridge with H-shaped steel girders, was proposed for use as a roadway bridge (Fukada et al. 2006). Based on the results of static loading and a fatigue tests on two test specimens, it was proven that the proposed design was able to resist repeatedly applied loads, such as those imposed by heavy vehicles in motion. In particular, the test bridge elicited high-fatigue capacity and load-carrying capacity performances under cyclic loads that were comparable to the statically (noncyclically) loaded performances. Although it is well known that a rigid-frame bridge has low-cost and structural performance advantages compared to the simple girder bridge (Fukada et al. 2008), the structural design and constructions of the rigid connections are complicated.
Indeed, the structural detailing of the girder-abutment connection plays a vital role in the design of the rigid frame bridge. Among different rational design approaches developed for integral bridges, few studies proposed simplified approaches to the design of corners of the rigid-frame bridge. Iwasaki and Kurita (2011) reviewed structural details and load transmission mechanism of the three typical girder-abutment connections which join the superstructure and substructure in the steel–concrete composite rigid-frame bridge. Chung et al. (2013) proposed a vertically prestressed rigid-frame bridge to which vertical prestressing was applied through steel bars anchored in the pier wall. However, that approach required additional ordinary steel supports in addition to supports comprised of high-strength bars for prestressing at the pier wall. Therefore, it is urgently needed to conduct investigations on the rigid corners, which can contribute to efficient design approaches. In the present study, a new connection method using H-shaped steel girders and reinforcing bars at the corners of the rigid frame was developed to simplify the construction. The flow chart of the present study is illustrated by the flow diagram of Fig. 1. Firstly, prototypes of the corners of the RC rigid-frame bridge were constructed with H-shaped steel girders and were subjected to static destructive loading tests to reveal their load-carrying capacity and failure mode. Regarding numerical simulation, a commercial finite element code with specific nonlinear analysis capabilities was used to reproduce the plastic behavior of the proposed structure and to verify stress transmission mechanisms at the corners. The developed model considered the nonlinear mechanical properties of concrete and steel, and the complex interactions among H-shaped steel girders and concrete in deck slabs. To facilitate the simulations, some assumptions were adopted in regard to the mechanical properties of each model component of the footing, abutment, and deck parts. In addition, a parametric study was carried out by changing the heights of the steel girders in order to examine its possible effects on the ultimate strength behavior of the proposed connection. A full-size model of the RC rigid-frame bridge reinforced with H-shaped steel girders was constructed and subjected to destructive loading tests to evaluate the feasibility of the proposed girder-abutment connection approach. Finally, design procedures for the proposed connection were recommended based on these numerical studies and validations.

Flow diagram outlining the structure of the present study
2 Outline of Reinforced Concrete Rigid-Frame Bridge with H-Shaped Steel Girders
The cost of the substructure in the simple girder bridge with a short span (up to 20 m) is generally more expensive than that of the superstructure. Although the cost of the superstructure is cheaper in proportion to the length of the bridge span, the cost of the substructure is not dependent on the bridge length. Moreover, because the size of the abutments of the bridge is determined by the dead load and the backfilling pressure, the cost will also become higher in proportion to the height of abutments. While the abutments of a simple girder bridge (Fig. 2a) are independent with each other, those of the rigid-frame bridge (Fig. 2b) are unified. Therefore, the pressure of the backfilling acting on each abutment is canceled through the superstructure. The size of the substructure can be made smaller compared to the simple structure. This is particularly evident in the case of the pile foundation, where the number of the piles can be reduced.

Comparison of structures. a Simple structure. b Rigid-frame structure
3 Proposal of the Corner Structure
Figures 3 and 4 illustrate the stress transmission mechanism of the typical corner structure of the RC rigid-frame bridge, and the corresponding arrangement of the reinforcing bars. In these figures, it is necessary to locate the reinforcing bars against the bending moment at the corner, which makes this conventional structure complicated. Moreover, it is important that concrete is placed with care.

Stress transmission mechanism at the rigid corner

Arrangement of rebars at the corner of the RC rigid frame bridge
So far, from the aim to obtain high performance at reasonable cost, the perfobond ribs (Perfobond Leiste in German (PBL)) has been developed in Germany (Zellner 1987; Tagaki et al. 2003; Wang et al. 2018). This new approach has been widely applied in some steel–concrete composite bridges as a principal load-transfer element between the concrete roadway and the steel deck (Wang et al. 2018). Regarding steel-PSC (prestressed concrete) beams, PBL can be utilized as shear connectors instead of studs in joints connecting the steel beam and the PSC beams (Kim et al. 2010). Specifically, the perfobond rib is a flat steel plate through which a number of holes are punched, which provides shear resistance at the steel–concrete interface by dowel actions. In 2010, Kim et al. evaluated the structural capacity and feasibility of joints with parallel perfobond ribs in the steel-PSC hybrid beam. The prefobond ribs were applied to the joints connecting the steel beam and the PSC beams to provide a practical alternative to stud shear connectors. The results showed that the perfobond ribs could be an alternative to stud shear connectors in joints of hybrid beams. Recently, Wang et al. (2018) carried out push-out tests on 33 test specimens to investigate how the connection parameters affect the shear capacity and behavior of the PBL connectors used in some steel–concrete composite bridges. Their results showed that the shear strength increased with the increases in the diameters of the transverse rebar, and the rib hole, and an increase in thickness of the perforated rib plate. With the aim of contributing to efficient structural design approaches for constructing the rigid corner, this study suggests the main reinforcing bars of the abutment pass from the lower to the upper flange of the H-shaped steel girders, and are then secured by bolts, as shown in Figs. 5 and 6. Therefore, the stress is directly transmitted via the H-shaped steel girders, reinforcing bars, and concrete, as shown in Fig. 7. This approach is based on PBL approach for constructing the rigid connection proposed by Takagi et al. (2003).

Connection between the main rebars of the abutment and H-shaped steel girders of the deck

Fixation scheme using bolts placed on the upper flange. a Cross-section. b Top side

Stress transmission mechanism at the proposed corner
4 Load Test on Rigid Corner Structures
4.1 Objectives of Load Test
The test was conducted for the following purposes:
-
To understand the behavior up to the ultimate state of the fixation between the main rebars of the abutment and H-shaped steel girders of the deck in the proposed rigid-frame corner structures.
-
To improve the durability and reduce the maintenance and management expenses in the actual construction of the slab bridge using the H-shaped steel girders, heavy corrosion-resistant painting (hot-dip galvanizing treatment) was applied to the steel girders. Therefore, the difference in the ultimate behavior in the cases where H-shaped steel girders was used with and without coating and galvanizing was also investigated to evaluate the bond effect of zinc coating.
-
In order to make the load transfer from the H-shaped steel girders to the main rebars uniform at the corners, and in order to improve the flexural strength of the corners, a short reinforcing girder was arranged between the two main H-shaped girders. Therefore, a comparison is performed between the case where the reinforcing girder is arranged between the two main girders at the corner, as shown in Fig. 8. Specifically, when the reinforcing girder is provided, the ratio of the main girder spacing to girder height is 2.4 (600 mm/250 mm). In the case where there is no reinforcing girder, it becomes equal to 4.8 (1200 mm/250 mm).
Fig. 8 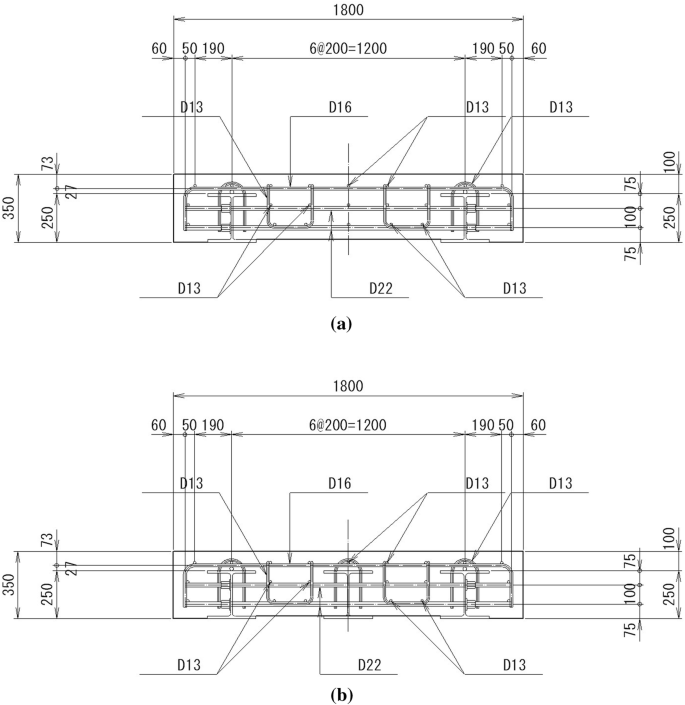
Cross-sectional view of rigid corner specimens (unit: mm). a Rigid corner specimen (without reinforcing girder, Case 1(a)-(b)). b Rigid corner specimen (with reinforcing girder, Case 2(a)-(b))

Therefore, four specimens were prepared for the rigid corners to fulfil the aforementioned purposes. As shown in Table 1, specimens were constructed for comparing the unpainted H-shaped steel girder and the H-shaped steel girder subjected to a hot-dip galvanizing treatment, and the presence or absence of a reinforcing girder arrangement at the bridge corner.
4.2 Specifications of Test Specimens
The prototypes of the rigid-frame corner structures with H-shaped girders were constructed in accordance to the specifications shown in Figs. 8a, b and 9a, b. The specimens had a cantilever length of 2.00 m, a total height (from the bottom surface of the footing to the top surface of the deck) of 1.80 m, and a width of 1.80 m, using H-shaped girders (height of web: 0.25 m) separated by the distances of 1.2 and 0.6 m in Cases 1(a)-(b) and 2(a)-(b), respectively. The compressive strength of concrete was set to 24, 30, and 30 N/mm2 for the footing, the abutment, and the deck, respectively. Steel grades SD345 and SS400 were used for the reinforcing bars, and the H-shaped girder (H250 × 250 × 9×14), respectively. The dimensions of the specimens were provided in Table 2.

Rigid corner specimen (with reinforcing girder, Case 2(a)-(b)) (unit: mm). a Side view. b Top view
4.3 Overview of Loading Test Setup
The loading test was performed to confirm the structural behavior of the entire specimen and the joint between the H-shaped steel girders and the main rebars until the final state, as shown in Fig. 10. A 3000 kN hydraulic jack and one load cell were placed near the end of the cantilever (2 m from the corner) for applying and measuring the imposed loading, as shown in Fig. 9a. Strains and displacements were measured. In order to obtain the deflection properties of the entire specimen, displacement meters were installed vertically at the loading positions and the middle points of the overhanging part. Furthermore, strain gauges were installed to confirm the stress variations of concrete and H-shaped steel girder in the deck slab, and of the main reinforcing bars of the abutment at the corner. Therefore, strain gauges were attached to the upper surface of the concrete deck, to the upper and lower flanges, the web of H-shaped girders, and to the main steel bars of the abutment. The footing was fixed on the strong floor to assure the restraints to translational and rotational movements.

Static loading test setup
4.4 Loading Test Results and Discussions
4.4.1 Fracture Behaviors of Rigid Corner Specimens
Figure 11a, b shows the relationship between load and deflection at the loading point as an outcome of applying load on the corner specimens. The deflection was estimated as the average of the values obtained from the two displacement meters installed at the loading points near the end of the cantilevers. The results revealed that the fracture behavior and the final load performances of the galvanized test specimens were similar to those elicited by the uncoated specimens (see Fig. 11a). Specifically, based on the comparison of the load-bearing capacities, the final loads of Case 1(a) and Case 1(b) were ~ 385.14 and ~ 370.77 kN when the vertical displacement at the loading points was measured to be 117.56 and 131.39 mm, respectively. These loads caused the failure of concrete at the construction joint. Regarding cases 2(a) and 2(b), the final failure occurred when the maximum loads of 373.05 and 368.81 kN were applied, respectively. Therefore, the load-carrying capacity of Case 1(a) with galvanized H-shaped steel girders was slightly higher by approximately 3.8% compared to the uncoated specimen (Case 1(b)). This ratio was estimated to be ~ 1.15% with regards to the outcomes of cases 2(a) and 2(b). A previous study by Langill (2009) proved that the hot-dip galvanizing process had no major effects on the mechanical properties of the structural steel. This outcome was confirmed in the present study. In addition, because the difference in the final load was small, the influence of zinc coat on the bond strength and load transfer between concrete and H-shaped girders was considered insignificant in the test cases although it was obtained that the results of the galvanized test specimens were slightly stiffer than those of the uncoated specimens. This insignificant effect of zinc coat was also studied by Hamad and Mike (2005), reporting that the protective layer of zinc had a negligible influence on the bond strength of the rebar in concrete with ordinary strength. Although a comparison was also conducted on the test specimens with respect to the presence or absence of reinforcing girders, the outcomes showed that there was no significant difference in the load–displacement relationship and the ultimate strength with respect to the presence or absence of reinforcing girders, as shown in Fig. 11b. Specifically, there was a small difference of about 3.2% in the load-carrying capacity between Case 1(a) and Case 2(a).

Relationship between load and displacement at loading point. a Comparison between specimens using uncoated and galvanized H-shaped girders. b Comparison of the presence of the reinforcing girder
The order of appearance of the cracks in the specimens was almost the same over the increase of the load. Specifically, the fracture behavior in the rigid corner portion of Case 1(a) can be summarized as follows. Firstly, initial cracks occurred on the upper surface of the deck near the corner (~ 100 kN). The construction joint between the abutment and the deck then opened slightly at ~ 140 kN. Cracks on the upper surface of the concrete deck progressed towards the loading point. When the applied load was approximately 325 kN, horizontal cracks appeared on the posterior side of the abutment. Finally, ruptures from the joint between the abutment and the deck developed and led to the compressive failure of concrete at the intersection at the instant when the applied load was increased to ~ 385 kN. Figure 12a, b shows the crack patterns of the specimens subjected to hot-dip galvanizing in the cases without (Case 1(a)), and with the use of reinforcing girder (Case 2(a)), respectively. Regarding Case 1(a), in addition to the transverse cracks on the top surface of the deck slab, cracks also developed in the bridge-axis direction (parallel with the longitudinal direction of the H-shaped girders) indicated using red marks in Fig. 12a.

Cracking patterns of the tested specimen. a Without reinforcing girder, subjected to galvanizing (Case 1(a)). b With reinforcing girder, galvanizing (Case 2(a))
4.4.2 Variation of Strains at the Corners
Figure 13 shows strain results of Case 1(a) obtained from the experiment. The strain result at each position of the steel girder showed in the figure was the average of the values obtained from two strain gauges installed on the two steel girders at similar positions. Also, the strain results of the main rebars were the average values obtained from six strain gauges installed on the rebars at the observed positions. From Fig. 13, the top flange of the H-shaped girder in the cross-sections at the front of the abutment (position UH2) and at the corner (position UH1) showed tensile behaviors with increasing load. The top flange of steel girder at position UH2 started yielding when the applied load was ~ 330.6 kN, and the corresponding strain value was measured to be ~ 1627.27 μɛ. At the bottom surface of the same cross-section (position LH2), compressive strain occurred when the load was applied to the specimen and increased with increasing load. The strain was measured to be − 1232.54 μɛ under the maximum load. Strain gauges were also attached to the top and bottom surfaces of the steel girder at the rigid corner (positions UH1 and LH1) where the main rebars of the abutment were connected to the steel girders. It can be confirmed that the top surface of the steel girder (position UH1) was in a tensile state, contrary to the bottom side. The tensile strain at position UH1 was about ~ 476 μɛ under the maximum load and the tensile stress was estimated to be about 98.54 N/mm2 which was equivalent to about 30% of the yield stress of the H-shaped steel girder (332.88 N/mm2).

Load–strain relationships of Case 1(a). a Load–strain relationships of the H-shaped steel girder. b Load–strain relationships of the main rebar of the abutment
Figure 13 also illustrated the load–strain relations obtained from strain gauges attached to the main rebars of the abutment at six positions U1 ~ U3 and D1 ~ D3. The reinforcing bars at the posterior side of the abutment were in the tensile state during the experiment. It was measured that the rebars reached yield first at position U3 as the load exceeded ~ 302.49 kN. Then, the yield at position U2 started at about 347.57 kN. From the observation results of the development of cracks, horizontal cracks appeared on the posterior side of the abutment when the applied load was approximately 325 kN. Moreover, the load–displacement curve of Case 1(a) changed significantly from about 300 kN, as shown in Fig. 11. Possible reasons for these results were the yield of the main rebars at the posterior side of the abutment and the yield of the top flange of the steel girder at position UH2 as the load increased. Regarding strain results obtained from the main rebars at the front side of the abutment (positions D1, D2, D3), the compressive strains initially occurred in the rebars when the load was applied. As the load increased, the neutral axis shifted, and the compressive strains decreased gradually and were converted to tensile strains when the load exceed about 90 kN regarding position D2 and about 230 kN with respect to positions D1 and D3. Then, the rebars started yielding at positions D2 and D3 when the applied load was ~ 369.79 and ~ 385.14 kN, and the corresponding strain values were measured to be ~ 2247.78 μɛ and ~ 2148.57 μɛ, respectively. In addition, strains of the rebars at positions U1 and D1 between the upper and lower flanges of the H-shaped girders were measured to be in tensile states when the maximum load was applied. Contrary to the rebars at position U1 only yielding at the final state, the strain of the main rebars at position D1 was measured to be ~ 1445.08 μɛ and the corresponding stress was estimated to be ~ 280.35 kN under the maximum load. This is equivalent to about 69% of the yield stress of the steel material used for the main rebars.
From the strain analysis, the strain variation at the rigid frame corner of Case 1(a) can be summarized as follows. At the top flange of the steel girders and the main rebars at the posterior side of the abutment, tensile strain occurred when the load was applied, whereas the bottom surface of the steel girders and the main rebars at the front side of the abutment were in tensile states. As the load increased, the neutral axis at the abutment moves from the posterior side to the front side, and after the applied load exceeds 90 kN, the tensile stress was generated at position D2 of the main rebars at the front side. When the applied load was about 302.49 kN, the main rebars at the posterior side started yielding, and then the top flange of the H-shaped steel girders (position UH2) reached yield when the load exceeded ~ 330.6 kN. The final failure of the corner specimen occurred when the main rebars at the front side of the abutment (position D3) yielded at ~ 385.14 kN. Similar outcomes were also observed with respect to the strain variation of the corner specimen of Case 1(b) with uncoated steel girders.
In the cases without reinforcing girders (Cases 1(a) and 1(b)), the top flange of the steel girder yielded and plasticized after the main rebars of the abutment yielded, but it did not yield in the case when a reinforcing girder was placed between the main girders (Cases 2(a) and 2(b)), as shown in Fig. 14. Specifically, the strains occurring at the top flange of the steel girder at the observation point were measured to be ~ 1092.34 μɛ and ~ 1154.54 μɛ under the maximum load for Case 2(a) and Case 2(b), respectively. The corresponding tensile stresses were estimated to be about 226.15 and 239 N/mm2, which were equivalent to about 68 and 71% of the yield stress of the steel material used for the girders (332.88 N/mm2), respectively. Therefore, regarding the specimens with the reinforcing girders, the top flange of the H-shaped steel girder in the cross-section at the front of the abutment did not yield even when the maximum load was applied. The ratio between the spacing and the height of the main H-shaped steel girders in the case when there was no reinforcing girder was 4.8 (1200 mm/250 mm). Because the steel girders did not yield before the main rebars of the abutment in Cases 2(a) and 2(b), it is useful to place a short-length reinforcing girder at the rigid corner when the main girder interval is wide. In addition, the uncoated and galvanized test specimens were also compared, however, the strains yielded similar tendencies, as shown in Fig. 14.

Load–strain relationships at the upper flange of the H-shaped steel girder
The relationship between the applied load and strain of the main rebars of the abutment is illustrated in Fig. 15 regarding to cases 1(b) and 2(b). As it can be seen in this figure, no significant difference in the strain variation was observed owing to the presence or absence of the reinforcing girder. Plasticization was observed at the section near the lower flange of the girder, and at the joint part between the abutment and the deck (positions U2 and U3). The opening at the joint (see Fig. 16) was considered as the main cause of the plasticization of the main rebars of the abutment. However, regarding Case 2(b), the strain at position U1 was measured to be ~ 1603.02 μɛ under the final load and the corresponding stress was estimated to be about 310.99 N/mm2, which was lower than the yield stress used (406.42 N/mm2). Thus, the section of the main rebar between the upper and lower flanges of the H-shaped steel girder remained in the elastic region until the final load (position U1). Moreover, because plasticity did not occur in the vicinity of the fixing part, and breakage of the fixing nut was not confirmed, no problem was encountered in the implementation of the fixation method of the H-shaped steel girder using the fixing bolts and the deformed screw bars.

Load–strain relationships of the main rebars of the abutment of cases 1(b) and 2(b)

Opening at the joint
5 Numerical Analyses
5.1 Overview of Analysis Model
To obtain a deeper understanding of the variations in the structural behavior at the joint, numerical simulations were performed using the finite element (FE) method. In the numerical approach, the models were first validated by comparing the elicited results with those obtained in real-scale tests. The emphasis here is on the methodology, i.e., on the identification of ways to apply the FE analysis to a connection prototype at the corner of the rigid frame that possesses new characteristics. Because the destructive test itself encompasses nonlinear structural features and is associated with significant deformation, modeling the behavior of the specimen until the final state requires the consideration of both high-order geometrical and nonlinear mechanical parameters, particularly on the selected nonlinear models. As shown in Fig. 17, a three-dimensional (3D) numerical model is produced in accordance with the specifications of the actual specimen of Case 1(a) using FX + in DIANA, which is a commercially available program for nonlinear finite element analyses. The constructed FE model was the half part of the real sample and was implemented by adding the symmetry constraint for the boundary condition setup. It is possible to use this approach to accurately model the static loading test that lasts only a short period of time with an appropriate computational cost, and that involves the generation of force, deflection, stress, and strain results. Regarding the element types used in the analyses, the concrete was modeled as a solid element, while shell elements were utilized for the models of the H-shaped girders and fitting steel. The beam elements reproduced the vertical reinforcements of the abutment and the horizontal rebars connecting the H-girders. For the models of other reinforcing bars, embedded steel reinforcement elements were employed. In addition, an interface element, which was free in the shear direction, and only resisted compression in the bearing stress direction, was provided between the H-girder and concrete. The bonding force between the concrete and steel was assumed to be complete. The energy-controlled convergence norm and the regular Newton–Raphson were selected as the iterative methods. The analysis was carried out by applying incremental load factors with specified sizes.

Three-dimensional (3D) analysis model for Case 1(a)
5.2 Material Properties of Concrete
The rotating total strain crack model for concrete (DIANA FEA 2017) was employed herein, which includes the JSCE tension softening model for tensile behavior, and the multilinear model for compressive behavior. The parameters of concrete for the rotating strain crack model are presented in Table 3. Specifically, the Young’s modulus and the compressive strength of concrete were obtained from compression tests on concrete cores collected from the test specimens. The multilinear model was utilized to reproduce the concrete’s compression stress–strain relationship, as shown in Fig. 18a. Moreover, the critical parameters governing the JSCE tension softening model for tensile behavior (Fig. 18c) were the fracture energy and the tensile strength of concrete. The fracture energy of concrete is the energy consumed to form cracks per unit area, and is calculated based on Eq. (1) (JSCE 2012).
where Gf, dmax, and \(f_{ck}^{ '}\), are related to the fracture energy (N/mm), the maximum aggregate size (mm), and the compressive strength of concrete (N/mm2), respectively. In the present study, the value of dmax is assumed to be equal to 25 mm. Additionally, owing to the absence of experimental data, the estimation of the tensile strength of concrete ftk can be achieved using Eq. (2), based on the characteristic compressive strength \(f_{ck}^{ '}\) (JSCE 2012).
where the unit of strength is N/mm2.

Stress–strain curves of concrete. a Compression side. b Tensile side
5.3 Steel Materials
The utilized steel materials in the FE model were assumed as elastoplastic materials with characteristics obtained from the tensile tests, as listed in Table 4. To simulate the nonlinear behaviors of steel, a Von Mises plasticity model with strain hardening was employed in this study. The tensile stress and strain relationship was assumed to be bilinear, as shown in Fig. 19.

Stress–strain curves of steel materials. a H-shaped steel girders and fixing plates. b Screw rebar and other bars
5.4 Numerical Results and Discussion
Figure 20 shows the experimental and numerical results of the load–displacement relationship extracted at the loading position. As shown in this figure, the displacement increases gradually as a function of loading until approximately 300 kN. After the yielding of the main rebars of the abutment, the joint between the abutment and the deck was widely opened, as described in the previous section, which led to the change in the slope of the curve. The displacement increased moderately, and the load was later terminated when the displacement at the observed point reached an approximate value of 117.77 mm at the corresponding applied load of 385.14 kN. In regard to the elicited numerical results, the values of the maximum displacement and the corresponding load were estimated to be equal to 119.37 mm and 382.5 kN, representing ~ 1.35 and ~ 0.7% differences from the experimental outcomes, respectively. Moreover, the relations between the applied load and the strains of the main reinforcing bars of the abutment are summarized and shown in Fig. 21. The figure shows that the trends in the strain variation in both the experimental and analytical results concerning the increase in the applied load are similar. The main rebars at the posterior side of the abutment showed tensile behaviors during the experiment (see Fig. 21a). Specifically, the rebars firstly yielded in the vicinity of the joint at position U3 as the load exceeded ~ 290 kN. This value was obtained at ~ 302.5 kN with respect to the measurement. Regarding simulation results obtained from the main rebars at the front side of the abutment (Fig. 21b), the strain variation followed an expected trend. In other words, the compressive strains decreased gradually with the increasing load and were then transformed to tensile strains. Moreover, strains of the rebars at positions U1 and D1 between the upper and lower flanges of the H-shaped girders were estimated to be in tensile states while the final load was applied. The strain value at position U1 was estimated to be ~ 2023 μɛ and the corresponding experimental value was measured to be ~ 2100 kN, representing ~ 3.8% difference among two results. In addition, the formation of cracks was also modeled by the FE approach. Figure 22 is an illustration of a contour diagram of the crack strain at the final state of the model of Case 1(a), which indicates good agreement with the actual observations, as shown in Fig. 12a. From the simulation results, the cracks developed in the order at the upper surface of the deck near the corner, the construction joint between the abutment and the deck, the posterior side of the abutment. Finally, compressive failure of concrete occurred at the construction joint when the applied load reached up to 382.5 kN.

Displacement–load relationship at the free end of H-shaped girder

Load–strain relationship of the main rebars of the abutment. a Load–strain relationships of main rebars at the posterior side. b Load–strain relationships of main rebars at the front side

Contour diagram of crack strain at final load. a Isometric view. b Side view. c Top view
From the obtained results, it can be asserted that the numerical model yields reasonable results on the ultimate strength behavior of the specimen, and is useful for further parametric analyses. The next section shows the results of a numerical simulation carried out to examine the effect of the height of the H-shaped girders on the stress transmission at the joint, which could not be conducted experimentally.
6 Parametric Studies
6.1 Overview of the Numerical Models
The parametric study was conducted to verify the effects of the height of the girder on the stress transmission at the corner, and the load-bearing capacity of the proposed structure. Therefore, based on the analytical model of Case 1(a) conducted in the previous sections, another FE model (Case 1(c)) was built and subjected to the nonlinear structural analyses of the destructive loading test. The properties of this assumption are presented in Fig. 23. In regard to the examined model of Case 1(c), the H-shaped girder interval was maintained the same as that in the actual model, whereas the girder height was increased up to 300 mm. Moreover, there were no changes in the material characteristics, or in the nonlinear analytical models and the boundary conditions used in these models.

Specifications of the model utilized for parametric study (Case 1(c)) (unit: mm)
6.2 Results and Discussions
6.2.1 Load–Displacement Relationship
Figure 24 presents the numerical results of the load–displacement relationship extracted at the loading position of the models. As a result of the comparison of the load-bearing capacities, the final load of Case 1(c) was ~ 540 kN, which was significantly higher than that of Case 1(a) by approximately 41.17%. Specifically, regarding the flexural behavior of the assumed model, the displacement increased gradually as a function of the loading until the load became approximately equal to 440 kN. After the main rebars of the abutment yielded, the joint between the abutment and the deck became widely opened, as described in the previous section, thereby leading to changes in the slope of the load–displacement curve. The displacement then increased moderately, and the load was later terminated when the displacement at the observed point reached an approximate value of 173.97 mm at the corresponding applied load of 540 kN. In regard to Case 1(a), which used a girder height of 250 mm, the maximum displacement and corresponding load values were estimated to be 119.37 mm and 382.5 kN, respectively. Based on the elicited load-carrying capacity results, it can be asserted that the height of the H-shaped girder had a vital role in the determination of the final load of the proposed structure. In other words, the increase in the height of the H-shaped girder from 250 mm to 300 mm enhanced the ultimate load of the model by ~ 41.17%. Because there were no changes in the material properties, one of the possible explanations for these results is that the increase in the girder height led to the increase in the moment of inertia—which is a term used to describe the capacity of a cross-section to resist bending—and thereby enhanced the bending stiffness of the deck slab.

Displacement–load relationship at the free end of H-shaped girder
6.2.2 Strain Variations
The relationship between the load and strain of the main rebars of the abutment is illustrated in Fig. 25. The change in the strain values of the main rebars of the abutment yielded similar trends to both the experimental and analytical results of Case 1(a). Specifically, plasticization was observed at the section near the lower flange of the H-shaped steel girder, and at the joint part between the abutment and the deck (positions U2 and U3). In opposition to the reinforcing bars of Case 1(a) remaining in the elastic range at position U1 until the final load, the rebars of Case 1(c) reached yield at this position after the applied load exceeded 495 kN.

Strain variation of the rebars of the abutment
6.2.3 Formations of Cracks
Regarding the formation of cracks, Fig. 26 illustrates a contour diagram of the crack strain at the final state of the model of Case 1(c). The failure behavior in the rigid corner of the specimen can be summarized as follows. Initial cracks occurred at the construction joint between the abutment and the deck at ~ 140 kN. During the process of crack propagation broader and longer cracks developed at the abutment, transverse cracks appeared on the upper surface of the deck near the corner, and progressed towards the loading point. Finally, ruptures from the joint between the abutment and the deck developed and led to a compressive failure of concrete at the intersection when the applied load was increased up to ~ 540 kN. Initial cracks occurred on the posterior side of the abutment in Case 1(c), whereas in Case 1(a), the cracks first developed on the upper surface of the deck. Therefore, there was a difference in the formation of cracks between the two models. Based on these results, it can be deduced that the increase in the heights of H-shaped girders and the deck enhanced the stiffness of the deck, and thereby increased the load-bearing capacity of the model, but led to the appearance of the first cracks on the posterior side of the abutment.

Contour diagram of crack strain of Case 1(c) at 540 kN
7 Load Test on Full-Size Rigid-Frame Bridge
The structural behavior of the proposed connection was evaluated in both experimental and numerical analyses performed at the four rigid corners of the specimens. Based on the obtained results, the validity of the proposed rigid connection was confirmed, and the failure behavior was clarified. In this section, attempts were expended to evaluate the feasibility of the proposed rigid connection on the full-size model of the RC rigid-frame bridge with H-shaped steel girders. Specifically, a full-size prototype was constructed and subjected to the destructive loading test in the laboratory.
7.1 Overview of the Loading Test
The specifications of the prototype of the bridge are shown in Fig. 27a, b. The bridge had a span length of 6.00 m, a total height (from the bottom surface of the footing to the top surface of the deck) of 1.80 m, a width of 1.20 m, and used H-shaped girders (height of web: 0.25 m) separated by a distance of 0.6 m. The overall height of the deck was set to 0.35 m. The test bridge was constructed using the same properties for concrete and steel materials as those used for the rigid corner specimens.

Specifications of the test bridge (unit: mm). a Side view of the test bridge with a rigid structure. b Cross-sectional view of the test bridge with a rigid structure
The loading test was performed to confirm the structural behavior of the entire specimen and the joint of the H-shaped steel girders and main rebars until the final state. A 3000 kN hydraulic jack and one load cell were placed at the midspan of the bridge to allow application and loading measurements, as shown in Fig. 28. Measurement items were load, deflection (vertical direction), crack development, concrete surface strain, and strains of steel girders and main rebars. Displacement meters were installed at mid-span and quarter span locations to get the deflection of the bridge at each loading level. In addition, strain gauges were attached to the H-shaped steel girders, main reinforcing bars of the abutments and the concrete slab to examine strain behaviors occurring at investigation areas, i.e., the rigid corner, the abutment, the quarter span and mid-span locations of the bridge, shown as dash-line areas in Fig. 27a.

Loading test setup
7.2 Experimental Results and Discussions
7.2.1 Fracture behavior of rigid structural test specimen
Figure 29 shows the crack diagram of the bridge after the loading test. In contrast to the rigid corner specimens, compression fracture occurred at the midspan and on the upper surface of the deck at the final state. In particular, initial cracks appeared on the top surface of the deck near the corner (~ 120 kN). When the applied load was increased up to 210 kN, cracks were generated on the lower surface of the deck at the center of the span. The joint between the abutment and the deck then opened slightly at ~ 240 kN. During the process of crack propagation at the corner portion and midspan, cracks occurred horizontally near the middle area of the rear of the abutment (~ 570 kN). The cracks from the joint between the abutment and the deck then advanced and progressed to the inner parts of the abutment. Finally, compression failure occurred on the upper surface of the concrete deck at midspan (~ 1000 kN). The relationship between the applied load and the displacement at midspan is presented in Fig. 30.

Cracking pattern of the bridge at final state

Load–displacement relationship at midspan of the test bridge
7.2.2 Strain Variation at the Corner of the Bridge
Figure 31 presents the relationship between the load and the strain of the main reinforcing bars of the abutment with respect to the strain at the corners of the bridge. Similar to the corner test specimens, the reinforcing bars at the posterior side of the abutment were in the tensile state during the experiment. It can be seen that only the part at position U3 yielded and plasticized owing to the influence of the opening at the construction joint. Contrary to position U1, U4, U5 where the rebars did not yield even when the ultimate load was applied, the rebars yielded at position U2 and the tensile strain was measured to be ~ 2095.08 μɛ at the final loading level (see Fig. 31a). Figure 31b illustrated the load-strain relations obtained from strain gauges attached to the main rebars at the front side of the abutment. The compressive strains initially occurred in the rebars when the load was applied. As the load increased, the neutral axis shifted, and the compressive strains at positions D1, D2, D3 decreased gradually and were converted to tensile strains when the load exceed ~ 182, ~ 104 and ~ 841 kN, respectively. In addition, the rebars showed compressive deformation at positions D4 and D5 throughout the experiment. The maximum tensile strain occurring at position D2 was about 847 μɛ and the corresponding tensile stress was estimated to be about 164 N/mm2, which is equivalent to about 40% of the yield stress of the rebars used. From the obtained results, it can be asserted that the rebars at the front side of the abutment did not yield even at the final loading level.

Relationship between load and strain of main rebars of the abutment. a Load–strain relationships of main rebars at the posterior side. b Load–strain relationships of main rebars at the front side
From Fig. 32a, the top flange of the H-shaped girders in the cross-sections at the front of the abutment (position UH2) and at the quarter span (position UH3) showed tensile behaviors with increasing load, contrary to the mid-span position (UH4) being in the compression state. The bottom flange of steel girder at midspan (position LH4) started yielding when the applied load was ~ 760 kN, and the corresponding strain value was measured to be ~ 1658 μɛ. Meanwhile, compressive strain occurred at the bottom surface of the steel girder at positions LH3 and LH2 when the load was applied to the bridge and increased with the increasing load (see Fig. 32b). Therefore, the positive moment occurred at the midspan of the bridge and gradually shifted from positive to negative at the cross-section near the quarter span position.

Relationship between load and strain of steel girders. a Load–strain relationships at the top flange of the H-shaped steel girders. b Load–strain relationships at the bottom flange of the H-shaped steel girders
On the other hand, the strain of the top surface of the concrete slab at midspan was measured to be in a compression state with the increasing load but changed into the tensile direction when the maximum load was applied, as shown in Fig. 33. Moreover, there was no breakage in the fixing section at the corner of the bridge where the screw reinforcing bars and fixing nuts were used. Hence, from the strain analysis, the failure mode of the test bridge was not the yielding of the steel girders and rebars at the rigid corner. The final failure probably happened as the results of compression fracture occurred at the midspan and on the upper surface of the deck at the ultimate loading state (see Fig. 34). Therefore, the feasibility of the proposed connection approach was verified in the full-size specimen.

Relationship between load and strain of concrete surface at midspan

Compressive failure at midspan
8 Conclusions
This study proposed a new connection method of H-shaped steel girder and rebar in the corner of the rigid-frame structure of a bridge in order to improve the rigid connection to facilitate and simplify construction. The structural behaviors of a reinforced concrete rigid-frame bridge with H-shaped steel girder can be summarized as follows:
-
The static loading tests confirmed the occurrence of the failure mode, and the formation of cracks in the case of the proposed connection method for the H-shaped steel girder and rebar in the corner of the rigid-frame structure.
-
The numerical results agreed well with those obtained from the experiments. This work constitutes a fundamental first step in the conduct of parametric analyses and the implementation of subsequent design improvements for the proposed connection.
-
As a result of the comparison between test specimens using the H-shaped girder with and without galvanizing treatments, no significant differences were observed in the structural performance, including the fracture behavior, or failure load.
-
Moreover, because the difference in the final load was small, the negative influence of the zinc coat on the bond strength, and the load transfer between concrete and H-shaped girders, were considered as insignificant in the two cases studied herein.
-
In the case where no reinforcing girder was used, the upper flange of the H-shaped steel girders yielded and plasticized after the main rebars of the abutment yielded, but it did not yield in the case when a reinforcing girder was used between the main girders. Therefore, it is effective to place a reinforcing girder with a short length at the corner part in the instant when the main girder spacing is wide.
-
No problem was encountered in the use of the fixing method of the H-shaped steel girder using fixing nuts and deformed screw bars.
-
As a result of the numerical analyses, the increase in the heights of the H-shaped girders and the deck enhanced the stiffness of the deck, and thereby increased the load-bearing capacity of the model.
-
From the results of the load test on the full-size bridge, compression failure occurred on the upper surface of the concrete deck at midspan. Moreover, plasticization did not occur in the vicinity of the fixing part and breakage of the fixing nut was not confirmed. Therefore, the feasibility of the proposed connection approach was verified in the full-size specimen.
The results of the present study were obtained based on the numerical analyses and experiments conducted in the laboratory. This study is considered to be preliminary in reference to the use of a simple connection approach for the corner parts of rigid-frame bridges with a short span (up to 20 m). Further research is needed on the subject. Regarding long-term prospects, further research should be carried out to apply this approach extensively in practical cases. Future projects can target improvements in relation to the feasibility of the use of carbon fibers as an alternative material to H-shaped steel girder.
References
Chung, W., Jung, D., & Kim, S.-M. (2013). Strength and behavior of a vertically pre-tensioned composite rigid frame bridge. International Journal of Steel Structures, 13(2), 367–378.
DIANA FEA (2017). User’s manual of FX + for DIANA Version 9.6. https://dianafea.com/manuals/d101/Diana.html. Accessed April 2017.
Fukada, S., Kajikawa, Y., Tokuno, M. (2006). Load-carrying and fatigue capacity of reinforced concrete slab bridge with H-shaped steels. In Proceedings of the tenth east asia-pacific conference on structural engineering and construction. Asian Institute of Technology, Bangkok, Thailand (pp. 281–286).
Fukada, S., Kajikawa, Y., Tokuno, M. (2008). Structural behavior of reinforced concrete slab rigid frame bridge with H-shaped steels. In Proceedings of the eleventh east asia-pacific conference on structural engineering and construction. National Taiwan University, Taipei, Taiwan.
Hamad, B. S., & Mike, J. A. (2005). Bond strength of hot-dip galvanized reinforcement in normal strength concrete structures. Construction and Building Materials, 19(4), 275–283.
Iwasaki, N., & Kurita, A. (2011). Portal frame bridges in Japan: State of the art report. Structural engineering international, 21(3), 290–296.
JSCE. (2012). Standard specifications for concrete structures: Design code. Concrete Committee.
Kim, S.-H., Lee, C.-G., Davaadorj, A., Yoon, J.-H., & Won, J.-H. (2010). Experimental evaluation of joints considering of parallel perfobond ribs in steel-PSC hybrid beams. International Journal of Steel Structures, 10(4), 373–384.
Langill, T. J. (2009). Mechanical properties of hot-dip galvanized steel. Austin, Tx: Structures Congress.
Takagi, M., Nakamura, S., & Muroi, S. (2003). An experimental investigation on rigid connection of steel-concrete composite rigid frame bridge using Perfo-Bond Rib. Journal of Structural Engineering, 49A, 1063–1074.
Tokuno, M., Tsuda, K., Kajikawa, Y., & Fukada, S. (2005). Reinforced concrete slab bridge with H-shaped steels. Bridge and Foundation Engineering, 39, 49–55.
Wang, X., Zhu, B., Cui, S., & Lui, E. M. (2018). Experimental research on PBL connectors considering the effects of concrete stress state and other connection parameters. Journal of Bridge Engineering, 23(1), 04017125.
Zellner, W. (1987). Recent designs of composite bridges and a new type of shear connectors. In Proceedings of ASCE/IABSE engineering foundation conference on composite construction in steel and concrete. Henniker, New Hampshire (pp. 240–252).
Author information
Authors and Affiliations
Corresponding author
Rights and permissions
About this article

Cite this article
Nakai, Y., Ha, T.M. & Fukada, S. Structural Behavior of Reinforced Concrete Slab Rigid-frame Bridge with H-Shaped Steel Girders. Int J Steel Struct 18, 1219–1241 (2018). https://doi.org/10.1007/s13296-018-0103-1
Received:
Accepted:
Published:
Issue Date:
DOI: https://doi.org/10.1007/s13296-018-0103-1