
Abstract
In this paper, we use administrative data on tax returns to characterize the distributions of before- and after-tax income, tax liabilities and tax credits in Spain for individuals and households. We use the most recent available data, 2015 for individuals and 2013 for households, but also discuss how the income distribution and taxes have changed since 2002. We also estimate effective tax functions that capture the underlying heterogeneity of the data in a parsimonious way. These parametric functions can be used to calculate after-tax incomes in surveys where this information is not directly available, and can also be used in quantitative work in macroeconomics and public finance.
1 Introduction
This paper makes two contributions. First, we use administrative data on tax returns to characterize the distributions of before- and after-tax income, tax liabilities and tax credits in Spain. We also calculate effective average and marginal tax rates that individuals and households face. We use the most recent available data, 2015 for individuals and 2013 for households, but also discuss how the income distribution and taxes have changed since 2002. Second, we provide estimates of effective tax functions. These functions map gross incomes of individuals or households into taxes that they pay, summarizing the complicated structure of taxes in easy-to-interpret and easy-to-use parametric forms. As such, they provide valuable inputs for quantitative studies of fiscal policy in models with heterogeneous agents.Footnote 1\(^{,}\)Footnote 2 Our approach follows Gouveia and Strauss (1994), Heathcote et al. (2017) and Guner et al. (2014), who estimate tax functions of the US personal income tax. Calonge and Conesa (2003) provide estimates of effective tax functions for Spain for the early 1990s.
Our data come from an administrative dataset containing a stratified random sample of tax returns, which includes a large set of fiscal and socio-demographic information that taxpayers provide in their returns.Footnote 3 The dataset is representative of the population of Spanish taxpayers and income variables are not censored, which makes it ideal for our purposes. The dataset has both a cross section and a panel component. Repeated cross sections are available from 2002 to 2015, and they have a large sample size. The 2015 sample contains 2.7 million observations, about 14% of the population. It is not possible, however, to match household members, a husband and wife, who file individual tax returns, in this dataset. The panel dataset covers the period 1999–2013 and has a smaller sample size, but allows us to link individual tax filers from the same household, and compute taxes at the household level.Footnote 4
The key takeaways from our analysis of the data are as follows: First, the data exhibit a significant degree of inequality, in both incomes and tax liabilities. The bottom (top) quintile of the income distribution accounts for about 4.6% (47.1%) of gross income, and the share accounted for by the top 1% is about 9.5%. A similar picture emerges for households. The top (bottom) quintiles account for 4.4% (49.9%) of gross income, and the top 1% accounts for 9.7% of gross income. The Gini coefficients for individual and household gross incomes are 0.42 and 0.45, respectively. Second, given the progressive tax system in Spain, tax liabilities are even more unequally distributed. The top quintile, which accounts for 47.1% of gross income, pays about 73.2% of taxes, while the share of the top 1% in total tax liabilities is 21%. As a result, the after-tax income distribution is more equal than the before-tax income distribution. The shares of the top quintile and top 1% of taxpayers in after-tax individual income decline to 42.8% and 7.6%, respectively. The Gini coefficients for after-tax income are 0.38 for individuals and 0.40 and households. Our analysis also shows that the Gini coefficients for both before- and after-tax incomes have been fairly stable since 2002. Other measures of income inequality, such as 90-to-10 and 50-to-10 income ratios, however, did increase since the 2008 crisis. Our estimates of the household income distribution are quite similar to the ones we obtain from the Bank of Spain’s Survey of Household Finances (Encuesta Financiera de las Familias or the EFF).Footnote 5
Third, labor income constitutes the most important source of total income for most households. Even at the top quintile, it represents about 87.1% of total income. The capital and self-employment income, on the other hand, account for a more significant share of total income for the top 1% of taxpayers. About 24.1% and 12.7% of their total income come from capital and self-employment income, respectively. Interestingly, capital and self-employment incomes also account for a large share of income at the lower end of the income distribution. Fourth, we find that higher-income quintiles enjoy larger tax deductions, which lower their taxable income, and larger tax credits, which lower their tax liabilities. The top quintile, for example, accounts for 25.2% of all deductions and 28% of all credits. The same numbers for the bottom quintile are 16.1% and 4.9%, respectively. This reflects both the fact that some benefits, such as deductions due to social security contributions or due to contributions to private pension plans, are enjoyed more by richer households, and the fact that poorer households are more likely to reach quickly zero tax liabilities due to deductions and credits.
Finally, there is also a large dispersion in effective average tax rates that individuals face. About 37% of all taxpayers do not pay any taxes. Indeed, effective rates are close to zero in the two lowest quintiles. The top quintile faces an average effective tax rate of 19.0%, while the tax rate for the top 1% is 30.6%.
The tax system in Spain taxes the so-called general income, which mainly consists of labor and self-employment income, and savings income, which mainly consists of capital income, at different rates. Taxes on general income are higher and more progressive than taxes on savings income.Footnote 6 Hence, to each of these income categories certain deductions are applied and then the corresponding tax liabilities are calculated. Tax liabilities corresponding to these two categories are then summed, and tax credits are applied to the total tax liabilities to figure out what the taxpayer owes to the state. Given this structure, for the estimation of the effective tax function, we follow two different approaches. First, we estimate one single function for the final tax liabilities as a function of gross income for each year between 2002 and 2015. We focus on two different specifications: one proposed by Benabou (2002) and Heathcote et al. (2017), which we call the HSV specification, and the GS specification, used by Gouveia and Strauss (1994). In our estimation we account for the fact that low incomes are subject to zero effective tax rates, and estimate an income threshold below which tax liabilities are zero. In the second approach, we estimate three different functions: a function that relates general income to general tax rates; a second function that links the savings income to the savings tax rates; and a third function that accounts for the amount of tax credits as a function of total gross income. We show that both approaches result in tax functions that accurately estimate both the level and the distribution of the tax liabilities observed in the data. As an illustration of the use of these tax functions, we apply them to the EFF survey data and calculate after-tax incomes for each household, a variable not available in the original survey.
The rest of the paper is organized as follows. Section 2 describes the Spanish Personal Income Tax. Section 3 describes the dataset and lays out the definitions and sample restrictions. Section 4 presents the basic facts of the income and tax distributions. Section 5 presents the parametric estimates of the tax functions. Section 6 presents the basic facts of the after-tax income distributions for administrative and survey data. Section 7 concludes.
2 The Spanish personal income tax
2.1 Overview
The Spanish Personal Income Tax (PIT) or Impuesto sobre la Renta de las Personas Físicas (IRPF) taxes the income of Spanish residents.Footnote 7 Table 1 documents different sources of tax revenue for Spain, Euro Area and the OECD countries in 2015. The total tax collection with the PIT is 7.2% of the GDP and 21% of total tax revenue in Spain. It represents the second largest source of tax revenue after the social security contributions. As a fraction of GDP, Spain collects around 2.2 and 1.3 percentage points less revenue from the PIT than the Euro Area and the OECD averages, respectively.Footnote 8
The tax is withheld at source and each year, between April and June, taxpayers must file a tax return based on the previous calendar year’s total income. In 2015, all taxpayers with a labor income above €22,000, or with a capital income (excluding income from real-estate) above €1600, or with a real-estate income above €1000, or with any income from self-employment had to file a tax return. Many taxpayers below the labor income threshold, around 81% of them in 2015, still choose to file a tax return, since they are likely to obtain a refund due to tax credits. Tax returns can be filed single or jointly. Single tax returns are filed at the individual level, whereas joint tax returns can be filed by spouses or single-parent families with at least one dependent child.
Figure 1 provides a simplified version of the 2015 tax code. Income subject to the tax can be of several types: labor income, capital income (both from financial assets and real-estate) and self-employment income. From these gross income sources, a set of deductible expenses can be subtracted, which include social security contributions paid by the employee, a deduction for earning any labor income and business expenses associated with self-employment.Footnote 9 The result of this subtraction results in adjusted gross income.
Adjusted gross income is then grouped into two categories, which are subsequently taxed at different rates. The first type of income is called general income and includes labor income, self-employment income and some forms of capital income (mainly, income from real-estate).Footnote 10 The second type of income is called savings income and includes the main forms of capital income (e.g., realized capital gains, dividend payments and interest income).Footnote 11 To each type of income, a set of tax deductions are applied. Deductions that can be applied to general income include a tax deduction for couples filing jointly and contributions to private pension plans.Footnote 12 If the total deductions exceed the general income, taxpayers can apply some of the remaining deductions to the savings income. The subtraction of these deductions from general and savings income results in concepts called general taxable income and savings taxable income.

Structure of the Spanish personal income tax (2015)
General and savings taxable incomes are then taxed according to different tax schedules. The tax schedules are split into a state and a region portion, since around half of the tax revenue is transferred to the regions, which are entitled to design their tax schedules and introduce their own tax benefits.Footnote 13 In 2015, the state general tax schedule consisted of 5 tax brackets and a top marginal rate of 22.5%. The regional general tax schedule, which is applied on top of the state one, varies across regions. For example, the tax schedule in Catalonia (the largest Spanish region in terms of GDP in 2015) consisted of 6 tax brackets and a top marginal tax rate of 25.5%, whereas that of the Community of Madrid (the second largest region) has 5 tax brackets and a top marginal rate of 21.0%. Therefore, taxpayers in Catalonia faced a top marginal rate of 48% (22.5% + 25.5%), while Madrid taxpayers were subject to a top marginal rate of 43.5% (22.5% + 21.0%). The savings tax schedule is much less progressive. In 2015, the state portion consisted of 3 brackets and a top marginal rate of 11.5%, whereas the region portion, which did not differ across regions, comprised 3 brackets and a top rate of 12.0%. Figure 2 shows the tax schedules in the two selected regions in 2015.

Statutory marginal tax rates (2015)
Gross tax liabilities, which are calculated by applying state and region tax schedules to general and savings taxable income, are then reduced by a series of tax credits. First, a family allowance is subtracted from the gross tax liabilities from general taxable income. The amount of the family allowance depends on the characteristics of the taxpayer and their family, such as age, number of dependent children, number of dependent parents and disability status of the taxpayer and other family members.Footnote 14 The actual amount that is subtracted from gross tax liabilities is calculated by applying the general tax schedules to the family allowance. For example, if the total family allowance is €5500, which is below the first income threshold in panel A of Figure 2, then tax liabilities are reduced by €5500 \(\times \) 0.095 \(=\) €522.5. If the general taxable income of a taxpayer is less than their family allowance, then the extra amount of the family allowance can be used to reduce the gross tax liabilities from savings taxable income.
After subtracting the family allowance, the tax liabilities from the state general income and state savings income are pooled together. Similarly, the region tax liabilities (from general and savings income) are also added up. To these two types of tax liabilities, a set of non-refundable tax credits are applied. Non-refundable tax credits include part of mortgage payments (if the house was purchased before 2013) and an extended set of regional and state tax credits.Footnote 15 Finally, tax liabilities are further reduced by a set of refundable tax credits. In 2015, such credits were provided for employed mothers with children below 3 years old, taxpayers with disabled parents or children, single-parent families with at least two children and large families (those with 3 or more children, or 2 children when at least one of them is disabled). The amount of the tax credit given to large families is limited to €2400, while the rest cannot be larger than €1200.Footnote 16
In order to summarize the structure of taxes, let \(\mathrm{GI}_{j}\) for \(j=l,k,e\) be the gross income from labor (l), capital (k) and self-employment (e). Adjusted gross income (\(\mathrm{AGI}_{j})\) is obtained by subtracting deductions (\(D_j\)) from the gross income. Adjusted gross income from labor, capital and self-employment is then grouped together under two categories: general income (g) and savings income (s), i.e.,
and
Then another set of deductions (\(\mathrm{OD}_g\)) are subtracted from \(\mathrm{AGI}_{g}\) to obtain general taxable income:
The family allowance (\(\mathrm{FA}\)) is calculated as a function of the taxpayer and their family characteristics. The allowance pertaining to the general income (\(\mathrm{FA}_g\)) is computed as:
The gross tax liabilities that correspond to \(\mathrm{TI}_{g}\) are then calculated as:
where \(\tau _g\) is the general tax schedule.
In order to obtain the gross tax liabilities for savings income (\(\mathrm{GTL}_{s}\)), the savings-adjusted gross income (\(\mathrm{AGI}_s\)) is reduced by unused portions of \(\mathrm{OD}_{g}\) (denoted by \(\mathrm{OD}_s\)) to obtain the savings taxable income (\(TI_s=\mathrm{AGI}_s-\mathrm{OD}_s\)).Footnote 17 The family allowance pertaining to savings income (\(\mathrm{FA}_s\)) is computed as:
Then, the tax liabilities for savings income are calculated as follows:
where \(\tau _s\) is the savings tax schedule.
Finally, the two gross tax liabilities are summed and non-refundable and refundable tax credits (NTC and TC) are subtracted to obtain tax liabilities:
2.2 Recent reforms of the personal income tax (2002–2015)
The Spanish PIT has undergone several changes during recent years. In general, the taxes are reduced and increased in line with the economic expansions and downturns. The economic expansion of the early 2000s resulted in several tax cuts between 2003 and 2007. Furthermore, right at the start of the economic crisis in 2008, additional cuts were implemented in order to stimulate a slowing economy. In contrast, after 2008, the sharp fall in the GDP and the subsequent deterioration of the budget balance led to sizable tax increases between 2010 and 2012. Once again, following the recent economic recovery, significant tax cuts took place in 2015.
The first major reform of the personal income tax during the twenty-first century was in 2003. It involved a reduction in the number of tax brackets (from 6 to 5) and tax rates (the top marginal tax rate was reduced from 48 to 45%). There was also an increase in the family allowance (e.g., for a taxpayer with 2 children, by about €600), and a tax credit of €1200 on employed mothers with at least one child below age 3 was introduced. In 2007 the government implemented a big reform, which consisted of a further reduction of tax brackets (from 5 to 4) and tax rates. (The top marginal tax rates were reduced from 45 to 43%.) The family allowance was also increased (e.g., for a taxpayer with 2 children, one of them below age 3, by close to €5000) and was redefined as a general income tax credit instead of a deduction. Three other important changes were a raise in savings tax rates (from 15 to 18%), a reshuffling of tax bases, which moved many capital income items to the savings schedule, and the introduction of a tax credit of €2500 on births and adoptions. In 2008, a €400 tax credit for labor and self-employment income earners was introduced in order to spur private expenditure. Furthermore, a non-refundable tax credit for house renters was also implemented.
Between 2010 and 2012, the successive governments increased taxes or reduced deductions and credits in the context of the economic crisis and the deterioration of the budget balance. In 2010 the €400 tax benefit was eliminated and the savings tax rates were increased (from 18 to 21% for taxpayers earning more than €6000 of savings income). In 2011 the tax credit on births and adoptions was eliminated and the top marginal tax rates were increased from 43 to a range of 44.9% to 49%, depending on the region. In 2012 the government approved a significant increase of marginal rates, which affected the entire tax schedule (for instance, the top marginal rates were increased by 7 percentage points). This tax increase, which was initially intended to last for two years, was later extended until 2014. Furthermore, a deduction associated with house purchases was eliminated in 2013.
After the crisis, the government adopted a big reform. It consisted in a reduction of tax brackets and tax rates, which overturned partly the 2012 tax raise, and resulted in the tax system outlined in Fig. 2. Also, the family allowance was increased, and a set of new refundable tax credits that depend on family characteristics were introduced (such as the one accruing to large families).
3 Data
3.1 Microdata on tax returns (2002–2015)
We use an administrative dataset containing a (stratified) random sample of tax returns, which includes almost the complete set of fiscal and socio-demographic information taxpayers provide in their returns. Hence, the dataset provides a very detailed account of income from different sources, tax benefits, tax liabilities and household characteristics (number of dependent relatives, disability, location, etc.). The income and taxes paid are not censored either at the bottom or at the top of the distribution.
The unit of observation in the dataset is a tax return, which can be of two types: single or joint. As mentioned, single tax returns are filed at the individual level, whereas joint tax returns represent two spouses filing together, or single-parent families with at least one child. In joint tax returns incomes are pooled together and taxpayers are entitled to an additional tax deduction on top of those accruing to single filings (see Fig. 1). Other than this additional deduction, the computation of tax liabilities under both types of filing is almost identical. The filing status is chosen by the taxpayer. In general, joint tax returns benefit couples in which one partner earns little or no income, as well as single-parent families with dependent children.Footnote 18
The dataset has both a cross section and panel component.Footnote 19 Repeated cross sections are available from 2002 to 2015, and they have a large sample size. The 2015 cross section, for example, contains 2.7 million observations, which is around 14% of the universe of tax returns. For 2007–2010 and 2002–2006 periods, the sample size equals around 10% and 5% of the population, respectively. In these repeated cross sections, it is not possible to match household members, e.g., to match a husband and wife who file two independent single tax returns. As a result, it is not possible to study taxes at the household level.
The panel dataset covers the period 1999–2013 and has a smaller sample size (around 3.2% of the universe of taxpayers in 2013). The main advantage of the panel is that it is possible to match spouses who file single tax returns. Therefore, it is possible to compute total taxes paid by households. Furthermore, computing incomes and taxes at the household level allows us to compare the household income distribution from tax data with that obtained from survey data, such as the EFF. Below we use the cross section and the panel data to describe and estimate the tax functions for individual taxpayers and households, respectively.
Table 2 provides a comparison between the cross section sample aggregates in 2015 and their population. The data provide a very accurate representation of income and tax liabilities of the 19.5 million tax return filers, the differences being less than 1% on the selected items, except for gross income reported by the self-employed, for which the discrepancy is larger.
3.2 Definitions and sample restrictions
In this section, we explain in detail the definition of the main variables used in the paper. Specifically, we describe the different income types we account for, the characterization of tax liabilities and tax benefits and the computation of effective average and marginal tax rates.
We use three income definitions. First, gross income is the sum of labor, capital and self-employment income. Labor income comprises benefits in cash and in kind granted to individuals as employees. Capital income includes both financial income (interests, dividends, capital gains, etc.) and real-estate income. Self-employment income corresponds to the earnings of the self-employed associated with their businesses.Footnote 20 It is important to note that gross self-employment income and part of gross capital income are reported in the dataset net of some deductible expenses and tax deductions. Since we do not observe these deductions, what we call gross income is less than actual pre-tax income for these categories. This can be particularly important for the self-employed, as such deductions can be relatively high, which may lead to an underestimation of their income. For this reason, we also provide a second definition of income, adjusted gross income, where all income categories are net of deductible expenses. The third income category is taxable income, which corresponds to income subject to the application of the (general and savings) tax schedules. Note that we define also the general and savings taxable incomes, to which the corresponding general and savings tax schedules are applied.
Tax benefits can be of two types: tax deductions and tax credits. Tax deductions are amounts subtracted directly from the tax base, before the application of the tax schedules. Therefore, total tax deductions are equal to gross income minus taxable income. Tax credits, on the other hand, are amounts subtracted from the tax liabilities. Hence, they represent the difference between the amount that is calculated by the application of the tax schedule to taxable income and the final tax liabilities. Tax liabilities correspond to the amount that the taxpayer effectively has to pay, i.e., they are net of all, refundable or non-refundable, tax credits. As a result, they can be negative.
The average effective tax rates are computed as tax liabilities over gross income.Footnote 21 We also define the average effective general tax rate as tax liabilities resulting from the application of the general tax schedule net of the family allowance (the box Gross Tax Liabilities 1 in Fig. 1) over general income. We subtract the family allowance because for many (low-income) taxpayers, this is equal to the general taxable income, hence by subtracting it from the numerator we avoid an artificial overestimation of the general tax rate. (For these taxpayers, the resulting average general tax rate is zero.) Average savings tax rates are computed similarly.Footnote 22 Finally, the statutory marginal tax rates for a particular income level (or income window) are calculated as the average of the marginal rates of general and savings income, weighted by the corresponding income shares. We also calculate effective marginal tax rates as the change in tax liabilities that result from marginal changes in gross income.Footnote 23
In all calculations, we restrict the sample to taxpayers with positive total gross income, nonnegative gross income from different sources (labor, capital and self-employment) and average tax rates below the maximum statutory marginal tax rate. We do not restrict the sample by the age of the taxpayer. These restrictions only affect about 3% of all taxpayers in the sample.Footnote 24
3.3 Survey of Household Finances
As mentioned above, we compare the estimated household income distribution from the tax return data with that obtained from the Survey of Household Finances. The EFF is a survey conducted by the Bank of Spain that collects information on socioeconomic characteristics, income, assets, debts and spending of around 6000 households in each wave. Moreover, the survey oversamples high-wealth households, in order to allow for a sufficient number of observations to study the financial behavior at the top of the wealth distribution and to accurately measure aggregate wealth. The EFF is undertaken every three years, the first wave was in 2002 and the last one in 2014. Each wave accounts for annual income pertaining to the previous year. A detailed description of the survey can be found in Bover et al. (2018).
Note that households in the tax data are defined as the taxpayer and their spouse, i.e., excluding other members of the household filing a tax return. Therefore, in order to compare the income aggregates between the tax and the survey data, we construct two household definitions in the EFF. The first is denoted “fiscal household” and adds up the gross income of the household’s reference person and their spouse. Note that the EFF provides information for each household member on labor and self-employment income items. The capital income items are, however, reported for the whole household. We assume that all capital income belongs to the household’s reference person (even if a particular asset could belong, e.g., to an elderly living with the reference person).Footnote 25 Note also that we classify the income sources provided by the EFF so as to mimic the labor, capital and self-employment groups defined in the tax data.Footnote 26 Second, we construct a larger household definition encompassing all the household members, which we denote by the term “whole household.”
As with the tax data, we restrict the sample to households earning positive gross income and nonnegative gross income from all sources (labor, capital and self-employment).Footnote 27 This amounts to dropping around 2% of the households.
4 Basic facts of the income and tax distributions
In this section, we report basic facts on income, tax liabilities and tax benefits for samples of individuals in 2015 and households in 2013. Moreover, we compare the results for the households with those obtained from the EFF.
4.1 Income distribution
4.1.1 Individuals
Table 3 summarizes how different notions of income are distributed among individuals in 2015. The inequality in gross incomes is significant. The top quintile accounts for about 47.1% of total gross income, while the bottom quintile’s share is only 4.6%, a ratio of 10 to 1. The income share of the top 1%, a popular measure of income inequality, is about 9.5%. This is lower than other big euro area countries, such as Germany (11.1%) and France (10.8%), and it is much smaller than what we observe in Anglo-Saxon economies (12.8% in the UK and 20.2% in the USA). Nevertheless, it is higher than the top 1% income share in Scandinavian countries (for example, Sweden is 8.8% and Norway is 8.5%) and in Italy (7.3%).Footnote 28
When we move to adjusted and taxable incomes in Table 3, the share of higher quintiles increases. For example, the share of income accounted for the top 20% increases from 47.1% of gross income, to 51.0% of adjusted gross income and 51.4% of taxable income. Likewise, both the income share of the top 1% and the Gini coefficient increase as we move from gross to taxable income. This is not surprising, since most of the taxes are paid by richer households. Indeed, for many taxpayers at the bottom quintile (about 20% of them), taxable income becomes zero once deductions are applied to their gross income.
Finally, columns (4) to (6) of Table 3 show the distribution of income from different income sources. The capital and self-employment income are much more unequally distributed than the labor income. The capital income renders a higher degree of concentration at the bottom and top quintiles, when compared to gross income. For example, the bottom 20% accounts for just 4.6% of gross income, while it accumulates 5.4% of capital income; the top 1% accumulating 9.5% and 32.7%, respectively. Self-employment income is also concentrated at the very top, but the lower end of the income distribution accumulates a substantial amount as well.
Table 4 presents another look at the income distribution in the data. For gross income, it reports the income cutoffs for different percentiles of the distribution (column 1). It also reports average gross incomes and average incomes from different sources at different points of the income distribution (columns 2 to 5). It is worth noticing that there are only a small number of taxpayers that report relatively large incomes in their tax returns, which would put them in higher-income brackets (see Fig. 2). Average individual gross income in the data is about €24,000. Hence, 80% of households report gross incomes that are below the mean gross income. Indeed, 99% of taxpayers report total gross income below €105,000 (about 5 times the mean income). Also, columns (2) to (5) show that average income levels across income sources are low. For instance, the top 1% earns on average slightly above €120,000 of labor income, while average self-employment income of the top 95–99% of taxpayers is just €5000.Footnote 29\(^{,}\)Footnote 30
In Table 5 we decompose the sources of income across the income distribution. As columns (1) to (3) show, labor income is by far the largest source of income. Its importance increases monotonically from quintiles 1 to 4, where it represents between 80% and 90% of total income. In the top decile income from labor is less important; although even for the top 1% the share of labor income is very high, close to 65%. In the lowest end of the distribution, especially in the bottom 1%, capital income appears very significant, although this reflects the very low-income levels of this group (see Table 4). Excluding the lowest quintile, capital income accounts for around 6% to 9% of gross income, reaching 24.1% for the richest taxpayers. Self-employment income accounts for 7.8% of gross income in the second quintile, while it drops to around 4% to 6% for richer individuals. At the top of the distribution it accounts for slightly more than 12% of total income. In columns (4) and (5), we show the decomposition of gross income between general and savings income. While general income is by far the largest income source, for taxpayers in the top 1% income taxed under the savings scale is significant, reaching on aggregate 30% of total income.
4.1.2 Households
In Table 6 we compare the household income distribution in 2013 computed from the tax data and from the EFF. Regarding the latter, the column (2) depicts the income distribution under the fiscal household definition (the household head and their spouse), whereas the column (4) shows the distribution under the whole household definition (all the household members). We find that the EFF and the tax data provide very similar estimates of the income distribution, especially if one focuses on the fiscal household definition of the EFF. For example, income of the top 20% amounts to around 50% in both the tax and the survey data, while the bottom 20% receives around 5% of earnings. In general, the discrepancies between the tax and the survey data tend to be larger at the top of the income distribution. For example, the EFF seems to underpredict the share of income accruing to the top 1% by 1.7 percentage points. If one focuses on the income accruing to all household members (whole household definition), depicted in column (4), the differences between the tax and the survey data tend to be larger.
4.2 Tax rates and tax liabilities
In Table 7 we summarize the distribution of tax liabilities and tax rates. In columns (1) and (2), we also depict the corresponding distributions of gross income and taxable income (already shown in Table 3), in order to illustrate the progressivity of the tax code. While the top quintile accounts for 47.1% of gross income, it pays around 73% of total tax liabilities. Similarly, the top 1% accounts for 9.5% of gross income, but pays about 21% of total taxes. As a matter of fact, close to 93% of tax payments are concentrated in the top 40%, while the bottom two deciles account for only 0.5% of the tax.
The high concentration of tax liabilities is reflected in the small average tax rates at the lower end of the income distribution and the larger rates at the upper end, which average 19.0% in the top quintile and 30.6% in the top 1%. Average statutory marginal tax rates are also highest for richer individuals, reaching almost 40% for the top 1%, while they are significantly lower as we move down the income distribution.

Individual effective average and marginal tax rates (2015)
These averages hide a substantial degree of heterogeneity across individuals. Panel A of Fig. 3 depicts the average effective tax rates across different multiples of mean gross income, together with 2 standard error bands.Footnote 31 As can be seen, there is wide variation of tax rates even for individuals with the same gross income, being this the result of different family characteristics and tax benefit entitlements. The shape of this curve is what the parametric estimates of Sect. 5 are meant to approximate.Footnote 32
In panel B of Fig. 3, we represent the corresponding curves of statutory and effective marginal tax rates. The figure shows that marginal rates increase rapidly with income, but stabilize at around 3 times mean income (€75,000) and start to decline linearly at a slow rate. The set of tax benefits renders the effective curve below the statutory one, being the difference roughly about 4 percentage points on average.
Figure 4 highlights two key features of the distribution of tax liabilities and taxes in Spain. First, a significant share of individuals face a zero effective tax rate, around 37% of all taxpayers in 2015. The panel A shows that until about 45% of mean income (€11,000), the percentage of taxpayers facing positive rates is only about 10%. The share increases steeply afterward, and by 90% of mean income (€22,000) more than 90% of taxpayers pay taxes, with the share of positive tax liabilities converging to 100% as income increases. As we detail below, this feature of the tax will be important in the parametric estimates of effective tax functions. Second, most taxpayers are concentrated on relatively low-income levels. The panel B of Fig. 4 shows the share of tax returns in each income bin and the effective tax curve already plotted in panel A of Fig. 3. While the effective tax rates increase from 0 to about 30%, most taxpayers face much lower rates. For about 75% of all taxpayers, the effective tax rates are below 15% (the sum of the first 3 bars in Fig. 4). As a result, while most discussion on tax increases and tax cuts focus on top marginal rates, for a great majority of households, the relevant tax rates are much lower.Footnote 33
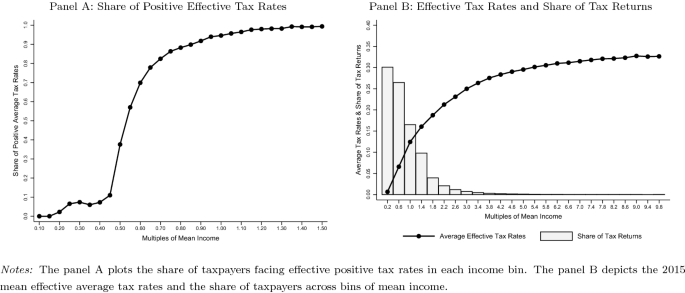
Effective tax rates along the income distribution (individuals 2015)
4.3 Tax benefits (deductions and credits)
We next turn to the distribution of tax benefits. In Table 8 we describe the distribution of the most important tax deductions, which, as we mentioned in Sect. 3.2, are tax benefits that reduce directly the tax base. Table A.4 in the online appendix documents the importance of different deductions for taxpayers at different points in the income distribution as well as for all taxpayers (the last row). When we consider the aggregate, the most important tax deduction is the one granted to labor income earners, which accounts for about 63% of total deductions. It is followed by social security contributions paid by the employees (20%), the tax benefit associated with joint tax returns (10%) and the contributions to private pension plans (4%). There are, however, differences in the importance of these deductions along the income distribution. For instance, the deduction for contributions to private pension plans accounts for 27% of all tax deductions for the top 1% of taxpayers, while it represents less than 2% for the first two quintiles.Footnote 34
The top quintile benefits from more than 25% of the total tax deductions, while the bottom quintile receives around 16% (see the first column of Table 8). This reflects the fact that two important deductions, those associated with private pension plans and social security contributions, benefit mostly the top two quintiles. The top quintile, for example, got 71.5% of benefits associated with private pensions and 41% of benefits associated with social security contributions. Furthermore, the tax base of many low-income earners goes to zero after making use of some tax benefits, hence exhausting the possibility of further deductions.
Tax credits, as mentioned in Sect. 3.2, correspond to tax benefits that are subtracted directly from the tax liabilities. Table 9 depicts their distribution across income groups, and Table A.5 in the online appendix shows their relative importance for different income groups. By far the family allowance is the largest tax credit, representing more than 95% of these benefits for the bottom 20% and more than 80% for the top 20%. Next is the tax credit associated with house purchases, that granted to employed mothers, large families and a battery of region-specific tax credits.Footnote 35
As for the distribution of these benefits, the family allowance is evenly distributed, since it depends solely on family characteristics. Note that the smaller share accruing to the lower end of the income distribution is explained by the exhaustion of tax liabilities as a result of the application of (part of) this allowance. On the contrary, the tax credits associated with house purchases and large families benefit the richer individuals, whereas benefits granted to employed mothers and the set of region-specific benefits go mainly to the middle of the income distribution.
5 Parametric estimates
In this section, we present the estimated effective average tax functions. We proceed as follows. First, we show the estimates of the average and marginal tax rate functions for individuals in 2015. Second, we present an alternative approach and estimate separate parametric functions for the different components of income (general income and savings income), as well as for tax credits, which we refer to as the three-function approach. Most of our analysis focuses on single tax functions that map gross incomes to tax liabilities. Besides its simplicity, this approach provides estimates that can be compared with available estimates for other countries. Furthermore, division of general and savings income in Spanish tax code does not easily lend itself to notions of capital and labor income in macro models, since some forms of capital income, e.g., rents from real estates, are lumped together with more standard forms of labor income.
Third, we present an evaluation of all the estimated functions by their capacity to predict the amount and the distribution of tax liabilities. Fourth, we account for changes in taxes over time by providing estimates of the tax functions for individuals between 2002 and 2015. Finally, we estimate functions for households in 2013.
5.1 Effective tax functions of individuals in 2015
In order to account for the fact that a significant number of Spanish taxpayers face a zero tax rate (panel A of Fig. 4), we estimate:
where t is the average tax rate, \(\widetilde{I}\) stands for multiples of mean gross income, \(\bar{I}\) is the income threshold, chosen so as to minimize the mean-squared error and \(f(\widetilde{I})\) is a parsimonious nonlinear function. Following Guner et al. (2014), we consider two possible specifications of f: The HSV specification, used by Benabou (2002) and Heathcote et al. (2017):Footnote 36
and the GS specification, used in Gouveia and Strauss (1994):
Note that in this case \(\widetilde{I}\) is replaced by I, i.e., by the income level.Footnote 37
Table 10 shows the parameter estimates.Footnote 38 In general, the parameters are estimated with a high degree of precision. The income cutoffs are estimated between 49% and 55% of mean income for individuals in 2015 and between 36% and 42% of mean income for households in 2013.
In panel A of Fig. 5, we plot the estimated average tax rates resulting from the specifications together with the data. The observed average tax rates show a steep increase at lower income levels and then flatten out at the right-end of the income distribution. Using the OECD tax and benefit calculator, Holter et al. (2018) estimate HSV effective tax functions for a group of OECD countries. Their estimate of \(\tau \) for Spain is 0.148 (close to our estimate in Table 10). Their results imply higher levels of \(\tau \), i.e., higher degrees of progressivity, for most European countries, e.g., 0.18 for Italy, 0.2 for the UK, 0.22 for Germany and Sweden and 0.26 for Denmark.Footnote 39

Effective tax functions (individuals 2015)
From equation (2), the marginal tax rate of the HSV specification is given by:
while from equation (3) we can derive the marginal tax rate function of the GS specification as:
Using the parametric estimates depicted in Table 10, the panel B of Fig. 5 shows the resulting marginal tax rate functions, as well as the data. The data for marginal tax rates correspond to effective marginal tax rates. As mentioned in Sect. 4.2, effective marginal rates increase rapidly and flatten out at a certain income level. This last feature is well accounted for by the shape of the GS function. On the other hand, marginal tax rates under this specification increase and flatten too quickly compared to the data. At around 5 times mean income, the marginal tax rates are 33.5% under the GS specification, while they are 36.8% in the data. In contrast, for 1.5 times mean income, the GS tax function overestimates the marginal tax rates by around 3.5 percentage points. On the contrary, the HSV tax function captures the marginal tax rates very well up to 4 times mean income. After 4 times mean income, however, the marginal tax rates keep increasing under the HSV function, while they are flat in the data. By 5 times mean income, for example, the marginal tax rate under the HSV function is about 3 percentage points higher than the data.
Overall, the HSV function fits well the tax rates of the well-off, but it is unable to capture the near constant marginal tax rates at very high-income levels, which leads to an overestimation of taxes paid by the very rich. On the contrary, the GS function tends to under estimate the average tax rates, yet it captures very well the flattening out of tax rates.Footnote 40\(^{,}\)Footnote 41
5.2 Three-function approach
In this section, we provide an alternative approach to parameterize the Spanish Personal Income Tax. We estimate three different functions that connect income from different sources (general vs. savings) to the tax liabilities. Specifically, we estimate a function that relates general income with general tax rates; a second function that links the savings income to the savings tax rates; and a third function that accounts for the amount of tax credits as a function of total gross income. In this way, starting from gross income by income source, the final tax liabilities of the taxpayer can be easily estimated by going through each of these functions. It must be noted that one advantage of this three-function approach is that it allows simulating more detailed reforms, such as a change in capital tax rates.
For the general tax rate function, we pose the same functional form as in the effective tax function estimated in Sect. 5.1, i.e., that described in equation (1). We follow this approach given that the shape of general tax rates resembles that of effective tax rates. We estimate this function under the two specifications HSV(equation 2) and GS (equation 3). Note that in this case t stands for the average general tax rate, \(\widetilde{I}\) for multiples of mean general income and I for the general income level.Footnote 42
Regarding the savings tax rates (panel B of Fig. 2), we estimate the following linear function with a kink:
where \(t_s\) is the average savings tax rate, \(\widetilde{I_s}\) stands for multiples of mean savings income, \(\kappa \) is the sample mean of the savings tax rate if \(\widetilde{I_s}\ge \bar{S}\), and \(\bar{S}\) is again chosen so as to minimize the MSE.
Finally, for the tax credit function, we follow Guner et al. (2017) and estimate the following Ricker model:
where c stands for total tax credits as a fraction of gross income and \(\widetilde{I}\) refers to multiples of mean gross income.Footnote 43\(^{,}\)Footnote 44
The three estimated functions are depicted in Fig. 6, while the parametric estimates are shown in Table 11. The panel A of the figure indicates that both the HSV and the GS specifications capture well the shape of the general income tax function. In panel B, also, it becomes apparent that the shape of the savings income tax function is well approximated by a piecewise functions of the form estimated, where the tax rate increases linearly and flattens out at around 13 times mean savings income. Finally, tax credits seem to benefit more, as a fraction of gross income, taxpayers earning around mean income. From that point on, the incidence of tax credits diminishes until it converges at around 0.62% of gross income. This shape is decently captured by the model proposed, yet the tax credits of the right-end of the income distribution are overstated, see the panel C.

Parametric functions: three-function approach (individuals 2015)
5.3 Evaluation of tax functions
How well do these functions capture the level and the distribution of tax liabilities? In this section, we provide an assessment. In the first column of Table 12, we depict the distribution of tax revenue by income quantile in the data. The remaining columns show the percentage deviation of the estimates from the data. We can see that the tax functions approximate quite well total tax collection, except the HSV specification of the single-function approach, which tend to overpredict it. For example, both specifications in the three-function approach render a deviation of less than 1.5%, while the GS function in the one-function approach underestimates total revenue by less than 1%. As already observed in Fig. 5, the fact that this function converged to a top marginal tax rate below the one observed in the data leads to an underprediction of taxes paid by the top 1%, although the revenue raised by the top 20% is well accounted for. In contrast, the ever-increasing top marginal tax rate of the HSV function results in an overprediction of taxes paid by the 20% and 1% richest taxpayers in the one-function approach.
Table 13 provides a comparison in terms of the percentage point difference of the distribution of tax liabilities along the income distribution. As noted earlier, most tax revenue is accounted for by the top 40% (see the first column), a degree of progressiveness that is well captured by the tax functions. Also, as noted before, the main challenge is to account for the average rates of the very rich. In this regard, it is worth noting that the differences are reasonably small, being lower than 1.5 percentage points in all specifications, except the HSV function in the one-function approach.
5.4 Changes in effective tax rates since 2000
In panel A of Fig. 7, we plot the average tax rates (normalized with respect to average income) from the repeated cross sections of the data for a selection of years. We can see that the narrative account of the most significant policy actions adopted during 2002 to 2015 (see Sect. 2.2) helps to interpret the changes in the tax curves. First, the 2003 tax cut implied a significant drop in average tax rates with respect to 2002. Second, the tax cuts during the expansion led to further downward movements of the tax curve, see the 2007 function. Third, the 2010-2011 tax increase placed average tax rates above the levels observed in 2003, while the sharp increase in marginal taxes in 2012–014 moved the curve upward across the whole income distribution, rendering the highest rates during this period. And finally, the 2015 tax cut reversed partially the tax increases implemented during the crisis.Footnote 45 Appendix Figure A.5 displays the estimation of the GS (panel A) and HSV functions (panel B) for each year, while Table A.7 reports the parameter estimates.

Overtime evolution of average tax rates (2002–2015)
5.5 Effective tax functions for households in 2013
The second column of Table 10 provides the parameter estimates of the tax function faced by households in 2013, while Fig. 8 gives a graphical representation. The panel A of the figure shows that both the HSV and GS functions track very accurately the shape of average taxes along the income distribution. Furthermore, in regard to differences by marital status, the panel B shows that the HSV specification tends to overestimate the marginal tax rates of the richest single households, which comprise around 45% of all households, while both functions are able to capture well the tax curve of married households (see panel C).Footnote 46

Effective average tax rates: data and functions (households 2013)
6 After-tax income
In this section, we provide a brief account of after-tax income in both the tax and the survey (the EFF) data. This allows us to evaluate the progressiveness of the tax code, by comparing gross income and after-tax income figures. Note that in the survey data after-tax income is not observed. For this reason, we use the tax functions to estimate, given gross income, the tax liabilities faced by the household, as we explain below. After-tax income, in both the administrative and survey data, is computed as gross income minus tax liabilities.
Starting with the tax data, columns (1) to (4) of Table 14 illustrate the progressiveness of the tax code, by depicting the distribution of gross and after-tax income, for both individuals and households. It is worth noting that after-tax income is substantially less unequal than gross income. The Gini coefficient, for instance, declines by about 4 to 5 percentage points (from 0.42 to 0.38 for individuals and from 0.45 to 0.40 for households), and the 90th to 10th percentile ratio is reduced from 7.31 to 6.00 for individuals and from 7.89 to 6.50 for households. Along the income distribution, the income share of the top 20% gets reduced by around 4 percentage points as a result of the tax, while the rest of quintiles experiment an increase in their income share.
In columns (5) to (8) of the same table, we present the after-tax income distribution estimated in the survey data. We show the results for the two household definitions: fiscal household (comprising the reference person and their spouse, in columns 5 and 6) and whole household (comprising all household members, in columns 7 and 8). As mentioned above, the EFF provides income solely in gross terms. Hence, we make use of the estimated GS function from the tax data to approximate the tax liabilities faced by each household in the survey and then compute after-tax income. For the definition of fiscal household, we apply the household tax function. For the whole household definition, we apply the household tax function for the reference person and their spouse, the individual function for the remaining household members, and then we aggregate each member’s after-tax income at the household level. We find that the estimated after-tax income distributions in the survey data are able to capture the shift from the gross to net income distribution that we observed in the tax data. Specifically, the first four quintiles experience an increase in their income share, while the top 20% undergoes a reduction, the magnitude of the changes being similar to those observed in the tax data.Footnote 47 Hence, the application of the tax functions to the survey data can provide a fruitful approach to analyze after-tax income in this type of datasets, even if the actual information is missing.
In Tables 15 and 16 we report how gross and after-tax income inequality have changed in recent years. In the individual data the Gini coefficient remains relatively stable during the sample period, while there is an increase of the 90th to 10th and 50th to 10th percentile ratios in the wake of the financial crisis, suggesting larger inequality within taxpayers. This increase can be explained by the evolution of income shares along the income distribution, which are depicted in Tables A.10 and A.11 in the online appendix. In this respect, it is worth noting the income share decline of the bottom 20% of taxpayers. Regarding the household tax data, while overall inequality, as captured by the Gini index, seems to have increased in the run-up to the crisis and decreased thereafter, the percentile ratios show somewhat the opposite trend, see Table 16.Footnote 48
In Table 17 we depict the evolution of the household gross income distribution as computed from the different waves of the EFF. They point to a rather stable distribution, at least with respect to the selected inequality indices. Tables A.14 and A.15 in the online appendix show the corresponding evolution in the gross and after-tax income shares, respectively. Interestingly, the overtime pattern is comparable to that found in the tax data (see Tables A.12 and A.13). Regarding gross income, the income share of the top 20% in the survey data experienced an increase in the run-up to the financial crisis, and a drop thereafter, while the following 20% followed the opposite pattern. With respect to after-tax income, the evolution, as estimated with the GS function, points toward larger income shares of the top 1% during 2004–2007 and a large contraction during the financial crisis, while the top 20% underwent a decrease in its income share in 2010–2013. Regarding the middle of the income distribution, it renders a rather stable path, with some gains for the fourth quintile at the end of the sample period.Footnote 49
7 Conclusions
In this paper, we exploit a rich uncensored administrative dataset of tax returns for the years 2002 to 2015 to present key facts about the Spanish Personal Income Tax system. We focus on the distribution of gross income and its sources, taxable income, tax benefits, tax liabilities and after-tax income, as well as effective average and marginal tax rates. We do so for individuals and for households, defining the latter as either joint declarations or as two individual declarations from the same household and differentiate between single and married. We also briefly review how the PIT legislation and the effective tax rates have changed during the period of the analysis.
A second contribution of the paper is the estimation of parametric functions of the effective average tax rates that can be readily used in applied work. We follow two different approaches. First, we estimate a single expression for the final tax liabilities as a function of gross income. Second, we estimate three different functions, one for the general tax rates that apply to the general taxable income, one for the savings tax rates, applied to the savings taxable income, and one for the tax credits. Both approaches generate a distribution of tax liabilities that is very close to the one we observe in the data.
Notes
Heathcote et al. (2009) and Krueger et al. (2016) provide recent reviews of this literature. For quantitative macro studies on the Spanish tax and transfer system, see, among others, Rojas (2005), González and Pijoan-Mas (2006), Díaz-Giménez and Díaz-Saavedra (2009), Sánchez Martín and Sánchez Marcos (2010), Díaz-Giménez and Díaz-Saavedra (2017) and Guner et al. (2018).
An alternative is the microsimulation approach that simulates the incidence of tax reforms on a representative sample of taxpayers. Microsimulation models can be either non-behavioral or behavioral. Non-behavioral ones are accounting models that simply simulate the taxpayers’ tax liabilities taking into account the design of the tax code (e.g., statutory rates, tax benefits, etc.). As such, they ignore the response of individuals to the tax changes, e.g., changes in the labor supply that might result from changes in taxes. While behavioral models rely on an accounting model, which computes net incomes under different choices and tax structures, they also contain behavioral microeconometric models that allow for such responses. The microsimulation approach can be used to estimate the consequences of very detailed tax reforms, since the accounting model provides an in-depth characterization of the tax code. However, this type of evaluations is usually carried out in partial equilibrium, since the exhaustive depiction of the tax system is difficult to integrate in macro models featuring general equilibrium. See Labeaga et al. (2008) for an evaluation of personal income tax reforms in Spain under a behavioral microsimulation approach and Peichl (2016) for a discussion of the linking between microsimulation and computational general equilibrium models.
The data cover 15 Spanish regions and 2 autonomous cities (Ceuta and Melilla). Two Spanish regions, the Basque Country and Navarre, have their own independent tax collection authority and are not included in the dataset.
Based on the same data, Haugh and Martínez-Toledano (2017) analyze the income distribution, taxes and tax benefits for the period 2002–2011. They assess differences in such distributions by gender and province and focus on changes before and after the economic crisis.
Anghel et al. (2018) provide an analysis of changes in income, consumption and wealth distribution in Spain in recent years.
López-Laborda et al. (2018) discusses how this dual tax system creates incentives for the taxpayers to shift their income base from labor to capital.
Income subject to the PIT corresponds to worldwide income, although a number of bilateral agreements eliminate double taxation.
There are two deductions for earning labor income. First, all taxpayers are eligible for a €2000 deduction. Second, an additional deduction of up to €3700 is given to taxpayers whose labor income is below €14,450. These quantities are further increased for some groups of taxpayers, such as disabled workers, or unemployed who had moved to a different location in order to start a new job.
Other forms of capital income that are in general income include incomes that come from the participation in common property regimes and other civil associations, such as unsettled estates or communities of property owners.
In 2015, savings income covered slightly more than 60% of total capital income.
In 2015, the deduction on couples filing jointly amounted to €3400, while the limit on contributions to private pension plans was set to €8000.
In practice, the Spanish system of regional financing is complex, see de la Fuente (2010) for a detailed description. Roughly speaking, regions keep 25% of their tax collection and either receive or contribute money in net terms from two funds aiming at ensuring sufficient financing for each region and a homogenous provision of public services deemed essential, such as health and education. Regions can also raise money from financial markets by issuing debt.
In 2015, this allowance was €5550 for the taxpayer (€6700 and €6950 for taxpayers older than 65 and 75, respectively), plus €2400 for the first child, €2700 for the second, €4000 for the third, etc; plus €1150 for each dependent parent older than 65 and €1400 for each dependent parent older than 75; plus €3000 for each disabled member of the household (€9000 euro for severe disabilities). Furthermore, the allowance for children is increased if they are less than 3 years old. Also note that regions can modify these amounts.
The region-specific tax credits, which can be means-tested, include credits for taking care of disabled or elderly, births, adoptions, large families, school expenses, donations, housing expenses, etc. Other state tax credits are granted to, among others, charity donations and renters earning income below a certain threshold. The state tax credit for renters has been phased out since 2015.
The most important refundable credit is the one provided to employed mothers with children below 3. In 2015, close to 750,000 women received it, which represented close to 4% of the total number of tax returns, being granted around €935 on average. The refundable tax credit granted to large families comes next, which accrued to close to 500,000 taxpayers (2.6% of the total) and amounted to €945 on average.
In practice, only certain elements of \(\mathrm{OD}_g\) can be used in \(\mathrm{OD}_s\).
In 2015, single tax returns accounted for close to 80% of the total, while the remaining were joint tax returns.
The datasets are named Muestra IRPF IEF-AEAT (Declarantes) and Panel IRPF 1999/2013 IEF-AEAT (Declarantes). They are administered by the Instituto de Estudios Fiscales (http://www.ief.es/), a research institute within the Ministry of Finance and Civil Service. A detailed description (in Spanish) and some statistics are provided every year in the working paper series of the Instituto de Estudios Fiscales (https://goo.gl/1Nyota). For example, see Pérez López et al. (2018) for a description of the 2015 cross section wave.
It also includes any income of employees (wage and salary earners) who set up an economic activity to generate income.
If the tax liabilities are non-positive, then we set the tax rate to zero. Note that we could also compute tax rates as the ratio of tax liabilities to adjusted gross income. We favor the broader definition of income to compute average tax rates and total tax deductions.
According to the 2015 tax code, the boxes (in Modelo 100) corresponding to each definition are the following. Gross income: 10 (labor) + 33 + 43 + 70 + 71 + 212 + 213 + 214 + 215 + 216 + 235 + 240 + 244 + 250 + 366 + 370 (capital) + 125 + 150 + 180 (self-employment). Adjusted gross income: 22 (labor) + 37 + 47 + 70 + 71 + 212 + 213 + 214 + 215 + 216 + 235 + 240 + 244 + 250 + 366 − 376 − 379 − 378 + 370 − 382 − 383 − 384 − 385 − 387 − 388 − 389 − 390 (capital) + 125 + 150 + 180 (self-employment). Taxable income: 440 (general) + 445 (savings). General income: 10 + 43 + 70 + 71 + 125 + 150 + 180 + 212 + 215 + 216 + 235 + 240 + 244 + 250 + 366. Savings income: 33 + 213 + 214 + 370. Tax liabilities: 532 − 546 − 557 − 572 − 588 − 590. Average effective general tax rate: \(\frac{\text {476 + 477}}{\text {general income}}\). Average effective savings tax rate: \(\frac{\text {484 + 485}}{\text {savings income}}\).
Specifically, we follow Guner et al. (2014), Section 6. For each income level \(y_0\), represented as a ratio of income over mean income, the marginal tax rate is approximated as the average of the variation in tax liabilities when income increases to \(y_0+\Delta y\) and when income decreases to \(y_0-\Delta y\), with \(\Delta y=0.4\). Below we compute effective marginal rates from income levels ranging 0.2 to 9.8 in steps of 0.4.
Table A.1 in the online appendix shows that the average income and other characteristics of the restricted sample do not differ significantly from those of the universe of taxpayers.
Note that since we focus on aggregate household income, it is irrelevant for two-person households to assign capital income to the reference person, their partner, or to split it between the two.
According to the 2014 EFF wave, we define gross income as: \(\sum _{i}\) (p6_64_i + p6_66_i + p6_68_i p6_70 + p6_74b_i + p6_74_i) + p6_75d1 + p6_75d3 + p6_75d4 (labor) + \(\sum _{i}\)p6_72_i (self-employment) + p7_2 + p7_10 + p7_12 + p7_12a + p7_14 + p7_4a + p7_4b + p7_6a + p7_6b + p7_8a + p7_8b + p6_76b + p6_75f (capital), where i indexes each household member (the reference person and their spouse in two-person households and the former in one-person households).
Notice that under the two household definitions we impose this rule on the added income of the reference person and their spouse. Additionally, for the case of “whole households” we apply the restriction on each household member. Hence, if he/she does not fulfill the restriction, it is excluded from the household.
The numbers are from the World Inequality Database (https://wid.world/) for the year 2015, except for France and the USA, whose data pertain to 2014. For an analysis of top incomes in Spain, see Alvaredo and Saez (2014). Martínez-Toledano (2017) provides estimates on the concentration of wealth in Spain.
Note that self-employment income is net of deductible expenses associated with the business activity, see Sect. 3.2. As a result, the figures might underestimate the actual pre-tax income from self-employment.
As we document in Tables A.2 and A.3 in the online Appendix A, Tables 3 and 4 change very slightly if we restrict the sample to ages 16–64, and, as a result, eliminate retired taxpayers who might potentially have low incomes. The threshold for the top 1% of labor income earners, for example, increases to €132,948.
Note that mean individual gross income in 2015 was €24,291, while household mean income in 2013 amounted to €30,839.
Figure A.1 in the online appendix shows that median tax levels are almost identical to mean tax levels up to 4 times mean income (about €100,000) and slightly higher above that.
See Guner et al. (2018) for a quantitative analysis of how higher tax rates on top incomes affect the total tax collection in Spain.
Ayuso et al. (2019) estimate the savings effect of the introduction of this deduction in 1988. They show that when this policy was introduced, most contributions to pension funds were made by older and high-income individuals, who had the largest marginal potential gains. Since 1988 the policy becomes very popular. In 2015, close to 15% of taxpayers had some contribution to pension plans.
The tax credit associated with house purchases was stopped in 2013, so that it only benefits transactions carried out before that year.
In the HSV specification, \(\lambda \) determines the average taxes while \(\tau \) determines the progressivity. When \(\tau =0\), taxes are flat and equal to \(1-\lambda \). When \(\tau >0\), taxes are positive, and higher levels of \(\tau \) imply a greater degree of progressivity.
Guner et al. (2014) consider also two other specifications: a log specification (\(f(\widetilde{I}) = \alpha + \beta \text {log}(\widetilde{I})\)) and a power specification (\(f(\widetilde{I}) = \delta + \gamma \widetilde{I}^\epsilon \)). These functions perform worse for the Spanish data than the HSV and GS specifications. The estimates are available upon request.
These functions are estimated by NLS. Following Guner et al. (2014), we divide I by 1,000 when estimating the GS function. Figure A.2 in the online appendix shows the mean-squared error of the HSV and GS specifications, as a function of \(\bar{I}\).
For the OECD tax and benefit calculator, see: http://www.oecd.org/els/soc/benets-and-wages/tax-benet-webcalculator/.
Regarding the tax functions of individuals by marital status, we found no remarkable differences between taxes paid by single and married individuals, see Figure A.3 in the online appendix.
As we show in the online Appendices A and B, when we restrict the sample to taxpayers between ages 16-64, we get very similar results, see Table A.6 and Figure A.4.
Mean general income in 2015 was €22,805, whereas mean savings income was €1486.
Note that total tax credits are computed net of the family allowance, since the latter is subsumed in the computation of the general tax rate, see the definition thereof in Sect. 3.2. Also, note that the general tax rate function and the tax credit function are estimated by NLS, while the savings tax rate function is estimated by OLS. In the estimation of the tax credit functions, we exclude a few observations whose tax credits are larger than their gross income.
The picture encompassing the full set of years as well as the parameter estimates is available upon request.
Table A.8 in the online appendix depicts the parameter estimates.
Note that the HSV function provides comparable results, see Table A.9 in the online appendix.
See also Tables A.12 and A.13 for the evolution of household gross and after-tax income shares during the sample period, respectively.
Using the HSV delivers similar results, see Table A.16 in the online appendix.
References
Alvaredo F, Saez E (2014) Income and wealth concentration in Spain from a historical and fiscal perspective. In: Atkinson AB, Piketty T (eds) Top incomes: a global perspective. Oxford University Press, Oxford
Anghel B, Basso H, Bover O, Casado JM, Hospido L, Izquierdo M, Kataryniuk IA, Lacuesta A, Montero JM, Vozmediano E (2018) Income, consumption and wealth inequality in Spain. SERIEs J Span Econ Assoc 9:351–378
Ayuso J, Jimeno JF, Villanueva E (2019) The effects of the introduction of tax incentives on retirement savings. SERIEs. https://doi.org/10.1007/s13209-019-0195-7
Benabou R (2002) Tax and education policy in a heterogeneous agent economy: What levels of redistribution maximize growth and efficiency? Econometrica 70:481–517
Bover O, Crespo L, Gento C, Moreno I (2018) The Spanish survey of household finances (EFF): description and methods of the 2014 wave. Banco de España Occasional Paper N. 1804
Calonge S, Conesa JC (2003) Progressivity and effective income taxation in Spain: 1990 and 1995. Working Paper, Centre de Recerca en Economia del Benestar, Barcelona
de la Fuente A (2010) El nuevo sistema de financiación regional: un análisis crítico y proyecciones para 2009. Hacienda Pública Española/Rev Public Econ 195:91–138
Díaz-Giménez J, Díaz-Saavedra J (2009) The future of Spanish pensions. J Pension Econ Finance 16:233–265
Díaz-Giménez J, Díaz-Saavedra J (2017) Delaying retirement in Spain. Rev Econ Dyn 12:147–167
González M, Pijoan-Mas J (2006) Flat tax reforms: a general equilibrium evaluation for Spain. Investig Econ 30:317–351
Gouveia M, Strauss RP (1994) Effective federal individual income tax functions: an exploratory analysis. Natl Tax J 47:317–339
Guner N, Kaygusuz R, Ventura G (2014) Income taxation of US households: facts and parametric estimates. Rev Econ Dyn 17:559–581
Guner N, López-Segovia J, Ramos R (2018) Reforming the individual income tax in Spain. Mimeo, Madrid
Guner N, Rauh C, Ventura G (2017) Means-tested transfers in the US: facts and parametric estimates. Mimeo, Madrid
Haugh D, Martínez-Toledano C (2017) The distribution of taxable income and fiscal benefits in Spain: new evidence from personal income tax returns (2002–2011). OECD Economics Department Working Papers, No. 1427, OECD Publishing, Paris
Heathcote J, Storesletten J, Violante GL (2009) Quantitave macroeconomics with heterogeneous households. Annu Rev Econ 1:319–354
Heathcote J, Storesletten K, Violante GL (2017) Optimal tax progressivity: an analytical framework. Q J Econ 132:1693–1754
Hernández de Cos P, López-Rodríguez D (2014) Tax structure and revenue-raising capacity in Spain: a comparative analysis with the EU. Banco de España Occasional Paper N. 1406
Holter H, Krueger D, Stepanchuk S (2018) How do tax progressivity and household heterogeneity affect laffer curves? Working Paper, University of Oslo
Krueger D, Mitman K, Perri F (2016) Macroeconomics and household heterogeneity. In: Taylor JB, Uhlig H (eds) Handbook of macroeconomics. Elsevier, New York, pp 843–921
Labeaga JM, Oliver X, Spadaro A (2008) Discrete choice models of labor supply, behavioural microsimulation and the Spanish tax reforms. J Econ Inequal 6:247–273
López-Laborda J, Vallés-Giménez J, Zárate-Marco A (2018) Income shifting in the Spanish dual income tax. Fisc Stud 39:95–120
López-Rodríguez D, García Ciria C (2018) Estructura Impositiva de España en el Contexto de la Unión Europea. Banco de España Documento Ocasional N. 1810
Martínez-Toledano C (2017) Housing bubbles, offshore assets and wealth inequality in Spain. WID. World Working Paper Series N. 2017/19
Peichl A (2016) Linking microsimulation and CGE models. Int J Microsimul 9:167–174
Pérez López C, Villanueva García J, Molinero Muñoz I, Martín Fernández R, Rodríguez de las Heras L (2018) La muestra de IRPF de 2015: descripción general y principales magnitudes. Instituto de Estudios Fiscales Documento de Trabajo 4/2018
Ricker WE (1954) Stock and recruitment. J Fish Res Board Canada 11:559–623
Rojas J (2005) Life-cycle earnings, cohort size effects and social security: a quantitative exploration. J Public Econ 89:465–485
Sánchez Martín AR, Sánchez Marcos V (2010) Demographic change and pension reform in Spain: an assessment in a two-earner, OLG model. Fisc Stud 31:405–452
Acknowledgements
Guner acknowledges financial support from the Spanish Ministry of Economy and Competitiveness, Grant ECO2014-54401-P.
Author information
Authors and Affiliations
Corresponding author
Ethics declarations
Conflict of interest
The authors declare that they have no conflict of interest.
Human participants or animals
This article does not contain any studies with human participants or animals performed by any of the authors. This article does not contain any information that requires informed consent.
Additional information
Publisher's Note
Springer Nature remains neutral with regard to jurisdictional claims in published maps and institutional affiliations.
We thank the editor, two anonymous referees, and seminar participants at Banco de España, the Workshop on Fiscal Policy and Microsimulation (Valencia), the Workshop on Microsimulation and Fiscal Policy (Banca d’Italia), the 43rd Simposio de la Asociación Española de Economía-Spanish Economic Association (SAEe, Madrid), and the Conference SERIEs - Banco de España “Taxes and Transfers” for comments and discussions. The views expressed in this paper are those of the authors and do not necessarily coincide with the views of the Banco de España or the Eurosystem. Guner acknowledges financial support from the Spanish Ministry of Economy and Competitiveness, Grant ECO2014-54401-P.
Electronic supplementary material
Below is the link to the electronic supplementary material.
Rights and permissions
Open Access This article is distributed under the terms of the Creative Commons Attribution 4.0 International License (http://creativecommons.org/licenses/by/4.0/), which permits unrestricted use, distribution, and reproduction in any medium, provided you give appropriate credit to the original author(s) and the source, provide a link to the Creative Commons license, and indicate if changes were made.
About this article

Cite this article
García-Miralles, E., Guner, N. & Ramos, R. The Spanish personal income tax: facts and parametric estimates. SERIEs 10, 439–477 (2019). https://doi.org/10.1007/s13209-019-0197-5
Received:
Accepted:
Published:
Issue Date:
DOI: https://doi.org/10.1007/s13209-019-0197-5