
Abstract
The shallow clastic section in the Nile Delta is characterized by mild velocity variations. The relationship between the expected velocity reduction in the gas reservoir rocks and the encompassing shale is responsible for acoustic impedance contrast, predictable to a particular AVO-class. In class-3AVO, the bright spot is a result of great reduction in velocity increase due to differences between high-velocity encompassing shale and relatively low-velocity reservoir sand. The class-3AVO characterizes a strong seismic amplitude appearance in the full stack section and with similar characteristic view of AVO analysis and interpretation. In addition to the strong amplitude, there are different DHI features related to the gas occurrence. These DHI features are analyzed to achieve and deliver a successful exploratory well. The DHI analysis of one of the unsuccessful cases using recent 3-D seismic data clarifies the importance of the workflow that works for exploring types of anomalies in the Nile Delta. The anomaly is drilled mainly based on an explicit high-amplitude anomaly with local flat spot, but without taking into consideration the extent of DHI characteristics, inherent to gas occurrence in the Nile Delta. Authors investigate all the features related to this unproven case in the form of a postmortem and compare it with proven existing discoveries, to know the possible reason of unsuccessful DHI anomalies in the Nile Delta.
Introduction
The area under study (Fig. 1) is located in the most northern part of Egypt between longitudes 30.2 to 32.2 and latitudes 29.8 to 32.8.

Area under study, showing a generalized stratigraphic column
According to the literature (El Heiny and Enani 1996; Sarhan et al. 1996; Deibis et al. 1986 and Payton 1977), the environment of deposition of the area under study varies from deep marine in the deeper part (lower part of the Pliocene) to shallow marine and deltaic facies in the shallower part. Excellent reservoir distribution is mainly linked to the relative sea-level low stands, where sands were conveyed to the outer belts through major incised canyons in the southern platform to distributary and submarine channels. Mega slumps were particularly active during Late Pliocene to recent. Understanding the controlling factors and sand content of these slumps is extremely important for the prospectivity of that part of the section (El Barkoky and Helal 2002). The sandstone reservoir of Ha’py gas field varies from non-cemented coarse-grained friable sand to very fine well-cemented sand with a variable amount of shale (Wigger et al. 1996). In Andaleeb low-resistivity gas discovery, the main target for the well testing was anomaly 25, which has a porosity ranging from 22 to 28% in the cleanest thin layers and water saturation within 40 and 60% (Farias et al. 2010); in Karous gas discovery, the reservoir extends over 78 m of gross pay, while the net pay 49 m and porosity is over 30% (Barsoum et al. 1998).
Structurally the Nile Delta is affected by three main structure elements, so it is subdivided the region into three sub-basins (Fig. 2): the eastern sub-basin, the central sub-basin and the western sub-basin.

Major structural elements of Nile Delta, the black solid lines are the main faults, associated with salt-related features (El Barkoky and Helal 2002) and North Sinai structure (El Heiny and Enani 1996) in the Nile Delta as shown in the figure. The colored spots are the surface and subsurface Syrian arc system anticlines in the onshore and offshore Sinai; the red zones are the main producing fields of the Nile Delta (Barsoum et al. 2002)
The hydrocarbon exploration activities in the offshore part include mainly in the shallow section of class-3 AVO anomalies.
The amplitude anomalies are sand packages charged by methane gas in most cases (El Maghraby et al. 2010). The estimated reserve for successful cases is estimated to be more than 35 TCF (Firinu and Sahadic 2014). The direct hydrocarbon indicators (DHI) anomalies in the shallow section are confirmed by the extensive drilling and production activities and studied by number of authors as in Sarhan et al. (1996), Barsoum et al. (1998), Wigger et al. (1996), Wigger and Bailey (1997), Samuel et al. (2002) and Hanafy et al. (2014).
The risk assessment of bright spot of the Nile Delta Pliocene section is studied by Firinu and Sahadic (2014), and they detected five different reasons for false bright spot; these reasons are:
-
1.
Over-pressured sand or shale formations.
-
2.
Highly cemented sand.
-
3.
Low-porosity heterolithic sand.
-
4.
Coal beds and top of salt diaper.
-
5.
Formation anisotropy.
Data considered and methodologies
The Nile Delta has been the subject of extensive geological and geophysical studies since the last two decades. The study case is located in the northern most part of the Nile Delta offshore Mediterranean part. In addition to the old 2D seismic data, high-resolution new 3D seismic data are acquired in 2012. The interpretation of new data is carried out to delineate and examine the subsurface hydrocarbon potentiality in the study area. The seismic interpretation of the post-salt section is based on extracting the seismic amplitudes, their anomalies zones and comparing them with existing one. These amplitude anomalies are analyzed in sequence; firstly, the highlighted anomalous zones are analyzed with different features related to strong amplitude and possible gas accumulations, as flat spot and pull-down effect. Secondly, the analysis of the data is extended to the AVO on partial volume stacks. Different AVO attributes (Hilterman 2001; Taner 2001) are extracted from volumes of intercept and gradient including pseudo-gradient volume.
Thirdly, after drilling the well, data analysis is extended in other areas to justify the well results, such as net-pay extraction and gas–water contact responses (Hashem et al. 2010 and Helmy and Fouad 1994). In case the well is unsuccessful, postmortem analysis provides clues of devoid of hydrocarbons, including review of synthetic seismic data extraction, fluid replacement, AVO studies (Rutherford and Williams 1989) and future works to improve seismic data, resolution and their relation to the geology.
The case-well main characteristics:
-
1.
The well under analysis is the first well in a series of wells in the investigating area after complete analysis and interpretation of the newly acquired seismic data in both depth and time domains. With the help of different seismic attributes such as complex seismic trace attributes and AVO analysis, the analysis supports the regional Pliocene discoveries in the region.
-
2.
The main target is exploring and examining the high-amplitude anomaly as shown in Fig. 3. The flat spot appears in the section at two-way time value equal to 2695 ms, interpreted as gas–water contact. Though anticlinal structure is interpreted with bright spots, flat spot appears ambiguous.
Fig. 3 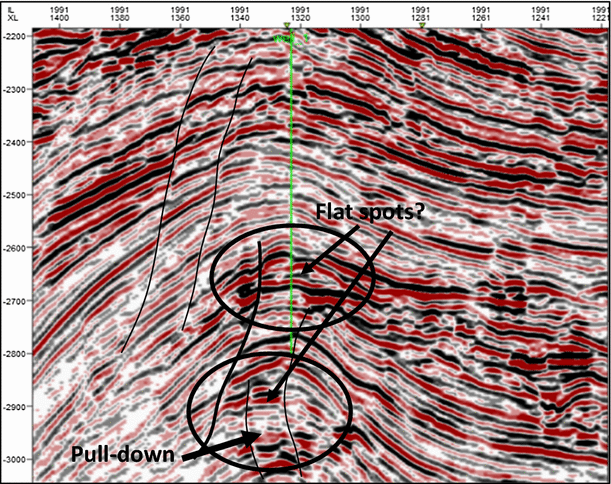
Well-1 passing through an E–W seismic line, showing anomalies with possible flat spots at two-way time 2695 ms
-
3.
The time and amplitude maps (Figs. 4, 5) show that the well is located at the edge of high amplitude in the highest structural point in the four-way dip closure anticline. The maps show complicated fault systems, the E–W faults bounding the anomaly intersected by group of NE–SW growth fault set.
Fig. 4 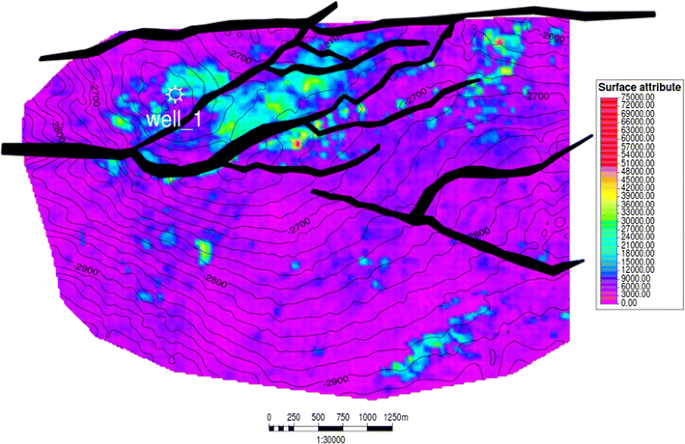
Well-1 amplitudes, superimposed on two-way time structure map
Fig. 5 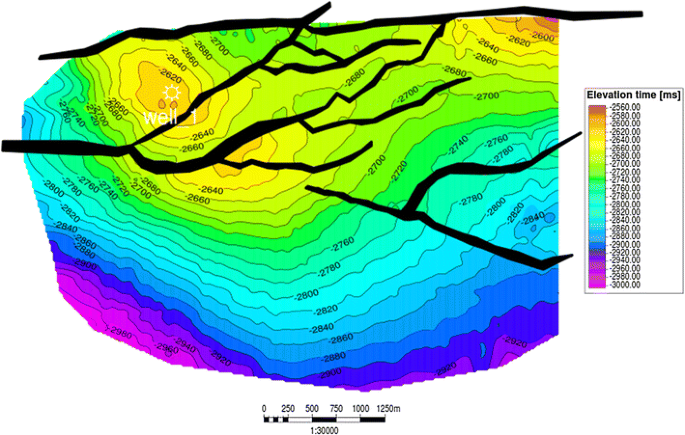
Well-1 two-way time structure contour map
-
4.
Though the well is located in the best location according to available seismic attributes data (Figs. 6, 7, 8), the petrophysical evaluation of the well as displayed in Fig. 9 is plug and abandoned well; the target anomaly is clear with shale rocks as interpreted from well logs.
Fig. 6 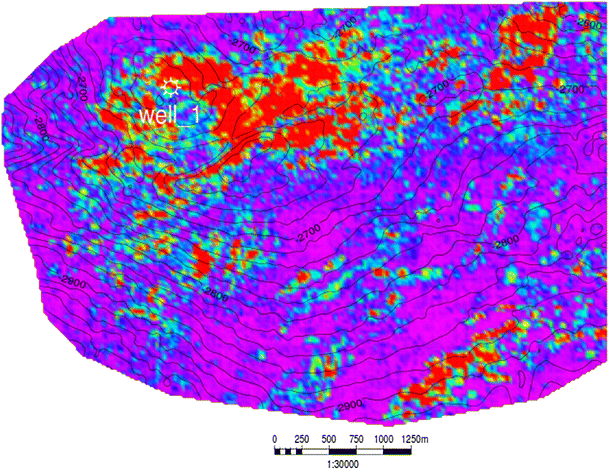
Far-minus-near attribute superimposed on a two-way time contour map
Fig. 7 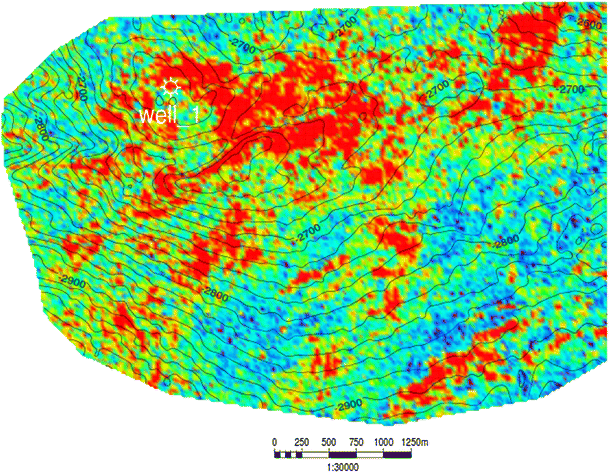
AVO gradient superimposed on two-way time contour map
Fig. 8 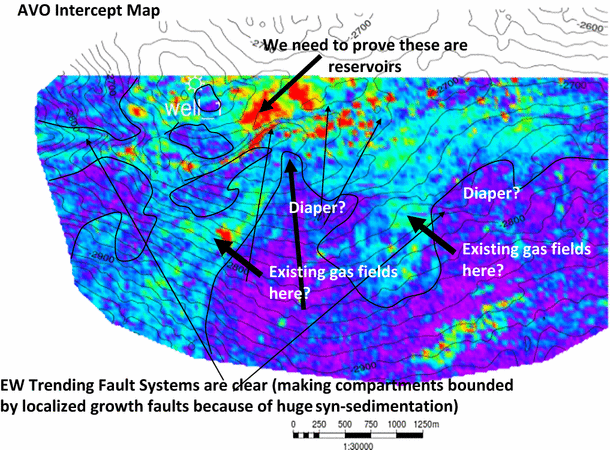
AVO intercept superimposed on a two-way time contour map
Fig. 9 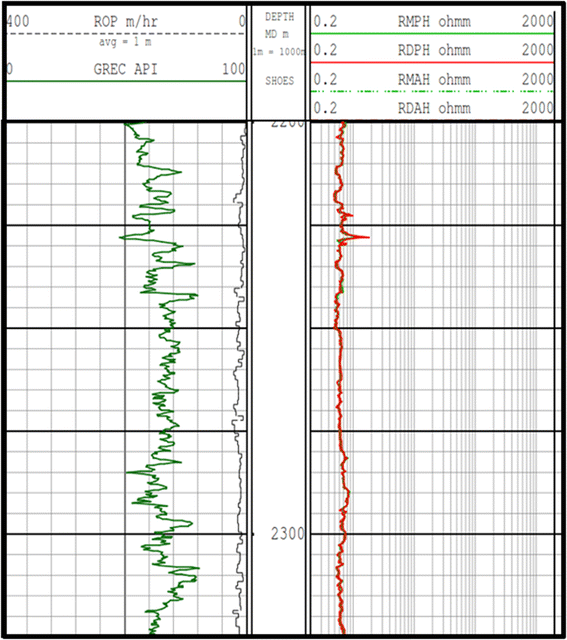
Well_1 gamma ray and resistivity logs


The analysis of different DHI related to the anomaly of Well_1
Different DHI features related to the successful cases in the Nile Delta Pliocene section are analyzed (Hanafy et al. 2014) as follows:
-
1.
All the anomalies are bright spots in the full stacked section; in partial stacks, these anomalies are represented by low amplitude in near-stack and high amplitude in far-stack (Castagna et al. 1998).
Well_1 main target is anomalous high amplitude in full stack section (Fig. 3 and the far minus near is positive values indicating, typical AVO-class-3.
-
2.
There is a polarity reversal between the anomaly and the reference horizons [sea bottom and top of Rosetta salt (Cowan and Shallow 1998].
Well_1 main target has polarity reversal with amplitudes, as case with horizons of sea bottom and top of salt.
-
3.
In thick reservoir facies or multiphase reservoir, the flat spot is indicative of gas–water contact.
There is no pull down in the section below the target, as seen in Fig. 10.
Fig. 10 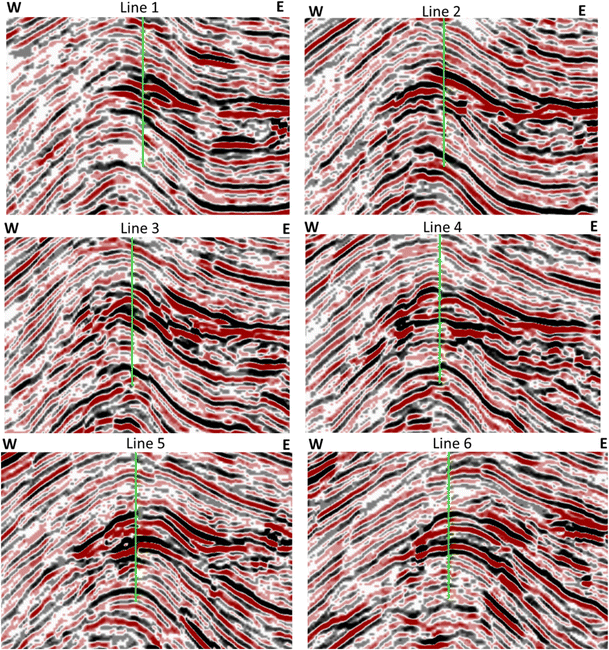
Seismic lines around Well_1 (green vertical line); the well is located in the center of seismic line 3, lines 1 and 2 located to the north of the well where lines 4, 5, 6 are located to the south of the well, the line interval is five seismic lines and the line spacing is 25 m, the flat spot continues around the well, a pull down in the deeper section as observed in line 6
-
4.
Regarding the match between the amplitude envelop and the seismic structure:
There is no amplitude-structure match. There are high amplitudes in the crest of the structure, but the amplitude is concentrated in the flanks and eastern part of the anticline. In addition, the well is located in the low-amplitude edge (Fig. 4).
-
5.
The polarity reversal between the reservoir facies and the water facies found in only one case (Rosetta discovery), not represented to class-3 AVO.
There is no polarity reversal between the possible reservoir and the water zones as seen in Fig. 10.
-
6.
Sag or pull down is related to thick reservoirs.
There is no pull down below the possible reservoir as seen in Fig. 10.
-
7.
Gas chimney found is very close to two discoveries in the offshore part.
There is no gas chimney.
-
8.
Frequency reduction within and below the reservoir.
There is no frequency or amplitude reduction within the reservoir, as seen in Figs. 11 and 12; there are lateral similarities between the possible reservoir facies and the water zones.
Fig. 11 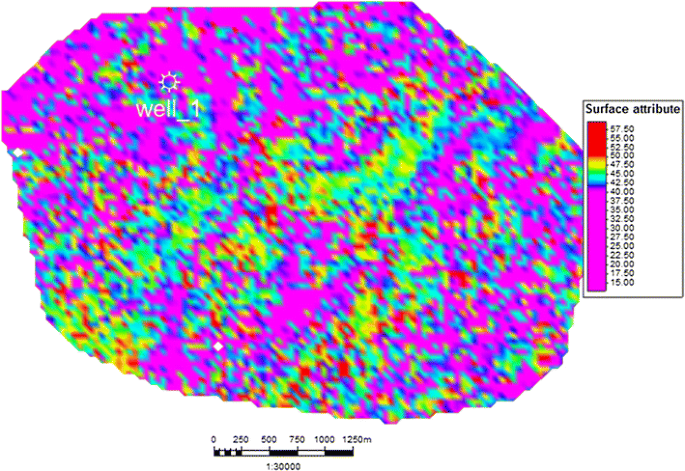
Surface amplitude map, extracted from a dominant frequency volume
Fig. 12 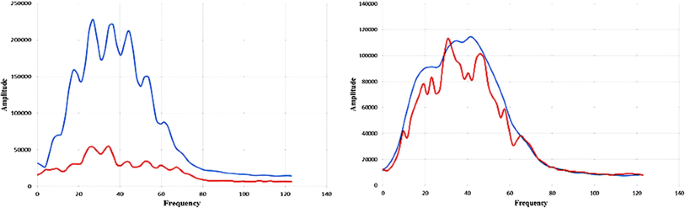
Frequency spectra and their responses in gas case (left) and without gas (right)
-
9.
Amplitude reduction within and below the reservoir.
Comparison between successful case in the same seismic volume and this case as seen in Fig. 12 clarify that, in this anomaly there is no reduction in the amplitude below the reservoir. This step is achieved using window of length 200 ms below the possible reservoir in both cases, the successful and case of Well_1 anomaly.


The well is located at higher-frequency values and high-amplitude areas. But as shown in Figs. 4, 6, 7, 8, a low-frequency range is interpreted.
For frequency amplitude plot for gas case (left) and the right the same plot for Well_1 case, the blue line is the anomaly amplitude range and the red line is amplitude below the reservoir, for the same frequency range. There is clear separation between the curves in gas case (to left), and there is no clear separation between the reservoir and deeper section in the Well_1 case. The amplitudes values of the reservoir facies in gas case are double the amplitudes values in Well_1 reservoir facies, where the amplitude values in the possible water zone in Well_1 are double the amplitude values in the water zone in the gas case. These values are extracted within a window length of 200 ms, below the interpreted reservoirs.
-
10.
Termination of high amplitude against the faults.
There is termination of amplitude against fault planes (Figs. 2, 3, 10).
Geological characteristics of the DHI anomalies are interpreted as:
-
1.
All anomalies are related to growth normal faults.
The well is located in the upthrown side of recent E–W reverse fault and intersected by set of NE–SW normal growth faults.
-
2.
The anomalies are located in the downthrown and upthrown sides of the main bounding faults and in the upthrown sides of the minor faults.
The well is located in the upthrown side of recent E–W reverse fault (Fig. 13).
Fig. 13 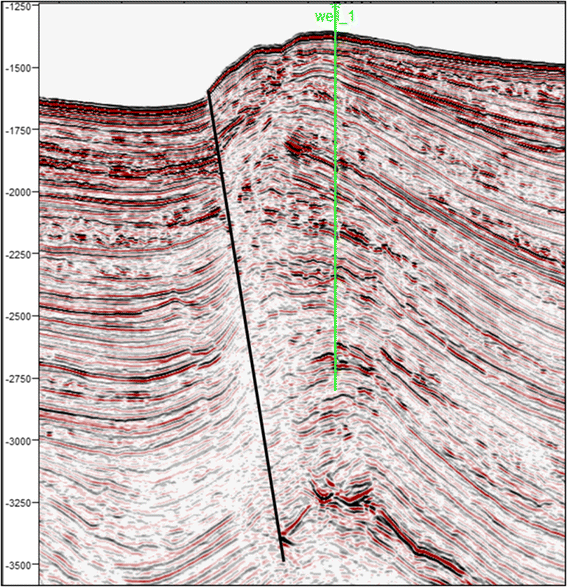
N–S seismic line passing through Well_1; the location of the drilled well is located in the upthrown side of reverse fault and intersected by growth normal faults
-
3.
The faults are sole out of the top of Rosetta formation.
The fault anomalies are intersecting in both deep and shallow sections.
-
4.
Some of the discoveries are related to faults that reached to sea bottom, which may have been causative of reduction in the seal risk of interpreted faults.
The fault reaching the sea bottom suggests that there is no indication of gas chimney in the section as seen in Fig. 13.
-
5.
The potential zones extend from El Wastani formation to Lower Pliocene.
The potential zone is located in middle Kafr Elshiekh formation.
-
6.
The main stratigraphic feature in the east is turbidities and in the west are submarine channels.
There is no indication for channels in this case.
-
7.
There is enough sediments thickness between the Rosetta formation and all target reach in some case to one second.
The separation between the anomaly and the top of salt is close to 400 ms.

The case-well synthetic seismogram
In order to understand the reasons for the seismic response, a zero-offset synthetic seismogram is carried out using the available density and sonic logs in the well (Fig. 14).

Well_1 synthetic seismogram; the bright spot anomaly is completely disappeared in the raw synthetic seismogram, which excluded the over-pressured zone in the target zone, supporting the artificial bright spot
The possible reasons for the bright spot found in Well_1
It is clear that the Well_1 is drilled based on different features related to the bright spot such as the flat spot, amplitude termination against fault plane. According to the well result, this feature is not gas–water contact, but it is shale sediments.
The first option in the analysis is the possible low-resistivity pay. This case is encountered in different wells in the Nile Delta, but the FMI logs, water samples and very low resistivity of the target zone (average 0.6 Ω, where the published low-resistivity pay varies from one to 2 Ω as seen in Fig. 15) as observed in (Anwar et al. 2002), excluded this possibility. High-frequency variations of sand shale intercalation are features in the evaluation of the well lithology.

To the left the Well_1 logs and to the right the low-resistivity well case (Anwar et al. 2002), the gamma ray logs are very close in both wells, but the resistivity are different, the resistivity of the low pay varies between 2 and 3 Ω, where the resistivity of the Well_1 varies between 0.5 and 0.6 Ω
The second option is the study of the possible bright spots in the Nile Delta (Firinu and Sahadic 2014); these reasons are:
-
6.
Over-pressured sand or shale formations.
-
7.
Highly cemented sand.
-
8.
Low-porosity heterolithic sand.
-
9.
Coal beds and top of salt diaper.
-
10.
Formation anisotropy.
According to the study results (Firinu and Sahadic 2014), the first and last reasons are the possible reasons for false gas bright spot in the offshore part of the Nile Delta, and according to the well results, the only available reason is the last reason or formation anisotropy. The anisotropy has clear effects on the amplitude and phase of the anomaly, but the effects are reducing the amplitudes not increasing the amplitude (Fig. 16).

Anisotropic velocity analysis affects the amplitude and phase of the event (Firinu and Sahadic 2014); the amplitude of the isotropic velocity analysis (blue line) is higher than the amplitude of the anisotropic amplitude analysis
The analysis of the flat spot indicates the following:
-
1.
The flat spot is not completely flat (Figs. 3, 7, 11) because of the tuning and velocity effects, but it is clearly unconformable with structural reflections.
-
2.
The questions related to such option are the source of the flat spot; in general, the flat spot could be related to different features:
-
1.
Fluid contact
-
2.
Paleo-contact
-
3.
Thermal variations
-
4.
Tuning effects
-
5.
Multiple remnants
-
1.
According to the drilled well data, there is no hydrocarbon in the target zone, which excluded the first possibility. There are no indications about the second and third possibility in the Pliocene section in the Nile Delta (paleo-contact of thermal variations). The analysis of seismic section indicates the highly dipping reflectors, which excluded the possibility of multiple remnants, implying that the only available solution to the flat spot occurrence is the tuning effect. This result could be supported by the different features related to the presence of high amplitude such as anisotropy and sand–shale high-frequency variation as seen in the log curves.
Conclusions
-
The anomaly of the Well_1 is unsuccessful case under DHI category and analysis in the Nile Delta Pliocene section. Analysis of the different features related to the gas occurrence in the province indicates the absence of characteristic features related to the gas occurrence.
-
The presence of the flat spot is strong indicator for gas occurrence; this flat spot may be the result of different physical property contrasts of geological and geophysical signatures. The analysis of the well result and its associated seismic data indicate a possible reason for flat spot with its tuning effect.
-
The synthetic seismogram indicates low-amplitude reflections in the target zone instead of high-amplitude reflections. This fact could support the possible reason for the ambiguous bright spot.
-
The well location is related to different geological features in the Nile Delta such as four-way dip closure in the upthrown side of the reverse faults
-
The well location is selected according to pure structural concept, which could be a possible reason for the partial misunderstanding of the well result; the best location according to the available data is to shift the well further to the east in the flank of the anticline and the high-amplitude area.
-
Another possibility could have been the deviation of the existing drilled well toward easterly direction, covering high-amplitude anomalies.
-
The collection of the different well data in such cases is preferable to study, understand the results and to recommend for future works.
References
Anwar A, Hassan S, Belhadj B (2002) An integrated approach to determine hydrocarbon potential in low resistivity, thinly laminated reservoir: East-Delta area, Egypt. In: MOC 2002, Alex, Egypt
Barsoum K, Aiolf C, Dalla S, Kamal M (1998) Evaluation and hydrocarbon occurrence in the Plio-Pleistocene succession of the Egyptian Mediterranean Margin. In: Examples from the Nile Delta basin. E.G.P.C. exploration seminar, Cairo
Barsoum K, Della M, Kamal M (2002) Gas chimneys in the Nile Delta slope and gas field occurrence. In: MOC 2002, Alex, Egypt
Castagna JP, Swan HW, Foster DJ (1998) Framework for AVO gradient and intercept interpretation. Geophysics 63(03):948–956
Cowan G, Shallow J (1998) The Rosetta P1 field: a fast track development case study. In: Nile Delta Egypt. E.G.P.C. 14th exploration and production conference, vol 2, pp 222–235
Deibis S, Futyan AR, Ince DM, Morley RJ, Seymour WP, Thompson S (1986) Stratigraphic framework of the Nile Delta and its implications with respect to regions, hydrocarbon potential. In: E.G.P.C. 8th exploration conference
El Barkoky A, Helal M (2002) Some Neogene stratigraphic aspects of the Nile Delta. In: MOC 2002, Alex, Egypt
El Heiny I, Enani N (1996) Regional stratigraphic interpretation pattern of Neogene Sediments, northern Nile Delta, Egypt. In: E.G.P.C. 13th exploration and production conference, vol 1, pp 270–290
El Maghraby F, Rizk A, Hussien M (2010) Seismic capability of finding gas and oil on the onshore Nile Delta of Egypt. In: MOC 2010, Alex, Egypt
Farias L, Firinu M, Cassidy S, Hagag W, Beretta E (2010) Andaleeb, Unlocking the potential of unconventional pay, Levée Facies. In: MOC 2010, Alex, Egypt
Firinu M, Sahadic S (2014) Understanding formation anisotropy within a false bright spot Anomaly response. http://www.euromedoffshore.com/files/2012_Presentations/MauroFirinu.pdf
Hanafy S, Nimmagadda S, Sharaf Eldin S, Hemdan K, Farhood K, Mabrouk W (2014) New insights on interpretation of seismic attributes in Nile-Delta basins for analyzing Pliocene geological characteristics. In: MOC 2014, Alex, Egypt
Hashem A, Rizk R, Gaber M, Bunt R, Mckeen R (2010) Petroleum system analysis of south east El Mansoura area and its implication for hydrocarbon exploration, onshore Nile Delta, Egypt. In: MOC 2010, Alex, Egypt
Helmy M, Fouad O (1994) Prospectivity and play assessment of Abu Qir area, Nile Delta, Egypt. In: E.G.P.C. 12th exploration and production conference, vol 1, pp 277–292
Hilterman F (2001) Seismic amplitude interpretation. Course notes, SEG, USA
Payton CE (1977) Seismic stratigraphy applications to hydrocarbon exploration. In: A.A.P.G. Memoir 26, pp 63–97
Rutherford SR, Williams RH (1989) Amplitude-versus-offset variations in gas sands. Geophysics 54:680–688
Samuel A, Kneller B, Raslan S, Sharp A, Parsons C (2002) Prolific deep-marine slope channels of the Nile Delta, Egypt. In: AAPG bulletin, vol 87, no 4 (April 2003), pp 541–560
Sarhan M, Barsoum K, Bertello F, Talaat M, Nobili M (1996) The Pliocene play in Mediterranean offshore, structural setting and growth faults controlled hydrocarbon accumulations in the Nile Delta basin. A comparison with Niger Delta basin. In: E.G.P.C. 13th exploration and production conference
Taner MT (2001) Seismic attributes. CSEG Recorder, Houston
Wigger S, Bailey J (1997) Ha’py field, a Pliocene bright spot example from the Nile Delta, Egypt. Lead Edge 16:1827–1829
Wigger S, Simpson M, Nada H (1996) Ha’py Field: the result of A Pliocene exploration in Ras El Barr Concession, Nile Delta. In: EGPC: 13th petroleum conference, vol 1, pp 185–193
Author information
Authors and Affiliations
Corresponding author
Additional information
Publisher’s Note Springer Nature remains neutral with regard to jurisdictional claims in published maps and institutional affiliations.
Rights and permissions
Open Access This article is distributed under the terms of the Creative Commons Attribution 4.0 International License (http://creativecommons.org/licenses/by/4.0/), which permits unrestricted use, distribution, and reproduction in any medium, provided you give appropriate credit to the original author(s) and the source, provide a link to the Creative Commons license, and indicate if changes were made.
About this article

Cite this article
Hanafy, S., Farhood, K., Mahmoud, S.E. et al. Geological and geophysical analyses of the different reasons for DHI failure case in the Nile Delta Pliocene section. J Petrol Explor Prod Technol 8, 969–981 (2018). https://doi.org/10.1007/s13202-018-0445-4
Received:
Accepted:
Published:
Issue Date:
DOI: https://doi.org/10.1007/s13202-018-0445-4