
Abstract
The use of seismic attributes for understanding reservoir complexity has been proven to work in several fields. Thus, we demonstrate applications of seismic attributes for evaluating the oil and gas reservoirs in the eastern portion of the Rio del Rey (RDR) Basin. The presence of these fluids in twenty-six (26) reservoirs of the study area was confirmed with the help of Larson VizEx Pro software using well and seismic data. The 3D merged seismic data reprocessed in 2011 were used to extract the root-mean-square (RMS) and maximum amplitude attributes for each of the reservoirs. Forty-seven (47) RMS and maximum surface attributes were generated using Petrel E&P 2014 software. Seven (7) of these attributes have been presented. Quality control using Interactive Petrophysics (IP) software was applied on the reservoir fluid type found in each well. These fluid types were later superposed on each of the amplitude maps to match the corresponding amplitude responses. A good match could be observed between some well tops and their corresponding amplitude values. The results obtained indicate that GH and WX concessions could be the best concessions in the eastern part of the RDR Basin since most of their reservoirs, especially WX S6.3 maximum amplitude map, matched with their well fluid contents. The results obtained have been used to propose potential areas for further drilling.
Introduction
Cameroon’s geology has revealed that the country has many sedimentary basins belonging to the active petroleum system in Central Africa (Abolo 2008). These basins are subdivided into two categories; coastal basins which include: Rio Del Rey (RDR) and Douala/Kribi Campo (DKC) Basins; and the intra-continental basins which include: the Mamfe and the Logon Birni Basins. The coastal basins are known to host hydrocarbons, and no petroleum is known to occur in the inland basins so far. Taking this into account, the government of Cameroon has decided to subdivide these basins into blocks or concessions to put them at the disposal of the private petroleum companies. Presently, the Cameroon mining domain has about thirty concessions mainly located in the RDR and Douala Basins which are managed by the National Hydrocarbons Cooperation (NHC).
Seismic attributes have been applied differently in reservoir studies. So far, in the RDR Basin, this has not been done. The primary objective of this work is to identify and select the attributes that work best in predicting hydrocarbon presence in a reservoir. These will then be used to make an inventory of the hydrocarbon reservoirs of the eastern portion of the RDR Basin. However, care must be taken when choosing the seismic attributes, because it is not unusual to find spurious or false correlations that do not reflect any physical basis for the relationship.
Geologic setting
Geographical location of the RDR Basin
The RDR Basin is a divergent passive margin basin found in the southwest of Cameroon (Longmore and Lee 2010) and represents the southeastern extension of the Niger Delta in the Gulf of Guinea (Coughlin et al. 1993). It is located between 4° and 5° of latitude north and between 8°20′ and 9°10′ of longitude east (Fig. 1). This Basin is further limited in the north and northeast by the Tertiary and Cretaceous outcrops; in the northwest, it is limited by the Niger River; in the south, it is limited by the Equatorial Guinea boundary and finally in the southeast by the Cameroon Volcanic Line (CVL). This line also separates the RDR Basin from the DKC Basin (Ntamak-Nida et al. 2010). The RDR Basin is a coastal basin and has a surface area of about 7000 km2 offshore. It is one of the basins from which hydrocarbons are produced in Cameroon with about 90% of the country’s production (SNH 2010).

Location map of the entire Rio Del Rey (RDR) Basin
Structural setting
The RDR Basin is one of the Equatorial Atlantic marginal basins of the Gulf of Guinea of the Atlantic Ocean formed by the separation of the South American block from the African continent block (Tuttle et al. 1999). The RDR Basin has a geologic history that can be divided into three (3) stages of basin development: Pre-rift stage (late Proterozoic to Late Jurassic, with the deposition of about 600 m2 of continental clastic rocks of Carboniferous to Jurassic age (Villemin and Tarreserence 1990); Sync-rift stage (Late Jurassic to Early Cretaceous, with the deposition of thick sequences of fluvial and lacustrine rocks); and Post-rift stage (Late Cretaceous to Holocene, which is made up of younger rocks and deposited as transgressive units consisting of shelf clastic and carbonate rocks followed by progradational units along the continental margins and as open-ocean water units (Brownfield and Charpentier 2006).
The RDR Basin is made up of four structural provinces showing different features (SNH 2015) (Fig. 2). These include the Cretaceous onshore province, the growth fault province in the north, the shale ridge province in the southwest, and the Delta Toe-thrust in the south central area.

Regional structural setting of the RDR Basin showing the four provinces (Kumar 2012)
Regional petroleum system
This is a combination of certain elements capable of accumulating and producing potential hydrocarbons. These elements are the source rock and migration path, the reservoir rock, and the trapping mechanism.
The source rocks are made up of upper prodeltaic marine shale of the Paleocene Akata Formation (Evamy and Haremboure 1978). We may also have interfingering shales belonging to the base of the Eocene Agbada Formation. Type III/II kerogens (humic to mixed type) have mostly been documented, indicating a predominantly terrestrial origin for the organic matter (Stacher 1995).
The reservoir rocks in the RDR Basin are made up of sandstones and paralic non-consolidated sand from the Agbada Formation. The characteristics of these reservoirs are controlled by depositional environments and depth of burial. Oil is produced from the sand facies of the Agbada Formation (Short and Stauble 1967). Nevertheless, turbiditic sands from the Akata Formation are the main offshore target in deep water.
The alternation of sand and shale in the eastern portion of the RDR Basin confirms the presence of a high and effective seals. The efficiency of the seals is more advantageous when it concerns turbiditic sand deposited in the presence of paleogenic clay. These clays form top seals for some important fields encountered in the eastern portion of the RDR Basin (Doust and Omatsola 1990).
In the RDR Basin, structural traps dominate but we also have some stratigraphic traps such as pinch-outs and turbiditic fans lenses (Beka and Oti 1995). These structural traps developed during syn-sedimentary deformation of the Agbada paralic sequence (Evamy and Haremboure 1978). Minor faults favor the migration of hydrocarbons in the basin (Fig. 3).

Cross section through the RDR Basin showing traps and plays (SNH 2015)
Exploration history in the RDR Basin
Since 1970, 90% of the crude oil produced in Cameroon comes from the offshore portion of the RDR Basin in the southwest region of the country (SNH 2010). Petroleum exploration in Cameroon began in the late 1940s. The first significant oil discovery was made in 1972 with the Ekoundou field, developed by former France’s Elf (now MRS). Since then, an intensive activity led to more discoveries of larger fields, such as Kole, Kombo and Bavo Marine by Elf, Lokele by former Shell-Pecten, and Moudi by former Total. Oil fields in the RDR Basin have been, so far, the main source of oil production in Cameroon since 1977. Elf was the pioneer of oil production and was by far the largest producer, contributing approximately 75% of the country’s yearly production. It was followed by Addax Petroleum with 22% and Perenco, which, as Kelt, acquired Total’s assets in 1994, with the remaining 3%.
Geophysical concepts
The presence of oil and gas can be observed in seismic sections by different indicators such as (i) amplitude anomaly (ii) flat spot (iii) polarity reversal (iv) bright spot (v) dim spot (Fig. 4). These indicators are also known as direct hydrocarbon indicators (DHI) (Tanveer 2012). Amplitude anomalies show a difference in amplitude along a continuous reflector. An amplitude anomaly can be strong and positive, strong and negative, or weak. Flat spots occur at the reflective boundary between different fluids, either gas–oil, gas–water, or water–oil contacts (Friedrich 2000). Flat spots are generated by contrast between small acoustic impedance (AI) of gas-filled porous rock and greater AI of liquid-filled porous rock at horizontal gas–liquid contact. It is recognizable because it is discordant with the surrounding structure’s non-horizontal reflections (Railsbacks 2011). These fluids are revealed directly on true-amplitude seismic sections by localized zones of anomalously strong reflections known as bright spots. These high-amplitude reflection events are attributable to the large reflection coefficients at the top and bottom of gas zones (typically, gas-filled sands) within a hydrocarbon reservoir (Kearey et al. 2002). Nevertheless, dim spots (local decrease in reflection amplitude when the AI of the rock is reduced in magnitude) also help in the identification of hydrocarbons.

A seismic attribute is a measurable property of seismic data, such as amplitude, dip, frequency, phase, and polarity that facilitates seismic data comprehension and interpretation. Seismic attributes reveal information, which are not readily apparent in the raw seismic data. A valuable seismic attribute is one that enhances geologic features including faults or depositional and stratigraphic elements such as channels and lobes (Chopra and Marfurt 2005 in Rubio 2010).
In most exploration and reservoir seismic surveys, the main objectives are, first, to correctly image the structure in time and depth and, second, to correctly characterize the amplitudes of the reflections. Assuming that the amplitudes are accurately rendered, a set of additional features can be derived and used for interpretation. Collectively, these features are referred to as seismic attributes. The use of color is very important in attribute displays. The attribute color scale can be modified so that the display is using the full dynamic range of the data (Tanveer 2012). Some of these features include the root-mean-square (RMS) amplitude and the maximum amplitude.
RMS amplitude is the square root of the sum of the squares within a desired volume interval divided by the number of live samples in the interval (Kumar 2012). RMS shows the strength of amplitude over a given volume interval (Tanveer 2012). This attribute is used to map hydrocarbon indicators within a zone by providing a statistical measure of the magnitude of variation in amplitude throughout a data set. Generally, higher AI variations will result in higher RMS values (Tyler 2013).
Maximum amplitude measures the maximum positive or negative amplitude of a trace and potential low velocity medium within a time or depth window. It is a good indicator of hydrocarbon accumulations (Daber et al. 2010 in Tanveer 2012).
Data sets and methodology
Data sets
The data sets used in this study include:
-
Pre-Stack Time Migration (PSTM), FULL STACK and 3D MERGE. The study area (860 km2 of surface area) is made up of eight 3D surveys collected in east–west direction, acquired between 1980 and 2006 (Fig. 5). Based on seismic data, the area was divided into 12 concessions: (AB, CD, EF, GH, IJ, KL, MN, OP, QR, ST, UV, and WX).
Fig. 5 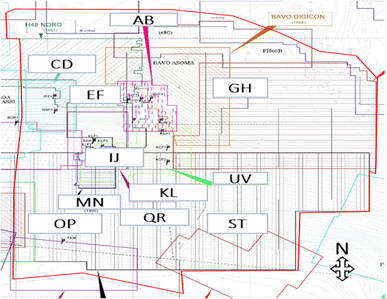
3D PSTM seismic data on a base map (Perenco 2006)
-
Wells. 12 concessions, 43 fields and 44 prospects were listed in the area of interest. From a detailed study of these fields, 112 wells and 26 sand reservoirs were identified (Table 1). Well data were collected using Larson VizEx Pro software in a CGM format. Quality control (QC) was applied on the well data using IP software.
Table 1 Wells and reservoirs data -
Well Log Parameters. This includes sonic log, density log, resistivity log, and gamma log. These logs play a role in determining the type of fluid in the reservoir.

Methods
The methods used in this work involved three steps, namely creation of inventories, data quality control, and finally seismic amplitude computation and well display.
A concessions-field inventory of the eastern portion of the RDR Basin was created using Microsoft Excel 2013 and the RDR Basin prospect map. Using this procedure, a second inventory made up of fields and wells was created. The third inventory involved the use of Microsoft Excel and Larson VizEx Pro software, and included fields, wells and their corresponding reservoirs and/or reservoir series. Larson VizEx Pro software provided information on the fluid content of the various reservoirs.
A series of QC was applied on the third inventory. This QC enabled the elimination of unreliable or non-interpreted fields, wells, and reservoirs.
The analysis for the 3D seismic data set, well data, and well log data for the purpose of acquiring the set objectives of this work was carried out using Petrel® E&P software Platform 2014. After gathering well and reservoir data, they were imported and quality checked together with 3D seismic data into the interpretative tool. Seismic attributes such as RMS amplitude and maximum amplitude were extracted from seismic data. Seismic attributes were extracted as surface attribute maps for each of the reservoirs. These maps show amplitude anomalies used in identifying the presence of hydrocarbon fluids. Wells and well tops were later displayed on the seismic attribute maps. This intersection is also referred to as “data matching” and helps in confirming the tops of the various oil reservoirs. A workflow that summarizes the steps involved is shown in Fig. 6.

Methodology workflow
Results and interpretation
The inventory in the east of the RDR Basin initially gave 12 concessions, 43 fields, 44 prospects, and 112 wells. After a series of QCs, 5 concessions, 17 fields, and 26 reservoirs were considered and used to generate the attribute maps. A total of 49 attribute maps were generated for all the fields and superimposed on their corresponding wells. Seven of these attributes are shown in Figs. 7, 8, 9 and 10. The color scale for the attribute maps has been adjusted to each amplitude map in order to define the anomalous area distinctly caused by impedance contrast of the different fluids (globally in RDR Basin, low amplitudes stand for water, average amplitudes for oil, and highest amplitude for gas (Perenco 2012). The results obtained by extracting attributes (maximum amplitude and RMS amplitude) from the 3D seismic data in the study area alongside with the wells (light black lines) and well tops (colored circles indicating the fluid content) of some fields are presented in Figs. 7, 8, 9 and 10.

Reservoir RMS amplitude map a AB SeVI; b IJ SaIIa

Reservoir RMS amplitude map a SeVII; b AB Sf.c

Reservoir maximum amplitude map a UV PSc; b GH-UV SeIV

Reservoir maximum amplitude map for SaIIf indicating a case of mismatch
The RMS amplitude map SeVI (Fig. 7a) is defined within the time window ± 10 ms. It is expressive and matches with almost all fluid contents of the well. High-amplitude anomalies are widely distributed within the highlighted areas. These high-amplitude anomalies are interpreted as bright spots, indicating the presence of oil and gas, as explained by Tanveer (2012). The fluids are well distributed within the reservoir as in respect to their densities. Gas with the lowest density is found at the top (at lower isochrones values), followed by oil with a higher density is found at higher isochrones values and finally water with highest density is found at very high isochrones values.
The very high-amplitude anomalies (bright spots) found within the black highlighted zones may indicate the presence of a potential hydrocarbon fluid, principally gas. New wells could be drilled in these areas.
The RMS amplitude map SaIIa (Fig. 7b) has as time window ± 5 ms. The amplitude responses match with almost all fluid contents of the wells as illustrated in the highlighted zones. A lateral extension of a high-amplitude (bright spot) response is observed from the east (crest) of the reservoir map which ends in conformity with the isobaths line 1250 ms and a drastic change in amplitude is observed. This drastic change in amplitude is caused by a change in AI existing between the oil and water areas (Veeken 2006). Above this isochrones, there are low amplitudes corresponding to the water-filled wells concentrated in the NW. It is also seen that the oil-filled wells are found at the crest (less dense), while the water-filled wells are found at the trough (denser) except Well IJ36D. This is because of the fault. This fault alters the arrangement of fluids within a given layer. The black highlighted zone in the north of the area illustrates high-amplitude anomalies. These high-amplitude anomalies (bright spots) may be due to the presence of a potential gas fluid in the zone, thus a well could be drilled in this area.
The RMS amplitude map SeVII (Fig. 8a) has a time window of ± 10 ms. The high-amplitude anomalies responses in the red highlighted areas are seen to match with their corresponding oil-filled wells, while the gas wells YZ01 and YZ3D in the yellow highlighted areas do not match with their corresponding amplitude responses. The faulty nature of the reservoir affects arrangement of the fluids as in a conventional reservoir (gas–oil–water).
Defined within the time window ± 10 ms, the RMS amplitude map Sf.c (Fig. 8b) shows amplitude anomalies that do not correlate with the well fluid contents (highlighted yellow portions), except for the water well AB12D (highlighted red portion) that matches well with its corresponding low-amplitude anomalies (dim spot). High-amplitude anomalies (bright spots) found in the black highlighted zone may be caused by the presence oil or gas in that area (Tanveer 2012). The lateral extension of these high-amplitude anomalies that terminate on the isochrones 1600 ms may illustrate a possible contact caused by a change in AI related to the nature of the fluids (with higher amplitudes for oil and gas and lower amplitudes for water) (Veeken 2006).
The maximum amplitude map PSc (Fig. 9a) has ± 12 ms as time window. This maximum amplitude map shows amplitude anomalies that match with the fluid content of the wells. In the highlighted red zone, the high-amplitude anomalies correctly match with the oil-filled wells. The black arrows show areas of very high anomalies which might be due to the presence of gas. The highlighted yellow zones illustrate low-amplitude anomalies that do not match with the wells fluid content. Along the isochrone lines 1250 and 1370 ms, a clear conformity termination of high-amplitude is observed and drastic anomaly changes are seen (to lower amplitudes). These changes are caused by the change in fluid type from gas to oil and to water. Such conformities increase the certainty of the interpretation. These fluids are well arranged as in a conventional reservoir with oil at lower isochrones and water at higher isochrones values.
The maximum amplitude map SeIV (Fig. 9b) has a time window of ± 10 ms. This map is very expressive and shows amplitude responses that match correctly with all fluid content of the wells as shown by the highlighted zones. The gas- and oil-filled wells distributed in the red highlighted zones correspond with the high-amplitude anomalies while the water-filled match with the low-amplitude anomalies. The black highlighted zones show very high-amplitude anomalies that might correspond to the presence of gas. Clear conformity terminations of some high-amplitude anomalies are also observed at the faults which play the role of traps. The faulty nature of the reservoir affects the arrangement of the fluids within it.
The maximum amplitude map SaIIf (Fig. 10) is found within the time window ± 5 ms. It is not expressive because the fluid content of the wells does not match with their amplitude responses in the highlighted areas. Considering for example the oil-filled wells IJ23, IJ402D, IJ404D, their amplitude responses are expected to be higher (that is, bright spots), instead they dim, that is low. However, the water-filled wells are seen to match very well with their corresponding low-amplitude responses except for the well IJ36D which does not match.
Discussion
The seismic attributes computed from seismic sections were used to qualitatively characterize the reservoir. The qualitative study includes the identification of the bright spot (high-amplitude anomalies) indicating the presence of oil and gas in the reservoir zone using the maps as illustrated by the work of Shenghong et al. (2009). Some maps matched with the fluid contents of the wells while others mismatched.
Figures 7 and 9 shows some of the maps whose amplitude responses match with their corresponding well fluid contents. In Fig. 8, some areas match perfectly well, while others do not. In these maps, their high-amplitude responses indicate gas and oil while the low-amplitude responses indicate the water. The same situations are observed in Tanveer (2012), as shown in Fig. 11. In Fig. 11b, the highlighted area label A1, A2, and A3 indicate bright spots which are similar to those in Fig. 11a. The results are also consistent with those of the Kinkkong gas reservoirs characterized by strong amplitude anomaly [O’Brien (2004) in Shenghong et al. (2009)]. Similar results have been obtained in some parts of the Niger Delta by Yakub et al. (2013) and Bagley et al. (2004) in the Foinaven, Schiehallion and Loyal fields, west of Shetland Islands. Therefore, it is possible to predict the presence of hydrocarbons using these attributes in the RDR Basin.

a IJ SaIIa maximum amplitude map; b RMS amplitude map (± 30 ms) Naust A (Tanveer 2012)
The rest of the maps are characterized by a mismatch between their corresponding attribute responses and the fluid content of the wells. There is no correlation between the attribute maps of the reservoirs and the corresponding fluid content of the wells, that is, the high-amplitude responses instead indicate water while the low-amplitude responses indicate oil. These maps do not therefore respect the conventional interpretation in the RDR Basin and cannot be used to confirm or predict the fluid properties of the wells. The mismatch indicated in Fig. 10 might originate from tight or hard rocks that look the same as hydrocarbon, the presence of degraded sand reservoir making the hydrocarbons to be of bad quality or more still a tuning effect (the small size of the reservoir) (Chiburis et al. 1993).
Conclusion
The aim of this work was to carry out an inventory of the different hydrocarbon reservoirs and their corresponding wells in the east of the RDR Basin using seismic attributes as guide. Seismic attributes (RMS and maximum amplitudes) within the framework of this research have been used to provide good information about the mapped reservoirs, identify new areas where wells could be drilled and improve reservoir characterization. It was observed that some attribute maps matched very well with the fluid content of the wells while there was a mismatched between other attribute maps and their corresponding well fluid contents. This could be related to the quality of the seismic data, induced by the presence of some artifacts, and some reservoir properties. This analysis helped to realize that the GH and WX concessions were the best concessions in the east of the RDR Basin since most of their reservoirs, especially WX S6.3 maximum amplitude map, matched with their well fluids contents.
References
Abolo M (2008) Geology and petroleum potential of the Mamfe Basin, Cameroon, Central Africa. Afr Geosci Rev 65–77
Bagley G, Saxby I, McGarrity J, Pearse C, Slater C (2004) 4D/time-lapse seismic: examples from the Foinaven, Schiehallion and Loyal Fields, UKCS, West of Shetland. Geol Soc Memoir 29:279–296
Beka F, Oti MN (1995) The distal offshore Niger Delta: frontier prospects of a mature petoleum province. In: Oti MN, Postma G (eds) Geology of deltas. A.A. Balkema, Rotterdam, pp 237–241
Brownfield ME, Charpentier RR (2006) Geology and total petroleum systems of the West Central province (7203) West Africa. U.S. Geological Survey, Bulletin 2207-c, p 57
Chiburis E, Franck C, Leaney S, McHugo S, Skidmore C (1993) Hydrocarbon detection with AVO. Oilfield Rev 5(1):42–50
Chopra SA, Marfurt KJ (2005) Seismic attributes—a historical perspective. Geophysics 70(5):3SO–28SO
Coughlin R, Bement W, Malony W (1993) A petroleum geology of the deltaic sequence, Rio Del Rey, offshore Cameroon. AAPG search and discovery article no 090990
Daber R, Aqrawi A, Schlumberger Limited (2010) Petrel 2010: interpreter's guide to seismic attributes. Schlumberger, Houston, p 247
Doust H, Omatsola E (1990) Niger Delta. In: Edwards JD, Santogrossi PA (eds) Divergent/passive margin basins, AAPG Memoir 48. American Association of Petroleum Geologists, Tulsa, pp 239–248
Evamy B, Haremboure JP (1978) Hydrocarbon habitat of Tertiary Niger Delta. Am Assoc Pet Geol 62:277–298
Friedrich N (2000) Common techniques for quantitative seismic interpretation, pp 168–200
Kearey P, Brooks M, Hill I (2002) An introduction to geophysical exploration: third edition, printed and bound in Great Britain by TJ International, Padstow, Cornwall, pp 3–45
Kumar KS (2012) Seismic evidence for fluid migration and gas accumulation in sediment formation beneath the giant Stroregga slide complex (Grip high 3D cube), pp 24–36
Longmore J, Lee J (2010) Africa oil and gas source 2010: Cameroon
Løseth H, Gading M, Wensaas L (2009) Hydrocarbon leakage interpreted on seismic data. Mar Pet Geol 26(7):1304–1319
Ntamak-Nida MJ, Sylvie B, Jean-Claude M, Francois B, Jean Engelbert M, Christophe IN, Guy Martin A (2010) Sedimentary and sequence stratigraphy from outcrops of the Kribi-Campo sub-basin: Lower Mundeck Formation (Lower Cretaceous, southern Cameroon). J Afr Earth Sci 58(1):18
O’Brien J (2004) Seismic amplitude from low gas saturation sands. Lead Edge 23:1236–1243
Perenco (2006; 2012) Perenco’s Documentation
Railsback (2011) Petroleum geosciences and subsurface geology. Department of Geology, University of Georgia Anthens, Georia 30602 2501, USA, pp 6–9
Rubio HS (2010) Enhancing geological interpretation with seismic attributes in the Gulf of Mexico. A Master thesis, University of Houston, pp 1–30
Shenghong T, Charles P, John PC (2009) Local frequency as a direct hydrocarbon indicator. In: SEG Houston International Exposition and Annual Meeting, pp 2160–2164
Short K, Stauble AJ (1967) Outline of geology of the Niger Delta. Am Assoc Pet Geol Bull 51:761–779
SNH (2010; 2015) SNH Documentation
Stacher P (1995) Present Understanding of the Niger Delta hydrocarbon habitat. In: Oti MN, Postma G (eds) Geology of deltas. A.A. Balkema, Rotterdam, pp 257–267
Tanveer A (2012) Shallow gas accumulation in glacigenic sedimentary formation of the mid-Norwegian margin north of Stroregga slide (Helland Hansen 3D cube), pp 6–15
Tuttle LW, Charpentier RR, Brownfield ME (1999) The Niger Delta Petroleum System: Niger Delta province, Nigeria, Cameroon and Equatorial Guinea Africa, USGS, Open-file Report 99-50-H
Tyler MN (2013) Application of 3D seismic attributes analysis Workflow: A case study from NESS county KANSAS, USA, B.S., Kansas State University, pp 1–30
Veeken PC (2006) Seismic stratigraphy, basin analysis and reservoir characterization, vol 31. Elsevier Science, Amsterdam, p 522
Villemin J, Tarreserence P (1990) Sedimentary basins of Carbon-Geology and Oil systems. American Association of Petroleum Geologists Memoir, Tulsa, pp 117–199
Yaqub OA, Joseph OE, Chukwuemeka NE (2013) DHI analysis using seismic frequency attribute on field-AN Niger Delta, Nigeria. J Appl Geol Geophys IOSR-JAGG 1(1):05–10
Author information
Authors and Affiliations
Corresponding author
Additional information
Publisher’s Note
Springer Nature remains neutral with regard to jurisdictional claims in published maps and institutional affiliations.
Rights and permissions
Open Access This article is distributed under the terms of the Creative Commons Attribution 4.0 International License (http://creativecommons.org/licenses/by/4.0/), which permits unrestricted use, distribution, and reproduction in any medium, provided you give appropriate credit to the original author(s) and the source, provide a link to the Creative Commons license, and indicate if changes were made.
About this article

Cite this article
Fozao, K.F., Fotso, L., Djieto-Lordon, A. et al. Hydrocarbon inventory of the eastern part of the Rio Del Rey Basin using seismic attributes. J Petrol Explor Prod Technol 8, 655–665 (2018). https://doi.org/10.1007/s13202-017-0412-5
Received:
Accepted:
Published:
Issue Date:
DOI: https://doi.org/10.1007/s13202-017-0412-5