
Abstract
By simulations of population growth exposed to environmental noise, we compared realised long-run growth rate of age structured populations of four different life histories, with four approximations. One approximation used a non-structured population model, including specific population growth rates for each time step, determined by actual vital rates, while the other three used age-structured data to estimate a ‘mean’ growth rate, then applicable for all time steps. In general, approximations were reasonable accurate. Yet some were completely erroneous and inaccurate enough to move stationary populations to become species on the red list as an endangered species according to International Union for Conservation of Nature (IUNC). The inaccuracies depended, in the following decreasing order, on: life history, what part of the demography the noise was acting on, and noise colour. The non-structured growth approximation had smaller errors with red noise while the three age-structured approximations had their largest errors with red noise. Since it is generally understood that the most common noise in nature is red noise, we conclude that the non-structured approximation will be the best predictor of population growth in most cases. We also conclude that evenness in distribution over age classes is a possible predictor for the sensitivity of long-run growth rate to type of approximation and therefore a promising object for further studies. Finally, our results indicate that in general, more focus ought to be on reducing the error in the data collection on population densities, especially for studies over longer time periods, than of collecting age-specific data.
Introduction
Much applied ecological work is concerned with analyses of the status of a population. Will the population decrease or increase in the future? What is the risk of extinction or explosive growth? Population growth rate is then a fundamental basis for estimations (Sibly et al. 2003). The long-run growth rate, the resulting growth rate during an extended period of time, is a crucial measure of the long-term status of a population (Cohen 1979; Lande et al. 2003; Tuljapurkar and Orzack 1980). In population viability analyses (PVA), it is a common practice to estimate population growth rates by separating environmental and sampling errors from population count data (Morris et al. 1999). Yet, it is a challenging task to estimate long-run growth rate in a stochastic environment since both demographic and environmental variability affect short-term growth rates and age structure. Variability itself can also be complicated due to temporal correlations. In addition, data scarcity is a chronic problem. The most common type of data is often count data because demographic data is more difficult to collect. Demographic data also tend to include fewer years than count data (Morris et al. 1999). Thus, if there are useful reliable approximation shortcuts where available data is sufficient, these methods are most welcome. Here, we examine four approximations of long-run growth rate and discuss under which conditions they can be reliable. We compare the values of realised growth rate of explicitly age-structured populations (the true population) from numerical simulations with estimations from four approximations of long-run growth rate: (1) a scalar model using the dominant eigenvalue of the age structured transition matrices as time-specific growth rates, (2) the dominant eigenvalue of the mean transition matrix and finally two approximations with the dominant eigenvalue of the mean matrix yet also adding small noise approximations where (3) one is without and (4) one with correlated noise (Tuljapurkar 1982). Thus, we test how large discrepancies in the growth rates there will be for the different approximations compared to the simulated true populations.
The first approximation (1) is estimated by consecutive non-structured population growth approximations using the dominant eigenvalue of transition matrices, one matrix for each time step, while the other three approximations (2–4) include age-structured data as ‘means’ over the time series by using the mean transition matrix. This set of approximations can be used to test whether age structured population growth can be approximated by non-structured estimations, that is approximations (1–4) or if numerical simulations with explicit age-structured populations are crucial. If approximations are applicable, the study also analyses whether one can estimate a ‘mean’ growth rate applicable on all time steps (approximations 2–4) or if one can find estimates that relate to the environmental conditions (approximation 1), i.e. an estimate for each t. Approximations using mean growth rate over time, or using growth rate each time steps, will affect on how to analyse empirical data and under what conditions predictions can be made.
Increased fluctuations in a vital rate is generally expected to reduce long-run growth rate in a population, since we thereby expect a larger variation in population growth rate which implies reduced long-run growth rate (May 1973; Tuljapurkar and Orzack 1980). Note that this is under the assumption that the transformation from variation in vital rate to growth rate does not skew the distribution towards high rates. However, there are differences between life histories in their sensitivity to variation in specific vital rates (Caswell et al. 1999; Jonsson and Ebenman 2001; Lande 1988). Pattern of environmental noise is also critical for the resulting population dynamics (Halley and Kunin 1999; Petchey et al. 1997; Ripa and Lundberg 1996). White noise has been the statistically simplest and is the theoretically preferred form to model environmental fluctuations. It is defined as a constant variance per unit frequency—in analogy with white light that contains all wavelengths with equal intensity. Frequency is here to be interpreted as the frequency of perturbations (Haefner 1996; Pimm 1991). In contrast to white noise, red noise causes a temporal correlation in the trait values it affects (so called autocorrelation). Many long-term studies of natural population dynamics show red noise (Lawton 1988; Pimm and Redfern 1988). In addition to white or red noise, there might be a possibility of blue external noise (Constantino et al. 1995) from interspecific relations with species that express chaotic or unstable dynamics. In this study, we will thus span the environmental variation from blue to red noise and also test different levels of variance.
Theory has discussed under which circumstances age-structured populations can be condensed into non-structured populations and when analytical solutions are possible (Caswell 2001; Engen et al. 2007; Engen et al. 2005; Tuljapurkar 1989; Wennergren et al. 1995). If population dynamics can be approximated with a scalar non-structured model, estimations of long-run growth rates can simply be calculated in terms of consecutive measures of densities. Note that, this is under the assumptions that the population is at actual stable age structure or close enough to cause only minor error. A stable stage structure will appear if the environment is constant. Under a slowly changing environment, a stage structure with only minor deviations from actual stable age structure can be formed. Since environmental fluctuations characterised as red noise correspond to a slow-changing environment, we may expect that populations under this type of fluctuation regime will closely track actual stable age structure. This expected phenomenon can be related to the classical study of Roughgarden (1979) which showed that a non-structured population may track carrying capacity in a red noise environment. Questions then arise—are there any specific life histories or noise patterns, or combinations of the two that are less sensitive to approximations? Would it be possible to replace a complicated age-structured approximation model with the non-structured scalar approximation? This is a complex nonlinear issue and it is still unclear if we always have to include both data on the pattern of environmental variation as well as on population structure when calculating population dynamics (Foley 1994). Here, we classify life histories and species according to their sensitivity to approximations of growth rate given some environmental variation. We can rank the life histories and get guidance on when to choose the full age-structured matrix model, some age-structured approximations or the simple non-structured growth model.
Methods
Age-structured population model
Our ‘true’ populations, to which we compared the approximations of long-run growth rate, were explicitly age-structured populations modelled by discrete time matrix computer simulations (Caswell 2001). The structure of the populations were represented by a column vector, N(t), and the populations were projected forward through time by a transition matrix, A(t), that consisted of the age- and time-specific demographic rates (survival, growth, development and fecundity):
Our focus was on variation over time in demographic rates, regardless of its origin (density dependence, or one-way effects from abiotic factors, such as weather). Feedback, as in density dependence models, was not included, yet it might partly be represented in the pattern of variation that we tested. When feedback is included in population dynamics, a different kind of variation in population densities can appear. For example, negative feedback, as density dependence, can result in fluctuating population densities characterised as blue noise. In this study, blue noise was included, but extreme events in population densities, as those originating from catastrophes, was not included. Catastrophic variation can move population density swiftly away from a stable state, such as a population at its carrying capacity.
Four completely different synthetic life histories with reference to real species were constructed; URSUS, CALIDRIS, ECTOTHERM and INSECT. The choice to use constructed data was made for practical reasons. That is, it was more straightforward to compute relevant data than to find the kind of data needed. Qualitative analyses and results are all the same independent of whether the data is synthetic or real. Yet, we were inspired by data from literature to construct these life histories (Hildén 1978, Shine and Schwarzkopf 1992, Wennergren and Landin 1993, Freedman et al. 2003). As in the classical work of Lewontin (1965), we used piecewise linear functions to represent the life histories. Fecundity and survivorship were thus divided into phases. One phase corresponded to a specific age interval. Within each phase, fecundity and survival increases or decreases (or are constant) linearly by age classes, hence has a constant rate (for aphids, Wennergren and Landin 1993; for colembola, Grégoire-Wibo 1983; and more generally, Lewontin 1965; Wennergren et al. 1995). The specific age class rates are presented in Table 1. Note that these are rates at the mean environmental condition. The URSUS life history mimicked a relatively long-lived species with high survival rates and a constant low fecundity. CALIDRIS had a shorter life length and lower survival rates, and also a relatively low fecundity which is constant with adult age. ECTOTHERM corresponded to a life history with shorter life length and much lower survival rates but higher fecundity compared to URSUS and CALIDRIS. Its fecundity had an asymptotic pattern with lower values for young adults increasing to a constant value for older adults. INSECT mimicked a short-lived organism with low survival rates and very high fecundities. Its fecundity had a triangular shape with an optimum age where fecundity peaked. This life history had age classes of weeks while the other three had years.
From the vital rates, we calculated three characteristics of the life histories: net reproductive rate, R0, (the mean number of offspring for one individual during life time), evenness of stable age class distribution, H, and generation time, G, as well as matrix calculation of the dominant eigenvalue, λ1 (Table 1). We used discrete models; hence, rates were by time steps and note that a rate of one implies zero growth. To be consistent, we will refer to rates per time step as λ’s. Also note that even though the long-run growth rate is one, this does not imply that the rate in a constant environment with vital rates held at mean environmental condition is one.
One may expect that such an average environment may generate a rate close to, but not exactly, one (Caswell 2001). The life histories could potentially be ranked by their reproductive rate R0 that is the mean number of offspring produced by one individual during its life time calculated as:
where li is the probability of survival to age i and fi the fecundity (number of produced offspring) at age i and x the number of age classes. Yet, the reproductive rate could not be a suitable candidate as a predictor in this case since there are only minor differences in net reproductive rate between life histories (Table 1). Life histories could instead possibly be ranked by their stable age distribution, that is how even the population is distributed over its age classes, calculated by the Shannon diversity index, Hs, (Magurran 2004) normalised with the number of age classes:
where the proportion of individuals in age class i is denoted pi. An index of one means that the population is completely evenly distributed over the age classes and a value decreasing towards zero means an increasingly uneven distribution. We estimated generation time, G, as the juvenile period (initial age classes with zero fecundity) plus half of the adult period (half of all age classes after the juvenile period). Since long-run population growth rates were adjusted to one (see below) we decided not to use the most common measures of generation time (Begon et al. 1990) since zero rates, logλ, implies zero in the denominator. Our choice of estimation of generation time relates to the estimation by Charlesworth (1994). It is a measure easily assessed by common knowledge of a species or by simple field studies. The estimates of Hs and G (Table 1) show that these constructed life histories of URSUS, CALIDRIS, ECTOTHERM and INSECT span over uneven to even stable age structure and short to long generation time.
Variability was incorporated into the vital rates as a modified 1/fγ-noise (Halley 1996; Halley and Kunin 1999; Mandelbrot and Wallis 1969). It was considered as environmental stochasticity, or noise, although the variation appeared in the vital rates. The 1/fγ-noise has previously been measured for a variety of empirical ecological data and produces a fairly good model of environmental noise (Lindström et al. 2012; Vasseur and Yodzis 2004). To model 1/fγ-noise, we applied a method commonly used in electrical engineering and signal theory (Oppenheim and Schafer 1989). In short, different colours of noise were generated by transformations of white noise using a one-dimensional digital filter, also termed as fractional differencing (see Appendix). The exponent of the frequency was constrained to integer values in the range – 2 ≤ γ/2 ≤ 2. The environmental noise thereby spanned from high frequency/blue noise/high negative autocorrelation to low frequency/red noise/high positive autocorrelation. The method allowed mean and variance in fluctuations to be preserved as of the original white noise. Thus, we could perform comparison between times series with different noise colour controlling for mean and variance. The demographic rates shown in Table 1 were under mean environmental conditions.
Given a long enough time series of total population densities, Ntot(t), a growth rate per time unit denoted the long-run growth, rate can be calculated (Heyde and Cohen 1985):
where T is the length of the time series.
The realised long-run growth rate of the four synthetic life histories in this study were calculated using simulations of the matrix age class model (Eq. 1) to determine Ntot(T). Since we used discrete time steps and matrix models we used eigenvalues, and hence to be consistent, we refer to rates for a single time step, i.e. λs as the long-run growth rate. This rate is thereby one when there is zero arithmetic growth rate. The simulations were made for different scenarios of noise pattern and each simulation ran for 1000 time steps, hence T = 1000. Noise was either targeted on juvenile survival, adult survival or fecundity. Five noise colours were tested: highly reddened (γ = 4), reddened (γ = 2), white (γ = 0), blue (γ = − 2) and deep blue (γ = − 4). Three levels of noise magnitude were examined with a coefficient of variation (CV) in the noise time series of 0.1, 0.2 or 0.3, leading to a total of 45 different noise pattern scenarios for each life history (see Appendix for specific details). Initial density was set to 1010 to assure that populations would not crash, due to high variances in growth rates, during the 1000 time steps. The simulations started at stable age structure of the mean environmental condition to avoid significant initial transient dynamics. To simplify comparison of the error, Eq. 10, when approximating the rate for the different life histories and patterns of noise, we ensured that for each scenario, the long-run growth rate equalled to one. That is, we standardised the realised long-run growth rates to one between scenarios such that the effect of unequal long-run growth rate was eliminated. We decided to do this since this study focuses on the effects of noise colour and life histories, not on differences in long-run growth rate between life histories. From the seminal works of Roughgarden (1979) and May (1974), we know that growth rate and noise colour interfere a lot. Hence, our aim was to assure equal rates between scenarios and life histories. Say that the long-run growth rate for a scenario is larger than one then a slight reduction in survival rate may adjust the long-run rate to one. We applied the adjustment of survival only to the first age class so as to not interfere too much with the evenness in the age class distribution. We used the Matlab function fzero to numerically estimate the adjustment in survival rate (see also Appendix). This evidently gave a minor difference in survival rate between scenarios. Detectable adjustments appeared when a scenario generated large variation in growth rates (May 1973) which is generally expected to happen when juvenile survivorship or reproduction at early age is affected (Lewontin 1965). For all life histories, the adjustment was in the order of 10−2 or less. We did not find any qualitative differences in the analysis of approximations when running the setup with or without adjusted survival. Each simulation set-up of the different scenarios and life histories was replicated 10 times, using different environmental time series, generating a total of 1800 values on ‘true’ long-run growth rate, a total of 7200 datapoints. This set of simulations runs showed significant differences among the approximations in the statistical analyses, ANOVA and regression tree analysis, thus indicated a sufficient set of runs.
Details on the approximations of long-run growth rate
The realised long-run growth rates were compared with simulations using four approximations of population growth. The first approximation used scalar growth rate which implies that the growth rate at time t only depended on population density and the environmental condition at time t. This means that age classes were not included and it also refers to the theory of growth under stable constant conditions. If conditions are constant, it can be shown that the growth of a population with overlapping generations and age classes can be described by the dominant eigenvalue, λ1, of the transition matrix A, that is the Perron-Frobenius theorem (see Caswell 2001 for an overview) such as in Eq. 1. By assuming that the population structure could be approximated to the actual stable age structure at each time step, population density at time T was approximated by a multiplication of a time series of eigenvalues:
Stable age structure refers to actual stable age structure related to λ1(t). We denote this approximation as scalar growth since it involves scalar multiplication instead of matrix multiplication. Note that for each time step, the matrix of that time step was used when calculating the eigenvalue. For each environmental condition, i.e. set-up of vital rates (see Appendix for specific details), the growth rate was calculated as the eigenvalue and later used in the simulation, here, estimated by calculating the eigenvalues. In an applied setting, one can use changes in population density along a gradient that affect vital rates to calculate the growth rates. We calculated the growth rate by using the long-run growth rate equation (Eq. 4), yet on the final population density of the scalar growth.
In this case, the long-run growth rate equals the mean of lnλi(t). The second approximation of the long-run growth rate is also a scalar approximation, yet only use one eigenvalue which is the dominant eigenvalue of the mean matrix. The mean matrix, \( \overline{\mathbf{A}} \), contains the mean values \( \overline{a_{ij}} \) of the ij vital rates over the time period T.
Both these approximations are scalar and do not explicitly use the age structure to calculate the growth rate. Indirectly they do, yet with some assumptions: the first assumes that actual age structure is close the stable age structure yet specific for each time step while the second assume that the age structure is constant, or irrelevant, and therefore equals that of the mean matrix. We termed the first approximation ‘scalar’ and the second ‘mean matrix’.
However, changes in the vital rates may also influence the structure of the population. In addition, the pattern of environmental variability (noise) can have significant effect on population dynamics. Stable age distributions may therefore not always be maintained. Population growth rate is thus determined both by the current environmental situation and the age structure. Age structure is, in turn, a product of past events and may not reach the stable stage structure set by the parameters at the specific time, i.e. the age structure is perturbed away from the predestined stable structure. In the scalar approximation, this was handled by assuming that the perturbation from stable age structure given the vital rates at that time was negligible. While for the mean matrix model, Tuljapurkar (1982) developed an approximation of the long-run growth rate, yet acknowledging the effect of age structure, that he termed a (also termed the dominant Lyapunov exponent (Ebenman et al. 1996; Ferriere and Gatto 1995; Metz et al. 1992). This approximation is decomposed into the contribution of (i) the mean matrix as in approximation 2, (ii) one-period fluctuations due to variances and covariances in the vital rates, τ, and (iii) two-period temporal correlations in vital rates, θ.
The third approximation is hence denoted ‘small noise’, ln λapprox3, and includes (i) and (ii). Thus, this approximation consider the internal fluctuations, variance and covariance, in and between vital rates respectively, due to non-stable age structure dynamics. We denote the fourth approximation ‘small noise temporal’, ln λapprox4, and it included all three components (i)–(iii), and also temporal autocorrelation in vital rates due to environmental noise, which is represented by the extra term in Eq. 9. These two approximations are estimated while assuming small noise, which is a minor variance in growth rates as a result of linearization. For a detailed description, see Tuljapurkar (1982) and Caswell (2001).
The scalar approximation, ln λapprox1, is a measure made by consecutive approximations while the other three, ln λapprox2, ln λapprox3 and ln λapprox4, are made as a single approximation valid through the whole time period T.
Output data
To facilitate the interpretation of our results, the rates will be presented and analysed as λ values. A rate of 1.08 is then a growth of 8% during a time step while 1.00 is non-growth. Our life histories are adjusted, using juvenile survivorship, to each set-up such that the expected long-run growth rate is one. Hence, the matrix model (Eq. 1) results in λs = 1, and we can easily deduce the error directly from estimates of long-run growth rates.
We can therefore use the increase or decrease, in the approximations compared to the expected long-run growth rate, as a denotation of the error of the approximation. A value above one indicates an overestimation and below one an underestimation. Doak et al. (2005) used bias as a term for the discrepancy from expected value. Our life history adjustment makes it possible to compare different scenarios quantitatively.
To define which approximations of population growth that are good enough, or deficient, is not a trivial task. We therefore compared approximations results with the definitions of endangered and vulnerable populations according to IUCN. Note that, the expected long-run growth rate is one and hence, the populations are expected to be variable yet around initial conditions. A severe error was defined as when an approximation of growth rate generated a population size after three generation times that had a reduction or increase of 50%. At 50% difference or more, the approximations would wrongly define a stable population as endangered according to IUCN. A 30% discrepancy was defined as a major error. A reduced population density of 30% is considered to be a vulnerable population according to IUCN. We further defined a substantial error as a prediction that reduces, or increases, the population size by 15% or more, which is halfway to the reduction for a vulnerable population. Hence, to more literally illustrate the resulting precision, or error of the approximations, we converted the approximated long-run growth rate values into three generation time approximations (η):
Represented as a percentage error, δ, this can be calculated as.
Generation time, G, was approximated as the juvenile period plus half of the adult period (Charlesworth 1994), see further explanation in the “Methods” section “Age-structured population model” above. Furthermore, our environmental variation spans from small variation to substantial. The error of the approximation, δ, will therefore span from close to zero to severe.
We used ANOVA (Statistica version 5.5) to disentangle relative impact on approximation error of the different factors (the explanatory variables): the type of life history, on which vital rate environmental noise is targeted, noise colour and magnitude of noise. Impact were analysed by the percentage of the total sum of mean squares, the same technique as in for example Doak (1989) or Kallimanis et al. (2002). We also performed a regression tree analysis to further explore the influence of the explanatory factors (Death and Fabricus 2000). The analysis was made by the default setting in STATISTICA Dataminer 7.1, as a general classification/ regression tree models, with a 10-fold cross validation.
Results
The approximations of long-run growth rate are in general doing well since 81% of the 7200 values had a discrepancy less than 15% in three generations compared with the population size of the ‘true’ age structured populations (Fig. 1 and Table 2). Yet, some approximations turn out to be severe and even completely erroneous, especially for the three approximations using a mean matrix, i.e. λapprox2, λapprox3 and λapprox4. The most extreme approximation predicted that the population would increase 50 times its initial density within three generations, while it should neither grow nor decrease. Thus, the results indicate that in most cases, any approximation is safe, yet we need to disentangle when it can be severely erroneous.

Accuracy of the different long-run growth rate approximations shown as the three generation approximation value (η). A value of one is equal to a perfect match, a larger value indicate an approximated increase and a lower value a decrease in population growth. Black boxes hold 75% of the values and the vertical lines 95%
From Table 2, we can see a clear difference in the precision of approximations between life histories. For the life history URSUS, only 1% of the populations show substantial errors while ECTOTHERM show substantial errors or worse in 55% of the populations.
The sum of squares in the ANOVA indicates that 26% of the errors in the approximations of long-run growth rate are explained by different life history characters and 16% by the noise target on the vital rates (Fig. 2). Interactions between explanatory factors have considerable effects and explain 41% of the variation.
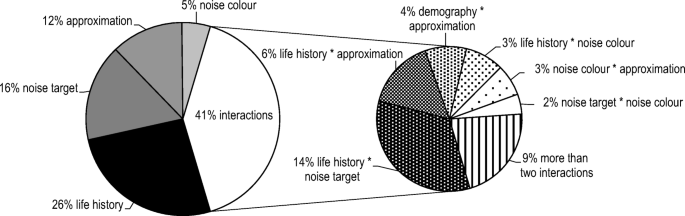
The proportion of the total sum of squares (ANOVA) of explanatory factors of long-run growth rate approximation errors. The left pie chart shows the importance of individual factors except the 41% that is the total explanation fraction of different combinations of explanatory factors. The right pie chart shows the importance of combined explanatory factors
The regression tree analysis reveals more details on how long-run growth rate approximations depend on the explanatory variables (Fig. 3). The first split turned out to be life history as expected from the sum of squares in the ANOVA. The ECTOTHERM life history is placed in one group with higher mean of approximation error, δ = 30%, and the other three life histories in the other group with lower mean error, δ = 1%. Hence, the long-run growth rate of the ECTOTHERM life history is the most difficult to approximate and long-run growth rate is often overestimated when erroneous. The ECTOTHERM life history is further split by the type of approximation. The scalar approximation, λapprox1, is found in one group performing better, δ = − 28%, then the other approximations, δ = 50%. The last split occurs for noise target. Adult survivorship shows a low error, fecundity some and juvenile survival the largest with δ = 210% with a variance of 129.

Regression tree analysis made on λapprox. N number of populations/samples, Mu mean value of approximation results, Var variance in Mu. Tested explanatory factors are life history (URSUS, CALIDRIS, INSECT, ECTOTHERM), noise target (juvenile survival, adult survival or fecundity), noise colour (highly reddened, reddened, white, blue or deep blue), noise magnitude (CV = 0.1, 0.2 or 0.3) and approximation (scalar, mean matrix, small noise, small noise temporal)
Regardless of the approximation method, approximation error in long-run growth rate decreases with a more even distribution over age classes (Fig. 4a). The scalar method, λapprox1, underestimates while the other three, λapprox2, λapprox3 and λapprox4, overestimate long-run growth rate. Variability in juvenile survivorship leads to the most profound errors (Fig. 4b). The approximations depend differently on noise colour (Fig. 4c). The scalar approximation has a more profound error in blue to white noise than in red noise while the other three approximations show the opposite pattern by being less accurate in red noise than in blue to white noise (Fig. 4c). The most complex approximation, λapprox4, is slightly more accurate than λapprox2 and λapprox3. Hence, any comparison of long-rung growth rates between species and populations can be fairly complicated since the accuracy of approximations is a complex dependence on life history and noise colour.

Median error in approximations λapprox in relation to a evenness in age structure, b which vital rate that is effected by environmental variability and c the colour of noise of environmental variability
In summary, the main results of this study are (i) errors can be substantial but in general they are insignificant, (ii) the type of life history has a significant effect on the accuracy of approximations, (iii) variability in juvenile survivorship leads to the largest approximation errors, (iv) there is a significant interaction between noise colour and type of approximation, (v) the scalar approximation differ in error pattern from the other three approximations and finally (vi) evenness in age structure correlates with error and hence is a possible predictor for sensitivity to approximations. The most error-susceptible life history was ECTOTHERM, with its short life length, low survival rates and high fecundity.
Discussion
Testing four approximations of long-run growth rate bring some good news. In most of the examined cases all approximations estimate the long-run growth rate sufficiently well. This is also to some degree supported in a study by Fieberg and Ellner (2001) where they reviewed how well stochastic matrix models could predict fabricated empirical data. Their study showed that a version of Tuljarpurkar’s small noise approximation (Tuljapurkar 1982) was a good predictor. A further encouraging result is the potential to use characteristics of life histories to determine what, and if, approximations can be applied. Evenness in stable age structure show correlation with degree of approximation errors. Life histories with more uneven distribution of individuals among age classes produced higher errors in all approximations. In those cases, it will be crucial to use a full age structured model instead. Although this is not a complete study of all possible life histories, the pattern is clear. Evenness in age structure seems to be promising for evaluation of when there is a need of a full structured model. Age structure can be collected directly from field data. Furthermore, we expect that the estimates can be made on ‘mean’ demographic data, as in our study, which reduce the empirical burden compared to a full set of time-dependent demographic rate.
However, our results also clearly show that there are certain characteristics in interactions between type of life history and noise where inaccuracy can be substantial. For example, in the life history ECTOTHERM 31% of all the tested populations and approximations showed severe errors with large discrepancies in predicted long-run growth rates compared to the ‘true’ values. Erroneous predictions in such magnitudes may lead to highly inaccurate management interventions due to overlooked needs, which in turn might lead to unnecessary costs or unwanted population extinction or explosion. Doak et al. (2005) focused on how to sample and use empirical demographic data to make valid predictions. They used small noise approximations to estimate the number of samples needed in a study. They could show that this approximation overestimate the rates if one include moderate to large stochasticity in the vital rates although they did not test for different noise patterns.
A comparison between the non-structured, scalar approximations versus the other three, structured approximations reveals quite large differences in behaviours. The non-structured scalar approximation led, in general, to underestimations of long-run growth rate while the other approximations led to overestimations. A closer look demonstrates that these behaviours are strongly associated with the colour of environmental noise. The scalar approximation works very well with a reddened noise (high degree of temporal positive autocorrelation) but underestimates with blue or white noise, while the other three approximations, that are based on age-structured data as means over the time series, show the opposite, with higher errors in red noise than in white or blue noise. In line with these results are the comparisons of scalar and matrix models for predictions of population decline made by Dunham et al. (2006). They showed that the scalar model overestimates the risk of decline in a white stochastic environment. An explanation for the behaviour of the scalar approximation probably lies in the fact that the scalar approximation has an implicit assumption of stable age structure through time, and with red noise the autocorrelation is high enough to enable the age structure to convert to stable structures (Roughgarden 1979). In white and blue noise, on the other hand, the scalar approximation will overestimate the variation in growth rates since the scalar approximation includes too much variation in the growth rate due to the assumption of stable stage structure, which is not met in these cases. The mean matrix approximation likewise implicitly assumes a stable age structure, but also no explicit variability in vital rates through time. The approximation will therefore disregard decreased growth due to variance in the growth rates (Tuljapurkar and Orzack 1980) which leads to overestimation of long-run growth rates. The two small noise approximations have the greatest errors in long-run growth rate with red noise. These approximations may then overestimate the long-run growth rate since they do not have the capability to capture long-term variation in vital rates or age structure. In accordance, studies on extinction risk show that red noise increases the risk compared to white noise in single populations models (Heino et al. 2000; Lögdberg and Wennergren 2012), due to long-term reduction in population density. Thus, using small noise approximations may be potentially and severely inaccurate in viability analysis. Note also that, adding a temporal correction term as in λapprox4 reduce the error only in negatively autocorrelated noise that is blue noise, which is regarded as uncommon in nature.
We have shown that the accuracy of an approximation is highly dependent on the life history of the species. Some interactions between type of life history and noise can lead to substantial inaccuracy. Variability in juvenile survivorship led to the highest approximation errors, which is in line with Lewontin’s work (Lewontin 1965) on fitness. Different effects of variation on altered vital rates on long-term population dynamics have also been shown earlier (Engen et al. 2007; Jonsson and Ebenman 2001). A conclusion we draw, in agreement with Fieberg and Ellner (2000), is that it might be more fruitful for general research to investigate interactions between population dynamics and environmental variation rather than putting all effort on population viability analysis on single populations one at a time (see also, Ludwig 1999). Our result is somewhat promising since red noise is common in empirical data (Ariño and Pimm 1995; Halley 1996; Miramontes and Rohani 1998; Petchey 2000; Steele 1985; Sugihara 1995). For field studies, our study indicates that it may be sufficient with a time series of population densities to approximate the long-run growth rate since that is analogous to the scalar approach. Yet, to address this question properly, one has to analyse the rates given by change in densities instead of by the approximations in our study.
Extreme events, often termed catastrophes, are not included in this study. Such large disturbances may have more impact on the age structure and are, by definition, not applicable for small noise approximations. This is most obvious when the catastrophic event is acting unevenly on vital rates. Hence, the four approximations in this study are most probably not useful when catastrophic events are present and age structured modelling is most probably a necessity. Still, the results could be useful for moderate ‘catastrophes’. But to verify this, and define the limits of moderate, one needs to generate a specific set of simulations. Also note that density dependence may generate patterns more close to catastrophic events since populations may be at equilibrium over longer periods of time with only few events of disturbances that alter the density. When it comes to several species and interactions, this may become even more complex since some species in the same food web may track the environmental variation while others are almost constant over time (Gudmundson et al. 2015).
References
Ariño A, Pimm SL (1995) On the nature of population extremes. Evol Ecol 9:429–443
Begon M, Harper JL, Townsend CR (1990) Ecology - individuals, populations and communities, 2nd edn. Blackwell Scientific Publication, London Chapter 4
Caswell H (2001) Matrix population models, 2nd edn. Sinauer Associates Inc., Sunderland
Caswell H, Fujiwara M, Brault S (1999) Declining survival probability threatens the North Atlantic right whale. Proc Natl Acad Sci 96:3308–3313
Charlesworth B (1994) Evolution in age structured populations. Cambridge University Press, Cambridge
Cohen JE (1979) Ergodic theorems in demography. Bull Am Math Soc 1:275–295
Constantino RF, Cushing JM, Dennis B, Desharnais RA (1995) Experimentally induces transitions in the dynamic behaviour of insect populations. Nature 375:227–230
Death G, Fabricus KE (2000) Classification and regression trees: a powerful yet simple technique for ecological data analysis. Ecology 81:3178–3192
Doak D (1989) Spotted owls and old growth logging in the Pacific Northwest. Conserv Biol 3:389–396
Doak DF, Morris WF, Pfister C, Kendall BE, Bruna EM (2005) Correctly estimating how environmental stochasticity influences fitness and population growth. Am Nat 166:14–21
Dunham AE, Akçakaya R, Bridges TS (2006) Using scalar models for precautionary assessments of threatened species. Conserv Biol 20(5):1499–1506
Ebenman B, Johansson A, Jonsson T, Wennergren U (1996) Evolution of stable population dynamics through natural selection. Proc Biol Sci 263:1145–1151
Engen S, Lande R, Saether B-E, Weimerskirch H (2005) Extinction in relation to demographic and environmental stochasticity in age structured models. Math Biosci 195:210–227
Engen S, Lande R, Saether B-E, Festa-Bianchet M (2007) Using reproductive value to estimate key parameters in density-independent age structured populations. J Theor Biol 244:308–317
Ferriere R, Gatto M (1995) Lyapunov exponents and the mathematics of invasion in oscillatory or chaotic populations. Theor Popul Biol 48:126–171
Fieberg J, Ellner SP (2000) When is it meaningful to estimate an extinction probability? Ecology 81:2040–2047
Fieberg J, Ellner SP (2001) Stochastic matrix models for conservation and management: a comperative review of methods. Ecol Lett 4:244–266
Foley P (1994) Predicting extinction times from environmental stochasticity and carrying-capacity. Conserv Biol 8:124–137
Fowler M, Ruokolainen L (2013) Confounding environmental colour and distribution shape leads to underestimation of population extinction risk. PLoS One. https://doi.org/10.1371/journal.pone.0055855
Freedman AH, Portier KM, Sunquist ME (2003) Life history analysis for black bears (Ursus americanus) in a changing demographic landscape. Ecol Model 167:47–64
Grégoire-Wibo C, Snider RM (1983) Temperature-related mechanisms of population persistence in Folsomia candida and Protaphorum armata (Insecta: Collembola). Pedobiol 25:413-418.
Gudmundson S, Eklöf A, Wennergren U (2015) Environmental variability uncovers disruptive effects of species interactions on population dynamics. Proc R Soc Lond B 282:67–75
Haefner JW (1996) Modeling biological systems. Principles and applications. Chapman & Hall, New York
Halley JM (1996) Ecology, evolution and 1/f-noise. Trends Ecol Evol 11:33–37
Halley JM, Kunin WE (1999) Extinction risk and the 1/f-family of noise models. Theor Popul Biol 56:215–230
Heino M, Ripa J, Kaitala V (2000) Extinction risk under coloured environmental noise. Ecography 23:177–184
Heyde CC, Cohen JE (1985) Confidence intervals for demographic projections based on products of random matrices. Theor Popul Biol 27:120–153
Hildén O (1978) Population dynamics in Temminck’s stint Calidris temminckii. Oikos 30(1):17–28
Jonsson A, Ebenman B (2001) Are certain life histories particularly prone to local extinction? J Theor Biol 209:455–463
Kallimanis AS, Sgardelis SP, Halley JM (2002) Accuracy of fractal dimension estimates for small samples of ecological distributions. Landsc Ecol 17:281–297
Kasdin NJ (1995) Discrete simulation of colored noise and stochastic processes and 1/fα power law noise generation. Proc IEEE 83:802–827
Lande R (1988) Demographic models of the northern spotted owl (Strix occi-dentalis caurina). Oecologia 75:601–607
Lande R, Engen S, Sæther B-E (2003) Stochastic population dynamics in ecology and conservation. Oxford University Press, Oxford
Lawton JH (1988) More time means more variation. Nature 334:563
Lewontin RC (1965) Selection for colonizing ability. In: Baker HG and Ledyard G (eds ) The genetics of colonizing species. Academic Press, New York, pp 77–91
Lindström T, Sisson SA, Håkansson N, Bergman K-O, Wennergren U (2012) A spectral and Bayesian approach for analysis of fluctuations and synchrony in ecological datasets. Methods Ecol Evol 3:1019–1027. https://doi.org/10.1111/j.2041-210X.2012.00240.x
Lögdberg F, Wennergren U (2012) Spectral color, synchrony, and extinction risk. Theor Ecol 5:545–554
Ludwig D (1999) Is it meaningful to estimate a probability of extinction? Ecology 80:298–310
Magurran AE (2004) Measuring biological diversity. Blackwell, Oxford, pp 106–108
May RM (1974) Biological populations with nonoverlapping generations: stable points, stable cycles, and chaos. Science 186 (4164):645-647
Mandelbrot B, Wallis J (1969) Some long-run properties of geophysical records. Water Resour Res 5:321–340
May RM (1973) Stability in randomly fluctuating versus deterministic environments. The American Naturalist 107(957): 621-650.
Metz JAJ, Nisbet RM, Geritz SAH (1992) How should we define “fitness” for general ecological scenarios? Trends Ecol Evol 7:198–202
Miramontes O, Rohani P (1998) Intrinsically generated coloured noise in laboratory insect populations. Proc R Soc London, Ser B 265:785–792
Morris W, Doak D, Groom M, Kareiva PM, Fieberg J, Gerber L, Murphy P, Thomson D (1999) A practical handbook for population viability analysis. The Nat. Conserv, Washington, DC
Oppenheim AV, Schafer RW (1989) Discrete-time signal processing. Prentice-Hall, Englewood Cliffs, pp 311–312
Petchey O (2000) Environmental colour affects aspects of single-species population dynamics. Proc R Soc London, Ser B 267:747–754
Petchey OL, Gonzalez A, Wilson HB (1997) Effects on population persistence: the interaction between environmental noise colour, intraspecific competition and space. Proc R Soc London, Ser B 264:1841–1847
Pimm SL (1991) The balance of the nature. Ecological issues in the conservation of species and communities. The University of Chicago Press, Chicago
Pimm SL, Redfern A (1988) The variability of animal populations. Nature 334:613–614
Plaszczynski S (2007) Generating long streams of 1/fα noise. Fluctuation Noise Lett 7:R1–R13
Ripa J, Lundberg P (1996) Noise colour and the risk of population extinctions. Proc R Soc London, Ser B 263:1751–1753
Roughgarden J (1979) Theory of population genetics and evolutionary ecology: an introduction. Macmillan, New York
Shine R, Schwarzkopf L (1992) The evolution of reproductive effort in lizards and snakes. Evolution 46(1):62–75
Sibly RM, Hone J, Clutton-Brock TH (2003) Wildlife population growth rates. Cambridge University Press, Cambridge
Steele JH (1985) A comparison of terrestrial and marine ecological systems. Nature 313:355–358
Sugihara G (1995) From out of the blue. Nature 378:559–560
Tuljapurkar SD (1982) Population dynamics in variable environments. III. Evolutionary dynamics of r-selection. Theor Popul Biol 21:141–165
Tuljapurkar SD (1989) An uncertain life: demography in random environments. Theor Popul Biol 35:227–294
Tuljapurkar SD, Orzack SH (1980) Population dynamics in variable environments I. Long-run growth rates and extinction. Theor Popul Biol 18:314–342
Vasseur DA, Yodzis P (2004) The color of environmental noise. Ecology 85:1146–1152
Wennergren U, Landin J (1993) Population growth and structure in a variable environment. I Aphids and temperature variation. Oecologia 93:394–405
Wennergren U, Ruckelshaus M, Kareiva P (1995) The promise and limitations of spatial models in conservation biology. Oikos 74:343–356
Acknowledgements
Thank you for valuable comments from insightful referees.
Author information
Authors and Affiliations
Corresponding author
Appendix
Appendix
Generating noise
Let x be a vector of random numbers drawn from a normal distribution with a mean equal to one and a specified variance. We use a filter command in Matlab (version 5.2) to transform this white noise to 1/fγ noise. The function is a one-dimensional digital filter using the difference equation:
where t-1 is the filter order (Oppenheim and Schafer 1989). With the vectors a and b one may determine the filtering process to achieve a specified transformation. In the z-transform domain the filtering process is a rational transfer function.
According to the general definition of 1/fγ noise we then have:
Hence the transfer function H(z) can take the form (Kasdin 1995) and more recently (Plaszczynski 2007):
We may then use vectors a and b (in Eq. 14-15) such that the z is a single, double or triple root to estimate γ/2 in Eq. 16. We may also use a constant c1 to avoid singularity. Some examples:
We avoid singularity by c1=0.9 for all spectra, i.e. avoiding that the denominator becomes zero and hence avoiding a solution to the difference Eq. (13) that grows exponentially. This will slightly bend the curve at very low frequencies, (f <10-3). Hence the noise is an unstationary 1/fγ−noise except at very low frequencies. On the other hand the noise is stationary such that there is a specific mean when the noise is analysed for a long enough time period.
To generate the 1/fγ−noise vector yt, with γ = 4, the matlab code with input vector simply is:
The time series y(t) (see Eq. 13), with the same mean and variance as the input signal/vector x(t), is incorporated into the demography as:
Here \( {\overline{m}}_{ij} \) is the mean value of the matrix element of the specific life history (Table 1). Since the demographic rates are bounded, survivorship on the interval (0,1) and reproduction (0,∞) we truncate the mij(t) values as following:
survival:
fecundity:
The number of truncated demographic values in our simulations are very few since CV is low. At most it can be up to 30% of the runs of a simulation setup that are close to, or cross, the truncation boundary. It occurs at high CV and for those life histories that have a mean demographic value close to the boundary, for example high or low survival rate. This implies that variation could affect the life histories differently. On the other hand our analysis show that CV has low impact on error of approximation. Hence we argue that since increased CV implies increased number of truncations the low impact of CV implies no severe effects of truncations on our conclusions.
There is a risk that the normal distribution of the original white noise will be changed when transformed to red noise and confound with the effect of noise colour (Fowler and Ruokolainen 2013). This is an inherent problem yet when tested in Gudmundson et al. (2015), supplementary material), by reshaping the normal distribution in white according to that of red noise one could not find any confounding effects of the altered distribution.
Adjustment of long-run growth rate

A description on the numerical procedure to the adjust the survivorship in ageclass one to achieve a zero longrun growth rate using fzero in Matlab
Rights and permissions
Open Access This article is distributed under the terms of the Creative Commons Attribution 4.0 International License (http://creativecommons.org/licenses/by/4.0/), which permits unrestricted use, distribution, and reproduction in any medium, provided you give appropriate credit to the original author(s) and the source, provide a link to the Creative Commons license, and indicate if changes were made.
About this article

Cite this article
Jonsson, A., Wennergren, U. Approximations of population growth in a noisy environment: on the dichotomy of non-age and age structure. Theor Ecol 12, 99–110 (2019). https://doi.org/10.1007/s12080-018-0391-2
Received:
Accepted:
Published:
Issue Date:
DOI: https://doi.org/10.1007/s12080-018-0391-2