
Abstract
The number of fatalities and economic losses caused by the Ebola virus infection across the planet culminated in the havoc that occurred between August and November 2014. However, little is known about the molecular protein profile of this devastating virus. This work represents a thorough bioinformatics analysis of the regularities of charge distribution (polar profiles) in two groups of proteins and their functional domains associated with Ebola virus disease: Ebola virus proteins and Human proteins interacting with Ebola virus. Our analysis reveals that a fragment exists in each of these proteins—one named the “functional domain”—with the polar profile similar to the polar profile of the protein that contains it. Each protein is formed by a group of short sub-sequences, where each fragment has a different and distinctive polar profile and where the polar profile between adjacent short sub-sequences changes orderly and gradually to coincide with the polar profile of the whole protein. When using the charge distribution as a metric, it was observed that it effectively discriminates the proteins from their functional domains. As a counterexample, the same test was applied to a set of synthetic proteins built for that purpose, revealing that any of the regularities reported here for the Ebola virus proteins and human proteins interacting with Ebola virus were not present in the synthetic proteins. Our results indicate that the polar profile of each protein studied and its corresponding functional domain are similar. Thus, when building each protein from its functional domai—adding one amino acid at a time and plotting each time its polar profile—it was observed that the resulting graphs can be divided into groups with similar polar profiles.
Introduction
The Ebola virus causes severe hemorrhagic fever with a high fatality rate (90%) in humans. In 1976, the first outbreak of Ebola was formally declared in the North of Zaire (now the Democratic Republic of Congo) [1]. Since then, there have been 35 outbreaks, 25 occurring in the African continent [2] and most of them located between the tropics of Cancer and Capricorn [3]. The last outbreak reported was in 2014, with the number of fatalities and economic losses surpassing the previous 34 outbreaks altogether [2]. In fact, the 2014 epidemic killed five times more than all other Ebola outbreaks combined [2].
The spread of the Ebola virus in Africa might be attributed to a fatal combination of a traditional health system lagging behind almost for all of the continent [4], and an increase in the massive transportation facilities that connect longer distances by different means [5]. Despite the number of human fatalities since the first report in 1976, the progress in gaining knowledge on the molecular mechanisms underlying the Ebola virus infection has not been fast enough to minimize the spread and lethality of the virus.
In this work, we have used a supervised learning program called Polarity Index Method (PIM) [6] that has proved its effectiveness in the identification of different protein functional groups. Its metric only uses the polar profile [7] of the protein amino acid sequence to look for the regularities in the proteins associated with Ebola virus disease and their functional domains [8] that have been experimentally identified. To achieve this objective, a comprehensive bioinformatics study was conducted looking at the polar profiles of two protein groups associated with Ebola virus disease paying attention to their structural disorder propensity [9]. These groups are Human proteins interacting with Ebola virus [10] and Ebola virus proteins [10]; they were taken with their functional domains from UniProt Database [10]. The first group includes all human proteins identified so far that interact with the Ebola virus and have at least one known functional domain. The second group is formed by the proteins that are encoded in the Ebola virus genome and have at least one recognized functional domain.
Both protein groups were analyzed with a set of bioinformatics methods developed for this purpose (Supplementary Materials section) to search for the regularities between them and their functional domains. This involved breaking down each protein sequence and its functional domain on all possible sub-sequences, preserving the natural order of the amino acids. As a counterexample, a group of synthetic proteins was built with a different level of randomness to compare and identify the regularities observed in the two protein groups associated with the Ebola virus.
To observe these regularities, it was necessary to generate all possible sub-sequences for each protein (Appendix Tables 3–5). The number of sub-sequences depended on the length of the functional domain and the protein. For example, the sub-sequences of protein TQYPDARL, whose functional domain is QYPDAR, are QYPDAR, TQYPDAR, TQYPDARL and QYPDARL. The polar profiles of these sub-sequences were then calculated (see Evaluation of the polar profile section) and their corresponding polar profile graphs were plotted. The similarity between the graphs was determined adding up the coincidences of the critical points (see Critical points section).
The analysis of the graphs reveals that there is a close non-causal relationship between a protein and its functional domain. It is also observed that the polar profile of each protein and its functional domain are unique, since this profile is not found in any of the possible sub-sequences formed in each protein. Furthermore, it is also noticed that all protein sub-sequences can be grouped in sub-sets named “Protein Group”, with a similar polar profile, and that the polar profile of each sub-set progressively changes to the functional domain of the final protein, converging to the polar profile of the complete protein. These regularities are observed in each protein associated with Ebola virus disease and not in the group of proteins used as a counterexample.
Material and Methods
Three groups of proteins and their corresponding domains were included in this work: (i) Human proteins interacting with Ebola virus, (ii) Real Ebola virus proteins and (iii) Synthetic proteins. The graphical and analytical results, as well as the scripts and programs used, are available in the Supplementary Materials section.
Evaluation of Polar Profile
One of the mathematical-computational methods used here, Polarity Index Method (PIM), has been automated and used by our team to identify different groups of peptides and proteins. However, to clarify the procedure, we describe the metric of this approach below. For a detailed review of the execution of this method, we recommend consulting Polarity index in Proteins—A Bioinformatics Tool ([11]; Appendix to Computational Tool).
Metrics
The metric of the PIM consists of calculating and comparing the polar profile of the protein studied and the polar profile of the target group. To calculate the polar profile of protein P of length “n”, its linear sequence is extracted in FASTA format P = {a1, a2, a3, …, an}, and it is read from left to right to evaluate each pair of amino acids. The polar incidences are then recorded in an A(i, j) incidence matrix.
In order to build A(i, j) matrix, it is necessary to consider the following equivalence (i, j) = {P+, P−, N, NP}, where [P+] basic hydrophilic residues = {H, K, R}; [P-] acidic hydrophilic residues = {D, E}; [N] neutral residues = {C, G, N, Q, S, T, Y}; and [NP] non-polar residues = {A, F, I, L, M, P, V, W}. All amino acids are included in one of these polarity groups. For example: if P is a protein, the first pair of amino acids represents the first incidence, which is (a1,a2), the second pair is the second incidence (a2,a3), and so on until the last incidence (an−1, an).
Each incidence is included in the A(i, j) polar incidence matrix. Afterwards, the A(i,j) matrix is normalized, ordered and linearized in a v(k) vector, k = 1,…, 16; where k = each of the 16 elements in A(i, j). This v(k) vector is the polar profile that the PIM will compare with the polar profile of other proteins to know if there is a similarity.
Critical Points
In a Cartesian coordinate system, the x axis is where the critical points (if any) are located. In the corresponding graphs representing polar profiles (e.g., see Figs. 1–3 below), the polar interactions are located on the x axis and their relative frequencies are plotted on the y axis. The critical points are those x axis coordinates (polar interactions in our case), where the curve reaches the maximum or minimum points or where it changes its concavity, which can be upwards and downwards [12].

Relative frequency distribution of the 16 polar interactions in the Human proteins interacting with Ebola virus group: (4 protein sequences, and 10 domain sequences). The x axis represents the 16 polar interactions (Appendix Table 3)

Relative frequency distribution of the 16 polar interactions in the Ebola virus proteins: (2 protein sequences, and 3 domain sequences). The x axis represents the 16 polar interactions (Appendix Table 4)

Cumulative frequency distribution of the 16 polar interactions in RND046 and RND183 pseudo-random proteins, and RND220 random protein. The x axis represents the 16 polar interactions (Appendix Table 5)
These critical points are called maximum, minimum, or inflection points, respectively. In this evaluation, the polar interactions [P+, P+], and [NP-NP] were also included as the extreme points of the graph.
Evaluation of Intrinsic Disorder
It is known that intrinsic disorder (or local or global lack of unique 3D structure in a protein) is crucial for many biological functions of proteins, including protein-protein interactions, regulation, recognition, posttranslational modifications, and control of various pathways related to cell signaling [13,14,15,16,17,18,19,20,21]. It has also been shown that intrinsically disordered proteins or hybrid proteins containing ordered domains and intrinsically disordered protein regions are very common among proteomes from all domains of life, as well as in viral proteomes [16, 22, 23]. Furthermore, peculiarities of intrinsic disorder distribution within an amino acid sequence are often related to protein functionality [9, 18, 21, 23,24,25,26,27].
Earlier, the peculiarities of viral disorder [16, 28], as well as the prevalence and functionality of intrinsic disorder have been analyzed for several important viruses, such as Zika virus [29], respiratory syncytial virus [30], Dengue virus [31], hepatitis C virus [32] and host proteins interacting with it [33], MERS-CoV [34], human papillomavirus [35] and its interactome [36], HIV-1 [37], and influenza 1918 H1N1 and H5N1 viruses [38, 39]. Therefore, to have a perspective on the specific feature of disorder distribution within the set from three protein groups, we utilized a multiparametric computational analysis of intrinsic disorder predisposition using a set of common predictors of intrinsic disorder, PONDR® VL-XT [40], PONDR® VSL2 [41], PONDR® VL3 [42], and PONDR® FIT [43].
Data Acquisition
Human proteins interacting with Ebola virus
Five human proteins interacting with Ebola virus were found in UniProt Database (10; data accessed on July 23, 2016). They were Q14653, O15118, Q9UHD2, P05161, and P30530. From these five proteins, four can be said to have annotated functional domains: O15118, Q9UHD2, P05161, and P30530 (Appendix Table 3).
Of the host proteins considered in this study, the first domain analyzed was a domain from the intracellular cholesterol transporter Niemann-Pick C1 protein (Appendix Table 3, row 2, UniProt ID: O15118), which is an endosomal entry receptor for the Ebola virus entering the host cell [44, 45]. The virus also interacts with the TBK1 protein, of which a functional domain was analyzed (Appendix Table 3, rows 3–4, UniProt ID: Q9UHD2).
The TBK1 protein is a serine/threonine-protein kinase that acts in the innate immune response regulating inflammatory responses to foreign agents [46,47,48,49,50]. The virus interaction with the TBK1 protein alters viral evasion mechanism promoting infection [45]. Two domains from the ubiquitin-like protein ISG15 were then analyzed (Appendix Table 3, rows 4–5, UniProt ID: P05161). This protein plays a vital role in the innate immune response to viral infection, being either conjugated to a target protein or acting as standing alone unconjugated protein [51,52,53]. ISG15 is known to restrict Ebola virus infection by disrupting the viral budding process [54]. Five domains were also analyzed from the receptor tyrosine-protein kinase UFO (Appendix Table 3, row 6–10, UniProt ID: P30530) that works in transducing signals from the extracellular matrix to the interior of the cell via interaction with the GAS6 growth factor [55], which is also involved in the virus entry mechanism [56, 57].
Ebola Virus Proteins
Seven annotated Ebola virus proteins were taken from UniProt Database (10; data accessed on August 17, 2016). These Ebola virus proteins are Q05320, Q05128, P18272, Q05322, Q05323, Q05127, and Q05318, of which just two of them have annotated functional domains: Q05127, and Q05318 (Appendix Table 4).
From the set of seven annotated Ebola virus proteins found in UniProt, we analyzed the polarity profiles of different domains of two Ebola virus proteins. Here, one domain from the polymerase cofactor VP35 protein was chosen for this study (Appendix Table 4, row 1, UniProt ID: Q05127), which functions as a cofactor of the RNA polymerase transcription and replication complex, thereby participating in the RNA viral transcription while also blocking the activation of IRF3, thus promoting viral activity [58,59,60].
We also analyzed one domain from the catalytic subunit (L protein) of the RNA-directed RNA polymerase (Appendix Table 4, row 2, UniProt ID: Q05318). In the Ebola virus, the functional RNA-dependent RNA polymerase represents a complex consisting of the catalytic subunit of the polymerase, protein L, and its cofactor VP35 (PMID: 23582637). This protein complex plays a crucial role in viral replication, catalyzing not only transcription of viral mRNAs, but also catalysing capping and polyadenylation of those mRNAs [61, 62].
Synthetic Proteins
Three proteins with different level of randomness and building strategy were also included (Test plan section): RND046 (46aa), RND183 (183aa), and RND220 (220aa; Appendix Table 5).
Evaluation of Intrinsic Disorder Predispositions of Proteins in Three Groups
Per-residue intrinsic disorder propensities of the selected proteins were analyzed using a set of predictors from the PONDR family (Evaluation of intrinsic disorder section). This set included PONDR® VL-XT, PONDR® VSL2, PONDR® VL3, and PONDR® FIT selected based on the well-known peculiarities of their performance. Here, PONDR® VL-XT is very sensitive to the local compositional biases and is thus capable of identifying potential molecular interaction motifs.
PONDR® VSL2 is suitable for accurate evaluation of short and long disordered regions. In turn, PONDR® VL3 achieves high accuracy in evaluation of long disordered regions, whereas the meta-predictor PONDR® FIT combines the six individual predictors, being moderately more accurate than each of its component predictors. Access to these predictors is provided by the DisProt database (http://www.disprot.org/metapredictor.php). In these analyses, sections of query proteins with disorder scores higher than 0.5 correspond to disordered regions.
Test Plan
The relative frequency distributions of the protein groups were plotted. In terms of methodology, the Human proteins interaction with Ebola virus group has four proteins (Appendix Table 3: UniProtKB column) and ten domains (Appendix Table 3: Domain column). The polar profile of each set was calculated with the PIM (Metrics section) and this polar profile was geometrically represented as a smooth curve using Excel software (Figs. 1, 2).
-
1.
Each protein was taken from each protein group, plotting individually the relative frequency distribution of the domains/proteins and dividing all the sub-sequences into categories with similar polar profiles. Methodology: e.g., O15118 domain sequence, formed by 166aa (Appendix Table 3: row 1), was subdivided into 165 sub-sequences. The first sub-sequence had the first amino acid at the N-terminal of the O15118 domain, the second sub-sequence had the two amino acids at the N-terminal of the O15118 domain, and so on, until the last sub-sequence had the O15118 domain. The polar profile of each of these 165 sub-sequences was calculated and they were graphed as a smooth curve with Excel, e.g., O15118 domain. Then, by visual inspection, the sub-sequences of the domain were separated by categories grouping those with similar geometrical behavior, i.e. when the maximum points, minimum points and inflection points matched. The categories were then recorded (Appendix Tables 3–5: Fragment with similar polar profile column).
-
2.
The main critical points for each domain of each protein group were analytically identified. Methodology: taking the 165 sub-sequences obtained for O15118 protein, sudden changes at the maximum and minimum points between sub-sequences were identified. The result was verified by visual inspection and grouped (Appendix Tables 3–5: CBP column).
-
3.
The linear distribution of disorder propensity of each protein group was evaluated. Each protein of the group was evaluated with the charge-hydropathy plot to know the level of structural disorder. Methodology: The linear disorder classifier charge-hydropathy plot (CH-plot) [9, 61] was used. It generated a 2D graphic. The x axis represented the mean Kate-Doolittle hydrophobicity and the y axis represented the mean absolute net charge: “In the corresponding CH-plot, fully structured proteins and fully disordered proteins can be separated by a boundary line. All proteins located above this boundary line are highly likely to be extended, while proteins located below this line are likely to be compact” (Figs. 4–6).
Fig. 4 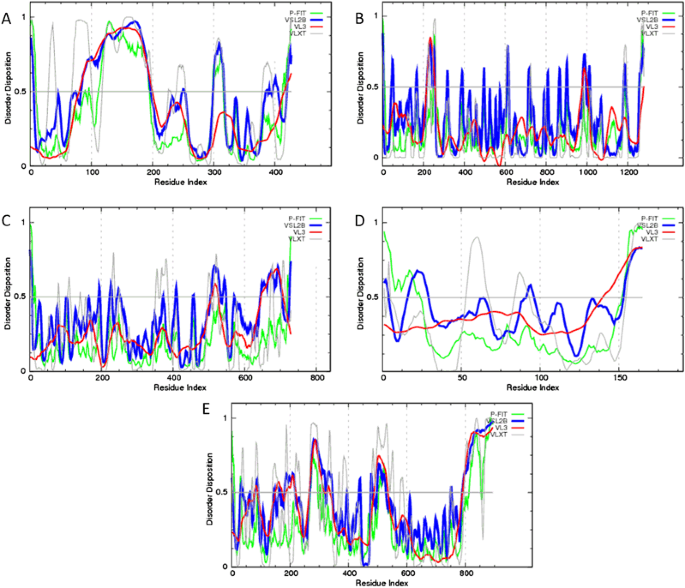
Evaluation of per-residue intrinsic disorder predisposition of human proteins interacting with Ebola virus: a Interferon regulatory factor 3 (UniProt ID: Q14653); b Niemann-Pick C1 protein (UniProt ID: O15118); c Serine/threonine-protein kinase TBK1 (UniProt ID: Q9UHD2); d Ubiquitin-like protein ISG15 (UniProt ID: P05161); and e Receptor tyrosine-protein kinase UFO (UniProt ID: P30530). Predictions were conducted by PONDR® VL-XT (gray lines), PONDR® VSL2 (blue lines), PONDR® VL3 (red lines), and PONDR® FIT (green lines) (color figure online)
Fig. 5 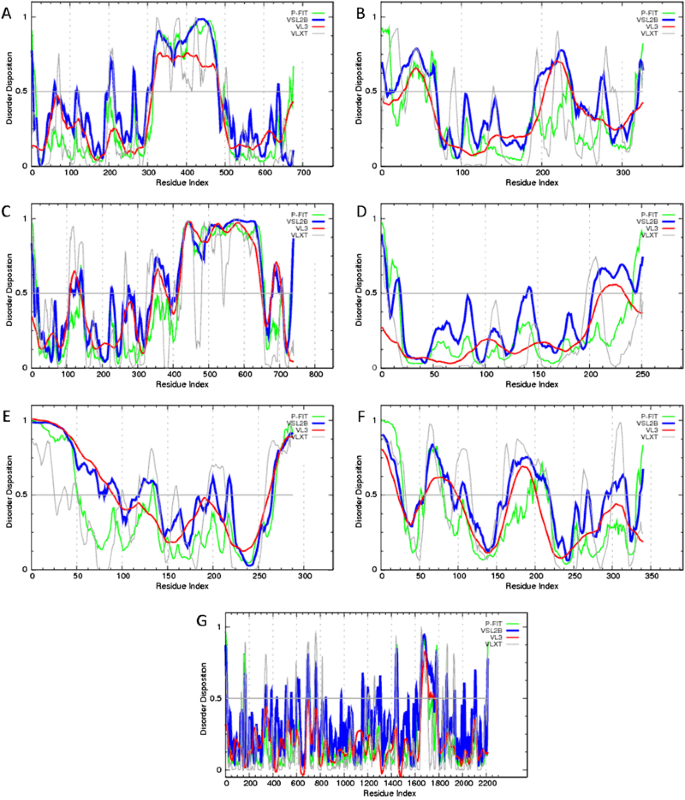
Evaluation of per-residue intrinsic disorder predisposition of Ebola virus proteins: a Envelope glycoprotein (UniProt ID: Q05320); b Matrix protein VP40 (UniProt ID: Q05128); c Nucleoprotein (UniProt ID: P18272); d Membrane-associated protein VP24 (UniProt ID: Q05322); e Minor nucleoprotein VP30 (UniProt ID: Q05323); f Polymerase cofactor VP35 (UniProt ID: Q05127); and g RNA-directed RNA polymerase L (UniProt ID: Q05318). Predictions were conducted by PONDR® VL-XT (gray lines), PONDR® VSL2 (blue lines), PONDR® VL3 (red lines), and PONDR® FIT (green lines) (color figure online)
Fig. 6 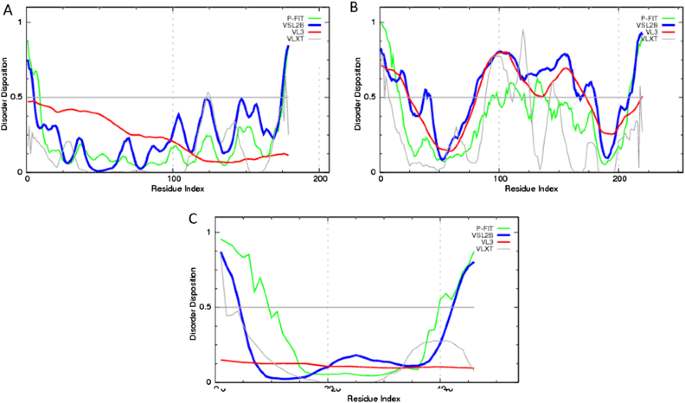
Evaluation of per-residue intrinsic disorder predisposition of synthetic proteins: a RND183; b RND220; and c RND046. Predictions were conducted by PONDR® VL-XT (gray lines), PONDR® VSL2 (blue lines), PONDR® VL3 (red lines), and PONDR® FIT (green lines) (color figure online)


Synthetic Proteins
Two groups were built and evaluated: random proteins and pseudo-random proteins. Methodology: RNA220 protein (random protein type) was built forming a random succession of polarity charges, while RND183 and RND046 proteins (pseudo-random protein type) were built forming a random succession of amino acids that were replaced by a polarity charge according to the polarity classification (Metrics section). For protein RND183 it was used a table of random numbers, for protein RND220 a generator of random numbers for Fortran 77, and for protein RND046 a generator of random numbers for JAVA (Supplementary Materials section). The level of randomness in the three cases was verified with the Kolmogorov–Smirnov test [44]. Verification of random proteins using BLAST method. Methodology: The random proteins, entire and short sub-sequences were searched using the BLAST method.
Results
Disorder Level Profile
The results of the multiparametric analysis of five human proteins interacting with Ebola virus, seven Ebola virus proteins, and three synthetic proteins are shown in (Figs. 4–6), respectively. They reveal that all the representatives of the three protein groups contain significant levels of intrinsic disorder. Many viral and host proteins, as well as one synthetic protein, were predicted to be mostly disordered. This high prevalence of intrinsic disorder in proteins of Ebola virus and in proteins interacting with Ebola virus indicate that structural disorder can be of functional importance for them.
Polar Profile
It was observed that the polar profile of proteins and domains is similar (Figs. 1, 2). It is possible to separate the domains in a finite number of categories. The polar profile graph of RND046 and RND183 pseudo-random proteins (Fig. 3) does not show coincidence with the graphs of the other two groups (Figs. 1, 2). The PIM program efficiently discriminated the sets of proteins and domains of both groups (Tables 1, 2) and this efficiency increased when the group of proteins that do not have registered domain was included.
The graph of the polar profile of the RND220 random protein showed great turbulence and disparity in particular with regard to RND046 and RND183 pseudo-random proteins (Fig. 3) and with the other groups studied (Figs. 1, 2). Short sub-sequences of RND046 and RND183 pseudo-random proteins were located in proteins with different taxonomy in the UniProt Database by BLAST software, although the RND220 random protein was the exception (Appendix Table 5). The results showed that in most of the proteins studied here, the polar balance of the functional domain is replicated in the protein, i.e. the polar profiles of the domain and the protein are almost coincidental and this convergence takes place through a finite number of Protein Groups.
Discussion
The similarity between the polar profiles of proteins related to the Ebola virus infection and their functional domains in both groups (Human proteins interacting with Ebola virus and Real Ebola virus proteins) enables the construction of a non-linear transformation identifying the degree of similarity between each functional domain and its protein (Figs. 1, 2). On the other hand, this regularity on the polar profile is not observed in the three random proteins. In fact, a clear turbulence is observed in all the polar profiles of these proteins (Fig. 3).
It is significant that any of the short sub-sequences of the only real random protein (RND220) were found in other proteins (Appendix Table 5, Entry UniProtKB with a fragment of synthetic protein inserted), unlike the two pseudo-random proteins (RND046 and RND183) where multiple short sub-sequences were found in different proteins. These two pseudo-random proteins RND046 and RND183 were influenced by the polarity of the groups {P+, P−, N, NP}, but this bias was not detected in protein RND220.
The importance of the polarity bias was already evident in previous simulations performed to predict prebiotic scenarios of peptide formation [63,64,65] where, together with their electronegativity, the abundance of amino acids exhibited a dominant role in polymerization. The last conformation a protein adopts in the three-dimensional space has as limitation the same conformation of the place it fits.
This behavior brings to mind a timepiece where the regularities and irregularities of the pieces determine the possibilities to fit together. From this observation, it was conjectured that the order of the amino acids in the linear sequence must have regularities and irregularities that explain this three-dimensional conformation. An evidence of this conjecture, presented in this work, is the similarity between the polar profile of the protein and its functional domains. This implies the existence of a finite and ordered set of non-linear transformations that leads to replication.
These series of transformations are also observed when the proteins associated with the Ebola virus disease are divided into a finite and ordered set of sub-sequences, each having a distinctive polar profile. Another result worth discussing is the location of critical points in the interior and boundaries of the sub-sequences related to this work.
Foldable proteins adopt specific conformations in their three-dimensional space according to size, charge, hydrophobicity and the polarity of their side chains. Such proteins fold as a set of α-helices, β-strand structures, or irregular regions assembled in motifs which, in turn, agglomerate into functional domains. Understanding the interaction of these functional domains can help to set a structure–function relationship [7] and this knowledge can be applied to the design of pharmaceutical drugs to combat disease [66]. Proteins involved in the entry of the virus into the cell are of particular interest because they are first-choice therapeutic targets and they facilitate an early diagnosis.
From the mathematical viewpoint, the coincidence of critical points between graphs used to determine whether these graphs are similar or not has been useful for this work. However, these observations are not sufficient when comparing graphs of proteins or peptides, for which is known a priori that their dominant functions are similar. In these cases, the coincidence of both the location of the critical points and the corresponding relative frequencies should be considered [12].
The polarity index method recognizes a striking similarity between the polarity profile of the proteins analyzed in this study as a whole and the polarity profile of their embedded functional domain, i.e., the smaller amino acid sequences of biological importance within the protein in consideration. This observation brings to mind the fact that, as the evolutionary aspects of protein building, symmetries or self-similarity in proteins [67], as well as amino acid sequence redundancies [68], may be principally founded on the simple concept of polarity respecting the amino acid monomers as the building blocks.
The non-randomness of protein sequences discussed in terms of evolutionary characteristics and/or biophysical properties [69] is, to quote the authors, where “The set of protein sequences, known to be product of evolution, looks similar to the result of some physical game with repulsion and attraction of monomers”. This may hence be linked to the physical aspect of polarity. Accordingly, as we have shown in previous studies [7], the concept of the amino acid polarities also serves to establish and predict prebiotic scenarios of peptide formation.
Future work will focus on identifying the same regularities in two groups of peptides and proteins: (i) Selective Cationic Amphipathic Antibacterial Peptides (SCAAP) [6] that are also Cell Penetrating Peptides (CPP) forming the SCAAP-CPP group [70]. These peptides are characterized by being highly toxic to bacterial membranes but almost harmless to mammalian cells, and whose affectation mechanism resides in the bacterial membrane penetration; (ii) The other group is formed by the proteins associated with A-H1N1 influenza virus [71], whose predecessor was the Spanish flu virus that infected one third of the world´s population, causing the death of 3–6% of the global population in the period between 1918–1919 [72].
Conclusions
The analysis of the regularities found between the proteins associated with the Ebola virus infection and their functional domains suggests that the polar balance has a preponderant role in protein conformation and that there is a transformation between functional units i.e., proteins and their functional domains.
References
Breman, J. G., Heymann, D. L., Lloyd, G., McCormick, J. B., Miatudila, M., Murphy, F. A., Muyembé-Tamfun, J. J., Piot, P., Ruppol, J. F., Sureau, P., van der Groen, G., & Johnson, K. M. J. (2016). Discovery and Description of Ebola Zaire Virus in 1976 and Relevance to the West African Epidemic During 2013-2016. Journal of Infectious Disease, 214(suppl 3), S93–S101.
Centers for Disease Control and Prevention, 1600 Clifton Road, Atlanta, GA 30329 USA. http://www.cdc.gov/vhf/ebola/outbreaks/history/chronology.html. Accessed 10 Oct 2016.
Polanco, C. (2015). Adaptability of the Ebola virus disease (Letter to the Editor) Heeney LJ. Ebola: Hidden reservoirs. Nature, 527, 453–455. https://doi.org/10.1038/527453a.
Mooney, G., & Gilson, L. (2009). The economic situation in South Africa and health inequities. Lancet, 374, 858–859. https://doi.org/10.1016/S0140-6736(09)61125-9.
Black, D., & Black, J. A. (2009). Review of the Urban Development and Transport Impacts on Public Health with Particular Reference to Australia: Trans-Disciplinary Research Teams and Some Research Gaps. International Journal of Environmental Research Public Health, 6, 1557–1596. https://doi.org/10.3390/ijerph6051557.
Polanco, C., & Samaniego, J. L. (2009). Detection of selective cationic amphipatic antibacterial peptides by Hidden Markov models. Acta Biochimica Polonica, 56, 167–176.
Polanco, C., Buhse, T., & Uversky, V. N. (2016). Structure and function relationships of proteins based on polar profile: a review. Acta Biochimica Polonica, 63, 229–233. https://doi.org/10.18388/abp.2014_919.
Dillon, N., & Sabbattini, P. (2000). Functional gene expression domains: defining the functional unit of eukaryotic gene regulation. Bioessays, 22, 657–665.
Oldfield, C. J., Cheng, Y., Cortese, M. S., Romero, P., Uversky, V. N., & Dunker, A. K. (2005). Coupled folding and binding with alpha-helix-forming molecular recognition elements. Biochemistry, 44, 12454–12470.
UniProt Consortium. (2015). UniProt: a hub for protein information. Nucleic Acids Research, 43(Database issue), D204–D212.
Polanco, C. (2016). Polarity index in Proteins-A Bioinformatics Tool 2016, https://doi.org/10.2174/97816810826911160101, eISBN: 978-1-68108-270-7, ISBN:978-1-68108-269-1 (Bentham Science Publishers Sharjah, U.A.E).
Dawkins, P. (2007) Calculus I, p. 272. Accessed 09 Jan 2018.
Uversky, V. N., Oldfield, C. J., & Dunker, A. K. (2005). Showing your ID: intrinsic disorder as an ID for recognition, regulation and cell signaling. Journal of Molecular Recognition, 18, 343–384.
Dunker, A. K., Silman, I., Uversky, V. N., & Sussman, J. L. (2008). Function and structure of inherently disordered proteins. Current Opinion in Structural Biology, 18, 756–764. https://doi.org/10.1016/j.sbi.2008.10.002.
Uversky, V. N., & Dunker, A. K. (2010). Understanding Protein Non-Folding. Biochimica et Biophysica Acta, 1804, 1231–1264. https://doi.org/10.1016/j.bbapap.2010.01.017.
Uversky, V.N., Dunker A.K. (2013) The case for intrinsically disordered proteins playing contributory roles in molecular recognition without a stable 3D structure. F1000 Biology Reports. https://doi.org/10.3410/B5-1.
Uversky, V.N. (2010) The mysterious unfoldome: structureless, underappreciated, yet vital part of any given proteome. Journal of Biomedicine and Biotechnology. 568068, https://doi.org/10.1155/2010/568068.
Uversky, V. N. (2013). Unusual biophysics of intrinsically disordered proteins. Biochimica et Biophysica Acta, 1834, 932–51. https://doi.org/10.1016/j.bbapap.2012.12.008.
Uversky, V. N. (2015). Functional roles of transiently and intrinsically disordered regions within proteins. FEBS Journal, 282, 1182–1189. https://doi.org/10.1111/febs.13202.
DeForte, S., & Uversky, V. N. (2016). Order, disorder, and everything in between. Molecules, 21, E1090 https://doi.org/10.3390/molecules21081090. pii.
Van der Lee, R., Buljan, M., Lang, B., Weateritt, R. J., Daughdrill, G. W., Dunker, A. K., Fuxreiter, M., Gough, J., Gsponer, J., Jones, D. T., Kim, P. M., Kriwacki, R. W., Oldfield, C. J., Pappu, R. V., Tompa, P., Uversky, V. N., Wright, P. E. & Babu, M. M. (2014). Classification of intrinsically disordered regions and proteins. Chemical Reviews, 114(13), 6589–6631. https://doi.org/10.1021/cr400525m.
Peng, Z., Yan, J., Fan, X., Miziantly, M. J., Xue, B., Wang, K., Hu, G., Uversky, V. N., & Kurgan, L. (2015). Exceptionally abundant exceptions: comprehensive characterization of intrinsic disorder in all domains of life. Cellular and Molecular Life Sciences, 72, 137–151. https://doi.org/10.1007/s00018-014-1661-9.
Xue, B., Blocquel, D., Habchi, J., Uversky, A. V., Kurgan, L., Uversky, V. N., & Longhi, S. (2014). Structural disorder in viral proteins. Chemical Reviews, 114, 6880–6911. https://doi.org/10.1021/cr4005692.
Disfani, F. M., Hsu, W.-L., Mizianty, M. J., Oldfield, C. J., Xue, B., Dunker, A. K., Uversky, V. N., & Kurgan, L. (2012). MoRFpred, a computational tool for sequence-based prediction and characterization of short disorder-to-order transitioning binding regions in proteins. Bioinformatics, 28, i75–i83. https://doi.org/10.1093/bioinformatics/bts209.
Cheng, Y., Oldfield, C. J., Meng, J., Romero, P., Uversky, V. N., & Dunker, A. K. (2007). Mining α-helix-forming molecular recognition features (α-MoRFs) with cross species sequence alignments. Biochemistry, 46, 13468–13477. https://doi.org/10.1021/bi7012273.
Vacic, V., Oldfield, C. J., Mohan, A., Radivojac, P., Cortese, M. S., Uversky, V. N., & Dunker, A. K. (2007). Characterization of molecular recognition features, MoRFs, and their binding partners. Journal of Proteome Research, 6, 2351–2366. https://doi.org/10.1021/pr0701411.
Mohan, A., Oldfield, C. J., Radivojac, P., Vacic, V., Cortese, M. S., Dunker, A. K., & Uversky, V. N. (2006). Analysis of molecular recognition features (MoRFs). Journal of Molecular Biology, 362, 1043–1059.
Tokuriki, N., Oldfield, C. J., Uversky, V. N., Berezovsky, I. N., & Tawfik, D. S. (2009). Do viral proteins possess unique biophysical features? Trends Biochemical Sciences, 34, 53–59. https://doi.org/10.1016/j.tibs.2008.10.009.
Giri, R., Kumar, D., Sharma, N., & Uversky, V. N. (2016). Intrinsically Disordered Side of the Zika Virus Proteome. Frontiers in Cellular and Infection Microbiology, 6, 144 https://doi.org/10.3389/fcimb.2016.00144.
Whelan, J. N., Reddy, K. D., Uversky, V. N., & Teng, M. N. (2016). Functional correlations of respiratory syncytial virus proteins to intrinsic disorder. Molecular Biosystems, 12, 1507–1526. https://doi.org/10.1039/c6mb00122j.
Meng, F., Badierah, R. A., Almehdar, H. A., Redwan, E. M., Kurgan, L., & Uversky, V. N. (2015). Unstructural biology of the Dengue virus proteins. FEBS Journal, 282, 3368–3394. https://doi.org/10.1111/febs.13349.
Fan, X., Xue, B., Dolan, P. T., LaCount, D. J., Kurgan, L., & Uversky, V. N. (2014). The intrinsic disorder status of the human hepatitis C virus proteome. Molecular Biosystem, 10, 1345–1363. https://doi.org/10.1039/c4mb00027g.
Dolan, P. T., Roth, A., Xue, B., Sun, R., Dunker, A. K., Uversky, V. N., & LaCount, D. J. (2015). Intrinsic disorder mediates hepatitis C virus core–host cell protein interactions. Protein Science: A Publication of the Protein Society, 24, 221–235. https://doi.org/10.1002/pro.2608.
Goh, G.K.-M., Dunker, A.K., Uversky, V. (2013) Prediction of Intrinsic Disorder in MERS-CoV/HCoV-EMC Supports a High Oral-Fecal Transmission. PLoS Currents. https://doi.org/10.1371/currents.outbreaks.22254b58675cdebc256dbe3c5aa6498b.
Uversky, V. N., Roman, A., Oldfield, C. J., & Dunker, A. K. (2006). Protein intrinsic disorder and human papillomaviruses: increased amount of disorder in E6 and E7 oncoproteins from high risk HPVs. Journal of Proteome Research, 5, 1829–1842.
Xue, B., Mizianty, M. J., Kurgan, L., & Uversky, V. N. (2012). Protein intrinsic disorder as a flexible armor and a weapon of HIV-1. Cellular and Molecular Life Sciences, 69, 1211–1259. https://doi.org/10.1007/s00018-011-0859-3.
Goh, G.K.-M., Dunker, A.K., Uversky, V.N. (2009) Protein intrinsic disorder and influenza virulence: the 1918 H1N1 and H5N1 viruses. Virology Journal. 6, https://doi.org/10.1186/1743-422X-6-69.
Morin, B., & Whelan, S. P. J. (2014). Sensitivity of the Polymerase of Vesicular Stomatitis Virus to 2′ Substitutions in the Template and Nucleotide Triphosphate during Initiation and Elongation. The Journal of Biological Chemistry, 289, 9961–9969. https://doi.org/10.1074/jbc.M113.542761.
Uversky, V. N., Oldfield, C. J., & Dunker, A. K. (2005). Showing your ID: intrinsic disorder as an ID for recognition, regulation and cell signaling. Journal of Molecular Recognition, 18, 343–384.
Romero, P., Obradovic, Z., Li, X., Garner, E. C., Brown, C. J., & Dunker, A. K. (2001). Sequence complexity of disordered protein. Proteins, 42, 38–48.
Peng, K., Radivojac, P., Vucetic, S., Dunker, A. K., & Obradovic, Z. (2006). Length-dependent prediction of protein intrinsic disorder. BMC Bioinformatics, 7, 208.
Peng, K., Vucetic, S., Radivojac, P., Brown, C. J., Brown, C. J., Dunker, A. K., & Obradovic, Z. (2005). Optimizing long intrinsic disorder predictors with protein evolutionary information. Journal of Bioinformatics and Computational Biology, 3, 35–60.
Xue, B., Dunbrack, R. L., Williams, R. W., Dunker, A. K., & Uversky, V. N. (2010). PONDR-FIT: a meta-predictor of intrinsically disordered amino acids. Biochimica et Biophysica Acta, 1804, 996–1010. https://doi.org/10.1016/j.bbapap.2010.01.011.
Sidney, S. (1956). Nonparametric statistics for the behavioral sciences. Series: McGraw-Hill series in psychology. McGraw-Hill, New York. p 346.
Carette, J. E., Raaben, M., Wong, A. C., Herbert, A. S., Obernosterer, G., Mulherkar, N., Kuehne, A. I., Kranzusch, P. J., Griffin, A. M., Ruthel, G., Dal Cin, P., Dye, J. M., Whelan, S. P., Chandran, K., & Brummelkamp, T. R. (2011). Ebola virus entry requires the cholesterol transporter Niemann-Pick C1. Nature, 477, 340–343. https://doi.org/10.1038/nature10348.
Kuroda, M., Fujikura, D., Nanbo, A., Marzi, A., Noyori, O., Kajihara, M., Maruyama, J., Matsuno, K., Miyamoto, H., Yoshida, R., Feldmann, H., & Takada, A. (2015). Interaction between TIM-1 and NPC1 Is Important for Cellular Entry of Ebola Virus. Journal of Virology, 89, 6481–6493. https://doi.org/10.1128/JVI.03156-14.
Fitzgerald, K. A., McWhirter, S. M., Faia, K. L., Rowe, D. C., Latz, E., Golenbock, D. T., Coyle, A. J., Liao, S. M., & Maniatis, T. (2003). IKKepsilon and TBK1 are essential components of the IRF3 signaling pathway. Nature Immunology, 4, 491–496.
Tojima, Y., Fujimoto, A., Delhase, M., Chem, Y., Hatakeyama, S., Nakayama, K., Kaneko, Y., Nimura, Y., Motoyama, N., Ikeda, K., Karin, M., & Nakanishi, M. (2000). NAK is an IkappaB kinase-activating kinase. Nature, 404, 778–782.
Sharma, S., tenOever, B. R., Grandvaux, N., Zhou, G. P., Lin, R., & Hiscott, J. (2003). Triggering the interferon antiviral response through an IKK-related pathway. Science, 300, 1148–1151.
tenOever, B. R., Sharma, S., Zou, W., Sun, Q., Grandvaux, N., julkunen, I., Hemmi, H., Yamamoto, M., Akira, S., Yeh, W. C., Lin, R. L., & Hiscott, J. (2004). Activation of TBK1 and IKK? Kinases by Vesicular Stomatitis Virus Infection and the Role of Viral Ribonucleoprotein in the Development of Interferon Antiviral Immunity. Journal of Virology, 78, 10636–10649. https://doi.org/10.1128/JVI.78.19.10636–10649.2004.
Unterstab, G., Ludwig, S., Anton, A., Planz, O., Dauber, B., krappmann, D., Heins, G., Ehrhardt, C., & Wolff, T. (2005). Viral targeting of the interferon-β-inducing Traf family member-associated NF-κB activator (TANK)-binding kinase-1. Proceedings of the National Academy of Sciences of the United States of America, 102, 13640–13645. https://doi.org/10.1073/pnas.0502883102.
Zhao, C., Denison, C., Huibregtse, J. M., Gygi, S., & Krug, R. M. (2005). Human ISG15 conjugation targets both IFN-induced and constitutively expressed proteins functioning in diverse cellular pathways. Proceedings of the National Academy of Sciences of the United States of America, 102, 10200–10205. https://doi.org/10.1073/pnas.0504754102.
Okumura, A., Lu, G., Pitha-Rowe, I., & Pitha, P. M. (2006). Innate antiviral response targets HIV-1 release by the induction of ubiquitin-like protein ISG15. Proceedings of the National Academy of Sciences of the United States of America, 103, 1440–1445. https://doi.org/10.1073/pnas.0510518103.
Hsiang, T.-Y., Zhao, C., & Krug, R. M. (2009). Interferon-Induced ISG15 Conjugation Inhibits Influenza A Virus Gene Expression and Replication in Human Cells. Journal of Virology, 83, 5971–5977. https://doi.org/10.1128/JVI.01667-08.
Okumura, A., Pitha, P. M., & Harty, R. N. (2008). ISG15 inhibits Ebola VP40 VLP budding in an L-domain-dependent manner by blocking Nedd4 ligase activity. Proceedings of the National Academy of Sciences of the United States of America, 105, 3974–3979. https://doi.org/10.1073/pnas.0710629105.
Park, I.-K., Giovenzana, C., Hughes, T. L., Yu, J., Trotta, R., & Caligiuri, M. A. (2009). The Axl/Gas6 pathway is required for optimal cytokine signaling during human natural killer cell development. Blood, 113, 2470–2477. https://doi.org/10.1182/blood-2008-05-157073.
Hunt, C. L., Kolokoltsov, A. A., Davey, R. A., & Maury, W. (2011). The Tyro3 receptor kinase Axl enhances macropinocytosis of Zaire ebola virus. Journal of Virology, 85, 334–347. https://doi.org/10.1128/JVI.01278-09.
Mühlberger, E., Weik, M., Volchkov, V. E., Klenk, H.-D., & Becker, S. (1999). Comparison of the Transcription and Replication Strategies of Marburg Virus and Ebola Virus by Using Artificial Replication Systems. Journal of Virology, 73, 2333–2342.
Basler, C. F., Wang, X., Mühlberger, E., Volchkov, V., Paragas, J., Klenk, H. D., García-Sastre, A., & Palese, P. (2000). The Ebola virus VP35 protein functions as a type I IFN antagonist. Proceedings of the National Academy of Sciences of the United States of America, 97, 12289–12294.
Basler, C. F., Mikulasova, A., Martinez-Sobrido, L., Paragas, J., Muhlberger, E., Bray, M., Klen, H. D., Palese, P., & García-Sastre, A. (2003). The Ebola Virus VP35 Protein Inhibits Activation of Interferon Regulatory Factor 3. Journal of Virology, 77, 7945–7956. https://doi.org/10.1128/JVI.77.14.7945–7956.2003.
Morin, B., & Whelan, S. P. J. (2014). Sensitivity of the Polymerase of Vesicular Stomatitis Virus to 2′ Substitutions in the Template and Nucleotide Triphosphate during Initiation and Elongation. The Journal of Biological Chemistry, 289, 9961–9969. https://doi.org/10.1074/jbc.M113.542761.
Uversky, V. N., Gillespie, J. R., & Fink, A. L. (2000). Why are “natively unfolded” proteins unstructured under physiologic conditions? Proteins, 41, 415–427.
Polanco, C., Samaniego, J. L., Buhse, T., & Castañón González, J. A. (2014). Discrete dynamic system oriented on the formation of prebiotic dipeptides from Rode's experiment. ACTA Biochimica Polonica, 61, 717–726.
Rhein, B. A., & Maury, W. J. (2015). Ebola virus entry into host cells: identifying therapeutic strategies. Current Clinical Microbiology Reports, 3, 115–124. https://doi.org/10.1007/s40588-015-0021-3.
Banerji, A., & Ghosh, I. (2011). Fractal symmetry of protein interior: what have we learned? Cellular and Molecular Life Sciences, 68, 2711–2737.
Doolittle, R. F. (1981). Similar amino acid sequences: chance or common ancestry? Science, 214, 149–159.
Banerji, A., & Ghosh, I. (2011). Fractal symmetry of protein interior: what have we learned? Cell Mol Life Sci, 68, 2711–2737.
Doolittle, R. F. (1981). Similar amino acid sequences: chance or common ancestry? Science, 214, 149–159.
Pande, V. S., Grosberg, A. Y., & Tanaka, T. (1994). Nonrandomness in protein sequences: evidence for a physically driven state of evolution? Proceedings of the National Academy of Sciences of the United States of America, 91, 12972–12975.
Polanco, C., Samaniego, J. L., Castañón-González, J. A., Buhse, T. & Sordo, M. L. (2013). Characterization of a possible uptake mechanism of selective antibacterial peptides. Acta Biochimica Polonica, 60, 629–633.
Polanco, C., Buhse, T., Castañón-González, J. A., & Samaniego, J. L. (2014). Possible computational filter to detect proteins associated to influenza A subtype H1N1. Acta Biochimica Polonica, 61, 693–698.
Taubenberger, J. K., & Morens, D. M. (2006). 1918 Influenza: the mother of all pandemics. Emerging Infectious Diseases Journal, 12, 15–22.
Acknowledgements
The authors thank Concepción Celis Juárez for proof-reading and also acknowledge the Computer Science department at Faculty of Sciences at the Universidad Nacional Autónoma de México for support.
Author Contributions
Thteoretical conception and design: C.P., Computational performance: C.P., and V.N.U., Data analysis: C.P., J.L.S.M., V.N.U., T.B., M.B.C., I.P.B.C., F.M.T., D.M.T., M.B.C., and I.P.B.C., Results and discussion: C.P., J.L.S.M., T.B., V.N.U., A.V.P.L., and M.F.
Author information
Authors and Affiliations
Corresponding author
Ethics declarations
Conflict of Interest
The authors declare that they have no conflict of interest.
Electronic supplementary material
Rights and permissions
About this article

Cite this article
Polanco, C., Samaniego Mendoza, J.L., Buhse, T. et al. On the Regularities of the Polar Profiles of Proteins Related to Ebola Virus Infection and their Functional Domains. Cell Biochem Biophys 76, 411–431 (2018). https://doi.org/10.1007/s12013-018-0839-4
Received:
Accepted:
Published:
Issue Date:
DOI: https://doi.org/10.1007/s12013-018-0839-4