Abstract
Experimental study of phase equilibria in the ternary Ag-Cu-Ga system was carried out by using DTA/DSC, isothermal equilibration and microscopic as well as x-ray analyses. DTA experiments were conducted for alloys, whose concentrations varied along two cross-sections determined by the ratio of mole fractions xAg/xCu = 1:1 and xAg/xGa = 1:1. Equilibration of samples was carried out at 200, 450 and 650 °C. The obtained information about phases in equilibrium was compared with the results of calculations of the phase diagram for conditions identical to our experiments. It was demonstrated that the results of calculations are compatible with the experimental data.
1 Introduction
Growing interest in gallium applications in alloys stimulated research on thermodynamic properties and phase equilibria in gallium multicomponent systems. Gallium exhibits low melting point (303 K) and high boiling point (about 2673 K), thus it is not surprising that in thermometers it can substitute mercury, which is toxic. It was found that eutectic alloy of gallium, indium and tin (Galinstan), which melts below the freezing point of water, can be applied not only in thermometers as a liquid up to 1573 K,[1] but also in microchannel heat sinks[2] in cooling systems. Moreover, low melting point of gallium and its alloys can be exploited in the process of not only microelectronics bonding, but also in low temperature joint fabrication between refractory metals during isothermal solidification while using the amalgam as a solvent.[3,4] Also, small additions of gallium to the Ag-Cu-Sn lead-free solder were introduced to lower the melting points and to change wettability of this solder.[5]
As far as solid gallium alloys are concerned, it was found that gallium addition to gold results in bright-blue color, which is exploited in jewelry.[6,7,8] Addition of gallium into gold-palladium and copper-palladium alloys led to the production of a new type of fillings in dentistry.[9,10] Shape memory Ni-Mn-Ga alloys containing about 20% of gallium are known to exhibit a giant magneto-mechanical effect, which makes it possible to change the mechanical properties of the material by interaction with the magnetic field.[11,12]
For years, gallium has been found in alloys used in electronic devices. Apart from a well-known example of gallium arsenide, which is excellent III-V semiconductor used in optoelectronics and recently in photonic quantum technologies,[13] gallium is also present in chips applied in printed circuit boards[14] and LEDs used for background lighting.[15]
Needless to say, the 2014 Nobel Prize in Physics was awarded for work on blue-light-emitting diodes (LEDs) based on gallium nitride.[16] Recently, a new type of materials based on Cu-In-Ga-Se alloys (so-called CIGS) was developed, which is used in solar cells.[17,18] It is claimed that after Ag addition these thin film solar cells (ACIGS) reached the efficiency of almost 20%.[19] Thus, there is a mounting evidence that gallium alloys can be interesting future materials.
However, despite these various applications, multicomponent phase diagrams of gallium alloys are rarely known. For example, very little is known about the phase relationships and their stability in the Au-Cu-Ga and Ag-Cu-Ga ternary systems. In fact, the Ag-Cu-Ga phase diagram is not known. In the literature only one paper by Markiv et al.[20] can be found, in which the isothermal section at 450 °C is shown. Recently, we conducted a series of investigations enabling us to provide the description of thermodynamic properties of the liquid phases as well as re-optimization of Ag-Ga[21,22] and Cu-Ga[23,24] binary systems. Finally, attempts have been made to complete thermodynamic modeling of the Ag-Cu-Ga system.[25] In this paper, the experimental results concerning the investigation of phase equilibria in this ternary system are reported.
2 Experimental
2.1 Materials
Metallic copper, gallium and silver were obtained from Alfa Aesar, Germany. They were with minimum mass fractions purities of 99.9999% (Cu, Ag) and 99.99% (Ga).
2.2 DTA Measurements
DTA measurements were carried out on Ag-Cu-Ga alloys along two cross-sections, where xAg/xGa = 1:1 and xCu/xGa = 1:1, and in the temperature range from 50 to 1070 °C. The samples of the alloys were prepared from pieces of pure elements. The weight of samples used for the experiments was about 250 mg prepared for DTA experiments with the following compositions: xAg/xGa = 1:1 for xCu from 0.1 to 0.8 and xCu/xAg = 1:1 for xGa from 0.3 to 0.8.
The samples were placed inside the self-made DTA quartz crucibles, and then they were sealed under vacuum. Next, the samples were annealed in the operating furnace VMK22, Linn High Therm for 8 weeks at the temperature of 200 °C to obtain thermodynamic equilibrium and quenched in ice water. After annealing they were transferred to the DTA apparatus. The measurements were performed on DTA 404 apparatus from Netzsch, Selb, Germany. This device is hooked up to a PC in order to control all DTA procedures during the experiment by PROTEUS software, also obtained from Netzsch. The acquired data were recorded on the PC. The total experimental error of the method has been estimated to be ± 2 °C. The experiments were carried out at the rate of 10°/min in two heating and cooling cycles. The working side was a ternary alloy of the chosen composition sealed in self-made DTA quartz crucibles while the empty self-made DTA quartz crucible was the reference side. Next, the obtained results were used to estimate the temperature of phase transformations and liquidus, starting from the annealing temperature up to about 200 °C.
2.3 SEM and XRD Analysis
To analyze the phase equilibria existing in the Ag-Cu-Ga ternary system, 30 alloys with different compositions were prepared. Table 4 lists the nominal alloy compositions investigated in the Ag-Cu-Ga ternary system together with annealing temperatures. All ternary alloys were prepared from pure elements: Ag, Cu and Ga. 30 samples (total mass about 0.50 g) were sealed and melted in evacuated quartz tubes. After alloying, the samples were homogenized in two separately operating furnaces at first at 1200 °C for 10 h. Then, they were annealed in another furnace (Linn High Therm VMK 10) at 200 °C (samples 1-15), 450 °C (samples 16-24) and 650 °C (samples 24-30) for 8 weeks to form equilibrium phases. After this equilibrium treatment, the tubes were quenched in cold water. The quenched ternary alloys were put into conductive resin and polished with diamond abrasive spray down to 1 μm grain size. Microstructures of the alloys were systematically investigated by light optical microscopy (Nikon Eclipse LV150). Next, a thorough investigation of each sample was done by using a scanning electron microscopy (Hitachi SU-70) in back-scattered mode (BSE) in order to reveal the compositional contrast between the different phases. All samples were studied by point and region analyses using EDS analysis (Thermo Scientific) attached to the SEM to obtain chemical composition of the phases. Point analyses were performed over five points or areas in each phase. Data acquisition and calculations of chemical composition were done by using NSS 3 software. Generally, for each element an error within 0.2 at.% was ascribed. After investigation of microstructure, each sample was subjected to x-ray diffraction (XRD, Rigaku, Mini Flex II) using monochromatic Cu Kα radiation (0.15416 nm). XRD spectra were solved by using PDXL software (Rigaku) with ICDD PDF 2 + Release 2010 database.
3 Thermodynamic Calculation
Table 1 summarizes stable phases in the ternary Ag-Cu-Ga system and their crystallographic data based on the literature. The binary Ag-Cu system includes 3 phases: liquid and two solid solutions (Ag) and (Cu). The binary Ag-Ga system includes 6 phases: solid solution of gallium in silver (Ag), Orthorhombic_GA (Ga), ζ (HCP_A3), ζ′ (HCP_ORD), Ag3Ga2 and the liquid phase. Finally, the Cu-Ga system includes the following phases: solid solution of gallium in copper (Cu), β (BCC_A2), ζ (HCP_A3), ζ′ (CU0.778GA0.222), γ0, γ1, γ2, γ3, CuGa2 and the liquid phase.
Optimized binary thermodynamic parameters for the Ag-Cu binary system used in this study were taken from COST 531 database,[26] for the Ag-Ga system from Gierlotka and Jendrzejczyk-Handzlik[22] and for the Cu-Ga system from the work of Jendrzejczyk-Handzlik et al.[24] In turn, ternary parameters were derived during optimization of Ag-Cu-Ga system.[25] The binary and ternary thermodynamic parameters used for the calculation of phase equilibria in the ternary Ag-Cu-Ga system are listed in Table 2.
The experimental results were superimposed on isopleths calculated along two cross-sections, and on isothermal sections calculated at three chosen temperatures. Thermodynamic calculations were performed by using Pandat 2018 software.[28]
4 Results and Discussion
4.1 DTA Measurements
As a result of DTA measurements, phase transition temperatures and the liquidus line along two selected cross-sections, namely xAg/xCu = 1:1 and xAg/xGa = 1:1, in the Ag-Cu-Ga system were determined. Temperatures of liquidus line and other phase transformations were taken from DTA curves for first heating and cooling cycles for every studied sample (the liquidus temperatures were taken from the peak maximum temperature on heating and on cooling from the corresponding onset). The obtained results from DTA experiments are gathered in Table 3.
In Table 3 sample compositions, temperatures of four invariant reactions and liquidus temperatures which were determined by using DTA measurements are given.
Examples of curves recorded for a chosen composition of ternary Ag30Cu40Ga30 alloy, which were determined experimentally using DTA method, are shown in Fig. 1. All experiments were run with the rate 10°/min and they showed clearly detected phase transitions.
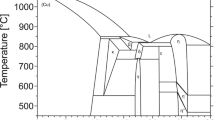
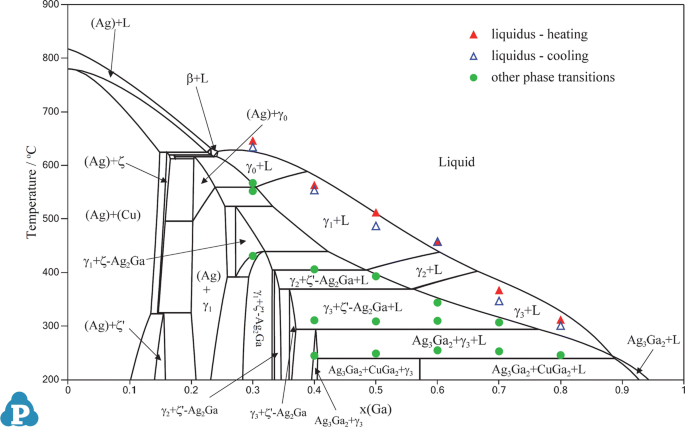
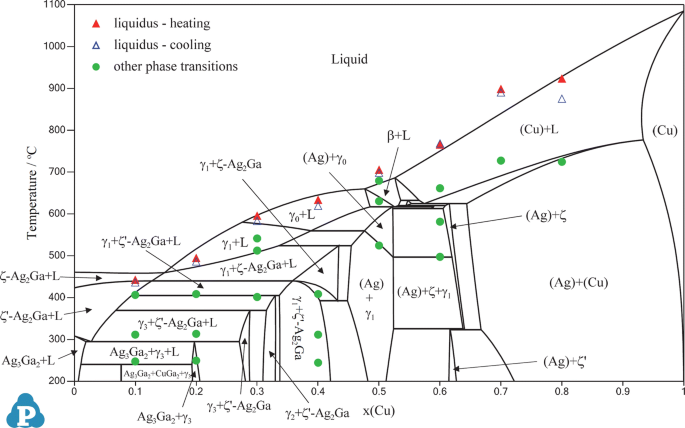
The determined temperature of invariant reaction L + γ3 → Ag3Ga2 + CuGa2 is based on seven samples (five samples from the cross-section where xAg/xCu = 1:1 and two samples from the cross-section where xAg/xGa = 1:1). This reaction temperature was found to be in the temperature interval from 245 to 255 °C. The calculated temperature of this invariant reaction is 240 °C. The analysis of the experimentally determined values given in Table 3 has shown that in case of the two samples taken from cross section xAg/xCu = 1:1, and of the composition of gallium equal to 0.6 and 0.7, the obtained temperature of this invariant reaction is higher than that obtained for other samples as well as the calculated value. Next, the temperature of the invariant reaction L + ζ′-Ag2Ga → Ag3Ga2 + γ3 was determined in six samples (four samples from the cross-section where xAg/xCu = 1:1, and two samples from the cross-section where xAg/xGa = 1:1), and it was done in the range from 307 to 313 °C. The difference between experimental values for this invariant reaction is 6 °C which is a very good result. In turn, the calculated temperature of this invariant reaction is 294 °C. The lowest temperature of this invariant reaction determined experimentally is for the sample taken the from cross-section xAg/xCu = 1:1 where gallium concentration is equal to 0.7. Similarly, the temperature of invariant reaction L + γ1 →ζ′-Ag2Ga + γ2 was determined from the analysis of four samples (one sample from the cross-section where xAg/xCu = 1:1, and three samples from the cross-section where xAg/xGa = 1:1) in the temperature interval from 401 to 408 °C. The lowest temperature of this invariant reaction is found for the sample from the cross-section xAg/xGa = 1:1 where gallium concentration is equal to 0.3. The calculated temperature of this invariant is 405 °C. The temperature of γ0 → γ1 invariant reaction was obtained by analysis of only one sample taken from cross-section xAg/xGa = 1:1 where concentration of copper equals 0.6. The obtained value is 497 °C while the calculated temperature of this invariant reaction is 496 °C. Additionally, in Table 3 liquidus temperatures from heating and cooling for all fourteen samples which were studied by DTA technique are given. The results of the calculations of these two cross-sections were compared with the experimental results obtained in this work and are shown in Fig. 2 and 3.
It can be seen from Fig. 2 and 3 that in the case of the above listed invariant reactions the obtained experimental results are in good agreement with the results of the thermodynamic calculation. The biggest difference between invariant temperature obtained from the experimental results and the calculation is 19 °C for the reaction (L + ζ′-Ag2Ga → Ag3Ga2 + γ3). In the case of liquidus temperatures which were determined in the present work, the experimental values are in good agreement with the results of calculation as in the case of listed invariant reactions. The biggest difference between temperatures of liquidus obtained from the experimental results and the calculation is found for the sample from cross-section xAg/xGa = 1:1, where gallium concentration is equal to 0.7. The obtained value is 898 °C while the calculated temperature of this invariant reaction is 842 °C. However, in the case of other samples the difference between liquidus temperature obtained from the experimental results and the calculation is about 20 °C.
4.2 Phase Equilibria in the Ag-Cu-Ga Ternary System
For the experimental investigations of the equilibrium between phases present in the ternary Ag-Cu-Ga system at three chosen temperatures, 30 different alloy compositions were prepared. All samples were investigated with SEM/EDS and XRD analysis. According to the present results, no ternary compounds have been found in the Ag-Cu-Ga system. Only binary and unary phases exist in this system.
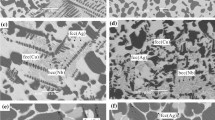
As a result of the EDS analysis of phase compositions, the following phases have been determined, namely: (Ag), (Cu), ζ′-Ag2Ga, ζ-Ag2Ga, Ag3Ga2, ζ′, γ0, γ1, γ2, γ3, CuGa2 and the liquid. Based on analysis of all microstructures of ternary alloys which were investigated, one phase is observed in four samples, i.e. no 22 and 28-30. The two-phase equilibria were observed in sixteen samples: 1-2, 8-10, 12-13, 16-18 and 24-25. Three-phase equilibria were found in ten samples i.e. no 4-7, 11, 14-15, 19, 21 and 25. The microstructures of the chosen alloys: 6, 9, 19, 21, 26 and 28 are shown in Fig. 4.
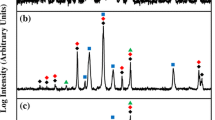
As shown in Fig. 4 two-phase equilibrium is observed in the microstructures of samples no 9 and 26. Three-phase equilibrium is observed in samples: 6, 19 and 21. Finally, single phase is observed in sample no. 28. Three phases: ζ-Ag2Ga, ζ′-Ag2Ga, (Ag) are detected as light grey fields which were observed in the microstructures of samples: 6, 9, 19, 21 and 26. The detected solubility of Ga is as follows: in ζ-Ag2Ga phase it is 29.9 at.% (sample 21) and in ζ′-Ag2Ga phase it is 27.4 at.% (sample 9). The solubility of Ga in (Ag) phase is 7.9 at.% (sample 6), 8.8 at.% (sample 19) and 6.3 at.% (sample 26). The γ1 phase is detected as a dark grey field and it is observed in the microstructures of samples no. 6, 9, 19 and 21. The detected solubility of Ga in γ1 phase is 29.8 at.% (sample 6), 31.5 at.% (sample 9), 28.5 at.% (sample 19) and 34.1 at.% (sample 21). The ζ and ζ′ phases are detected as dark grey fields with bright precipitations of (Ag) phase. These phases were observed in the microstructures of two samples i.e. no 6 and 19. The solubility of Ga in ζ phase is 21.0 at.% (sample 19) and in ζ′ phase is 21.6 at.% (sample 6). (Cu) phase with the solubility of Ga equal to 16.0 at.% was detected as a dark field in the microstructure of sample 26. Liquid phase with the Ag40.3Cu17.6Ga42.1 composition, which is trapped in ζ-Ag2Ga phase, was detected in the microstructure of sample 21. Microstructural investigation of sample 28 revealed only one phase, which was liquid, with the Ag33.1Cu33.9Ga32.9 composition. The results of the scanning electron microscopy are also confirmed by the XRD analysis. In Fig. 5 XRD spectra of chosen ternary Ag-Cu-Ga alloys are shown.
The results of the composition and phase analyses based on SEM/EDS and XRD data obtained for samples annealed at 200, 450 and 650 °C are summarized in Table 4. Experimentally determined deviations in chemical composition of the phases are also given in this table.
4.3 Isothermal Sections
The calculated isothermal section at 200 °C is compared with the experimental results obtained in this work and it is shown in Fig. 6. On the basis of the results presented in Table 4, the following fields of coexisting phases are determined: five three-phase regions: [(Ag) + (Cu) + ζ′, (Ag) + ζ′-Ag2Ga + γ1, (Ag) + ζ′ + γ1, ζ′-Ag2Ga + γ2 + γ3 and Ag3Ga2 + γ3 + CuGa2], and four two-phase regions: [(Ag) + (Cu), (Ag) + ζ′, (Ag) + γ1, Ag3Ga2 + γ3].
Increasing the temperature up to 450 °C brings about the formation of the liquid phase. The comparison of calculation with the experimental results is shown in Fig. 7. On the basis of the results gathered in Table 4, the following fields are determined: two three-phase regions: [(Ag) + ζ+γ1, ζ-Ag2Ga + γ1 + liquid], four two-phase regions: [(Ag) + (Cu), (Ag) + γ1, ζ-Ag2Ga + γ1, γ2 + liquid], and one-phase field corresponding to the liquid.
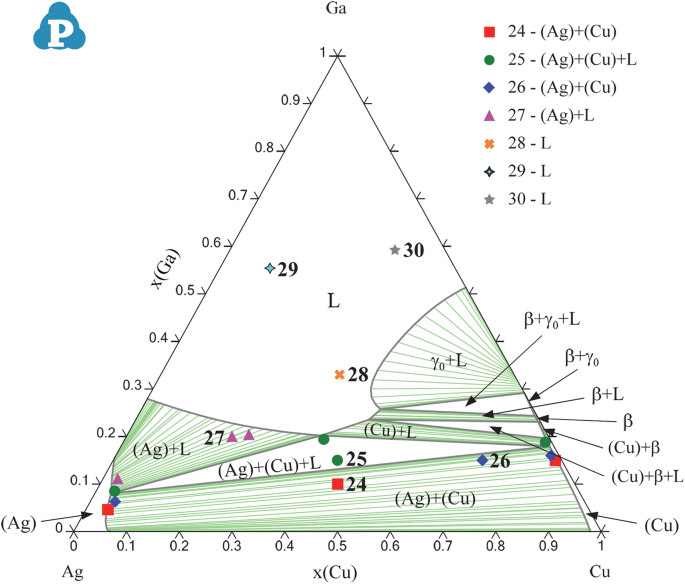
Finally, the predicted isothermal section at 650 °C is compared with the experimental results of this work in Fig. 8. The following fields can be observed: one three-phase region (Ag) + (Cu) + liquid, two two-phase regions: [(Ag) + (Cu), (Ag) + liquid] and again one-phase field is the liquid phase.
The experimentally detected phases (XRD) and their compositions (SEM/EDS, Table 4) are compatible with the results of thermodynamic calculations (Fig. 6, 7, and 8). The experimental results obtained from SEM/EDS and XRD methods are in good agreement with the calculation of the ternary Ag-Cu-Ga system.
5 Conclusions
The phase equilibria in Ag-Cu-Ga system have been experimentally investigated by using DTA, SEM–EDS and XRD techniques. The analyses of fourteen samples, which were investigated by using DTA measurements, gave information about invariant reactions, other phase transitions as well as about liquidus temperatures. The comparison of the experimental results obtained along two cross-sections (xAg/xCu = 1:1 and xAg/xGa = 1:1) with calculated Ag-Cu-Ga system leads to the following conclusion: it seems that real liquidus surface is located in good agreement with the one obtained from the calculations. Experimentally determined temperatures of two invariant reactions (*240 and **294) are higher than those obtained from the calculations, while temperatures of two other invariant reactions (***405 and ****496) are close to those obtained from the calculations. The comparison of temperatures of other phase transitions obtained from the experiment with the results of calculations also showed some discrepancy.
To determine phase equilibria in the Ag-Cu-Ga ternary system at constant temperature 200, 450 and 650 °C, 30 alloys were studied by applying SEM/EDS and XRD analysis. Descriptions of the isothermal sections of this ternary system (up to 60 at.% of Ga) at chosen temperatures are based on the experimental data. No ternary compounds were found in this system. Phases detected by EDS analysis are confirmed by XRD measurements. The calculated isothermal sections at 200, 450 and 650 °C were found to be in good agreement with the results of EDS and XRD analysis (determined phases present in an equilibrium field and their compositions). Experimental results obtained in the present work were used in optimization of the phase diagram of ternary Ag-Cu-Ga system,[25] from which ternary interaction parameters were taken derived.
References
RG Medical Diagnostics, Material Safety Data Sheet for Galinstan, Wixom, MI, USA, 2006. http://www.rgmd.com/msds/msds.pdf
M. Hodes, R. Zhang, L.S. Lam, R. Wilcoxon, and N. Lower, On the Potential of Galinstan Based Minichannel and Minigap Cooling, IEEE Trans. Compon. Packag. Manuf. Technol., 2014, 4, p 46-56
C.A. McKay, Amalgams for Improved Electronics Interconnection, IEEE Micro, 1993, 4, p 46-58
R. Schmid-Fetzer, Fundamentals of Bonding by Isothermal Solidification for High Temperature Semiconductor Applications, in Design Fundamentals of High Temperature Composites, Intermetallics and Metal–Ceramic System, Proceedings of the 125th TMS Annual Meeting, Anaheim CA, USA, 4–8 Feb 1996, ed. by R.Y. Lin, Y.A. Chang, R.G. Reddy, and C.T. Liu (The Minerals, Metals & Materials Society, Warrendale, 1996), p. 75–98
H.M. Chen, C.J. Guo, J.P. Huang, and H. Wang, Influence of Gallium Addition in Sn-Ag-Cu Lead-Fee Solder, J. Mater. Sci. Mater. Electron., 2015, 26, p 5459-5464
K. Wongpreedee, T. Tansakul, H.J. Schustere, and K. Chookruvong, Purple Gold: Past, Present, and Future to Ductile Intermetallics, in Gold 2006: New Industrial Applications for Gold, Limerick, Ireland (World Gold Council), 2006
J. Fischer-Buhner, A. Basso, and M. Poliero, New opportunities for blue and purple gold in jewelry casting, in The Santa Fe Symposium, E. Bell. 2009. Albuquerque, NM, USA. Met-Chem. Research, p. 151-166
C. Cretu and E. Lingen, Coloured Gold Alloys, Gold Bull., 1999, 32, p 115-125
F.M. Blair, J.M. Whitworth, and J.F. McCabe, The Physical Properties of a Gallium Alloy Restorative Material, Dent. Mater., 1995, 11, p 277-280
H. Hero, C.J. Simensen, and R.B. Jorgensen, Structure of Dental Gallium Alloys, Biomaterials, 1996, 17, p 1321-1326
A.A. Likhachev and K. Ullakko, Magnetic-Field-Controlled Twin Boundaries Motion and Giant Magneto-Mechanical Effects in Ni-Mn-Ga Shape Memory Alloy, Phys. Lett. A, 2000, 275, p 142-151
V.V. Khovailo, V. Novosad, T. Takagi, D.A. Filippov, R.Z. Levitin, and A.N. Vasilev, Magnetic Properties and Magnetostructural Phase Transitions in Ni2 + xMn1−xGa Shape Memory Alloys, Phys. Rev. B, 2004, 70, p 174413-1-7
J. Wang, A. Santamato, P. Jiang, D. Bonneau, E. Engin, J.W. Silverstone, M. Lermer, J. Beetz, M. Kamp, S. Höfling, M.G. Tanner, C.M. Natarajan, R.H. Hadfield, S.N. Dorenbo, V. Zwiller, J.L. O’Brien, and M.G. Thompson, Gallium Arsenide (GaAs) Quantum Photonic Wave Guide Circuits, Opt. Commun., 2014, 327, p 49-55
M. Uberschaar, S.J. Otto, and V.S. Rotter, Challenges for Critical Raw Material Recovery from WEEE—The Case Study of Gallium, Waste Manag., 2017, 60, p 534-545
S.P. DenBaars, D. Feezell, K. Kelchner, S. Pimputkar, C.C. Pan, C.C. Yen, S. Tanaka, Y. Zhao, N. Pfaff, R. Farrell, M. Iza, S. Keller, U. Mishra, J.S. Speck, and S. Nakamura, Development of Gallium-Nitride-Based Light-Emitting Diodes (LEDs) and Laser Diodes for Energy-Efficient Lighting and Displays, Acta Mater., 2013, 61, p 945-951
K.V.R.M. Murali, V.B. Naik, and D. Datta, Gallium-Nitride-Based Light-Emitting Diodes, Resonance, 2015, 20, p 605-616
H. Du, C.H. Champness, I. Shih, and T. Cheung, Growth of Bridgman Ingots of CuGaxIn1−xSe2 for Solar Cells, Thin Solid Films, 2005, 480, p 42-45
C.P. Muzzillo, C.E. Campbell, and T.J. Anderson, Cu–Ga–In Thermodynamics: Experimental Study, Modeling, and Implications for Photovoltaics, J. Mater. Sci., 2016, 51, p 3362-3379
C.P. Thompson, L. Chen, W.N. Shafarman, J. Lee, S. Fries, and R.W. Brikmire, Bandgap Gradients in (Ag,Cu)(In,Ga)Se2 Thin Film Solar Cells Deposited by Three-Stage Co-Evaporation, in 2015 IEEE 42nd PhotovoltaicSpecialists Conference, IEEE, 2015, p. 1–6
V.Ya. Markiv, V.M. Maiorenko, and N.N. Belyavina, Phase Equilibria in the Au-Cu-Ga and Ag-Cu-Ga Systems, Russ. Metall., 1989, 6, p 189–191
D. Jendrzejczyk-Handzlik and K. Fitzner, Thermodynamic Properties of Liquid Silver-Gallium Alloys Determined from e.m.f. and Calorimetric Measurements, J. Chem. Thermodyn., 2011, 43, p 392-398
W. Gierlotka and D. Jendrzejczyk-Handzlik, Thermodynamic Description of the Binary Ag-Ga System, J. Alloys Compd., 2011, 509, p 38-42
D. Jendrzejczyk-Handzlik, P. Handzlik, and K. Fitzner, Enthalpies of Mixing of Liquid Ag-Ga, Cu–Ga and Ag-Cu–Ga Alloys, CALPHAD, 2014, 44, p 39-47
D. Jendrzejczyk-Handzlik, K. Fitzner, and W. Gierlotka, On the Cu–Ga System: Electromotive Force Measurement and Thermodynamic Reoptimization, J. Alloys Compd., 2015, 621, p 287-294
W. Gierlotka, D. Jendrzejczyk-Handzlik, K. Fitzner, and P. Handzlik, On the Ternary Ag-Cu-Ga System: Electromotive Force Measurement and Thermodynamic Modeling, J. Alloys Compd., 2015, 646, p 1023-1031
A.T. Dinsdale, A. Watson, A. Kroupa, A. Zemanova, J. Vrestal, J. Vizdal, COST 531 Thermodynamic Database, Version 3.0, 2008
A.T. Dinsdale, SGTE Pure Elements (Unary) Database, Version 4.5. 2006
W. Cao, S.-L. Chen, F. Zhang, K. Wu, Y. Yang, Y.A. Chang, R. Schmid-Fetzer, and W.A. Oates, PANDAT Software with PanEngine, PanOptimizer and PanPrecipitation for Multi-component Phase Diagram Calculation and Materials Property Simulation, CALPHAD, 2009, 33, p 328-342
Acknowledgments
This work was carried out at AGH University of Science and Technology, Faculty of Non-Ferrous Metals under Grant Number 5854/B/T02/2010/39 and was supported by the Ministry of Science and Education. Authors thanks to G. Widła and J. Kusion for their help in experiments.
Author information
Authors and Affiliations
Corresponding author
Additional information
This invited article is part of a special issue of the Journal of Phase Equilibria and Diffusion in honor of Prof. Jan Vrestal’s 80th birthday. This special issue was organized by Prof. Andrew Watson, Coventry University, and Dr. Ales Kroupa, Institute of Physics of Materials, Brno, Czech Republic.
Rights and permissions
Open Access This article is distributed under the terms of the Creative Commons Attribution 4.0 International License (http://creativecommons.org/licenses/by/4.0/), which permits unrestricted use, distribution, and reproduction in any medium, provided you give appropriate credit to the original author(s) and the source, provide a link to the Creative Commons license, and indicate if changes were made.
About this article
Cite this article
Jendrzejczyk-Handzlik, D., Handzlik, P. & Fitzner, K. Experimental Investigations of Phase Equilibria in Ternary Ag-Cu-Ga System. J. Phase Equilib. Diffus. 40, 64–78 (2019). https://doi.org/10.1007/s11669-018-0697-1
Received:
Revised:
Published:
Issue Date:
DOI: https://doi.org/10.1007/s11669-018-0697-1


