
Abstract
Chromatin immunoprecipitation-sequencing (ChIP-seq) is a robust technique to study interactions between proteins, such as histones or transcription factors and DNA. This technique in combination with RNA-sequencing (RNA-seq) is a powerful tool to better understand biological processes in eukaryotes. We developed a combined ChIP-seq and RNA-seq protocol for tree buds (Prunus avium L., Prunus persica L Batch, Malus x domestica Borkh.) that has also been successfully tested on Arabidopsis thaliana and Saccharomyces cerevisiae. Tree buds contain phenolic compounds that negatively interfere with ChIP and RNA extraction. In addition to solving this problem, our protocol is optimised to work on small amounts of material. Furthermore, one of the advantages of this protocol is that samples for ChIP-seq are cross-linked after flash freezing, making it possible to work on trees growing in the field and to perform ChIP-seq and RNA-seq on the same starting material. Focusing on dormant buds in sweet cherry, we explored the link between expression level and H3K4me3 enrichment for all genes, including a strong correlation between H3K4me3 enrichment at the DORMANCY-ASSOCIATED MADS-BOX 5 (PavDAM5) loci and its expression pattern. This protocol will allow analysis of chromatin and transcriptomic dynamics in tree buds, notably during its development and response to the environment.
Background
The term ‘epigenetics’ has traditionally been used to refer to heritable changes in gene expression that take place without altering DNA sequence (Wolffe and Matzke 1999), but it is also used, in a broader sense, to refer to modifications of the chromatin environment (Miozzo et al. 2015). Epigenetic modifications are important for a wide range of processes in plants, including seed germination (Nakabayashi et al. 2005), root growth (Krichevsky et al. 2009), flowering time (He et al. 2003), disease resistance (Stokes et al. 2002) and abiotic stress responses (Zhu et al. 2008). Post-transcriptional modifications of histone proteins and chromatin structure regulate the ability of transcription factors (TFs) to bind DNA and thereby influence gene expression (Lee et al. 1993; Narlikar et al. 2002). Analysing the dynamics of chromatin modifications and DNA-protein interactions is a critical step to fully understand how gene expression is regulated. Chromatin immunoprecipitation (ChIP) is one of the few methods enabling the exploration of in vivo interactions between DNA and proteins such as histones and TFs. When followed by next generation sequencing (ChIP-seq), this method allows the detection of these interactions at a genome-wide scale. Since chromatin modifications and the regulation of gene expression are tightly linked, ChIP-seq for chromatin marks and TFs are often combined with RNA-sequencing (RNA-seq) to extract key features of the role of chromatin modification and TF binding in regulating transcription. While ChIP-seq is routinely performed in plant model organisms like Arabidopsis thaliana, it is still a challenge to carry it out on tree buds. The numerous ChIP protocols published in plants and mammals [(Cortijo et al. 2018; Kaufmann et al. 2010; Li et al. 2014; Nelson et al. 2006; Ricardi et al. 2010; Saleh et al. 2008; Wal and Pugh 2012; Xie and Presting 2016; Yamaguchi et al. 2014) to cite just some] cannot be directly used for plant materials with high phenolic content (alkaloids or lignified cell walls) like tree buds (Bílková et al. 1999). Such chemicals need to be chelated during the chromatin extraction to prevent inhibition of downstream processes. In addition, the requirement for large amounts of starting material in previous protocols has made it a challenge to perform ChIP on low-abundance tissues such as tree buds. Here, we present an efficient protocol for ChIP-seq and RNA-seq on complex, low-abundance tree buds, with the possibility of studying trees growing in the field and rapid chromatin dynamics owing to an improved cross-linking method (Fig. 1). While several studies include ChIP-seq performed in trees, some with improvements described in this protocol such as using a chelator of interfering compounds or performing cross-linking in frozen material (Hussey et al. 2015; de la Fuente et al. 2015; Leida et al. 2012), this is the first step-by-step detailed ChIP-seq protocol in trees that includes all of these improvements:
-
Our ChIP-seq/RNA-seq protocol can be carried out on complex plant tissues that contain interfering compounds (phenolic complexes, scales, protective layers), by adding chelators of these compounds in the extraction buffers.
-
The cross-linking step is performed on frozen, pulverised material, thus allowing sample collection in the field, where cross-linking equipment is not available. It also allows studying fast responses by flash freezing material immediately after a stimulus (e.g., transient temperature stress) rather than cross-linking directly on fresh tissue or cells. In previous protocols, the cross-linking step was performed using a vacuum and lasted at least 10 min and up to 1 h (Kaufmann et al. 2010; Ricardi et al. 2010; Saleh et al. 2008; Xie and Presting 2016). Moreover, cross-linking on powder allows for a more homogenous cross-linking, as it is almost impossible to have a homogenous penetration of the formaldehyde in tree buds that are protected by an impermeable and rigid lignin rich wall (Bílková et al. 1999).
-
By using frozen, pulverised material, ChIP-seq and RNA-seq can be performed on the same starting material for a direct and robust comparison of epigenetic regulation and gene expression.
-
Our protocol can be used to perform ChIP-seq and RNA-seq on a small amount of biological material. We optimised this protocol to start from 0.2 to 0.5 g of buds, which is considerably lower than the usual amount of 0.8 to 5 g of starting material for ChIP protocols in plant tissues (Haring et al. 2007; Kaufmann et al. 2010; Leida et al. 2012; Ricardi et al. 2010; Saleh et al. 2008; Xie and Presting 2016), or the 4 g of tree buds previously used (de la Fuente et al. 2015; Leida et al. 2012).

Workflow. Outline of the two main modules of the protocol: (I) ChIP-seq (top) and (II) RNA-seq (bottom). Each module starts with the same biological material (ground frozen material). (I) (a) The ChIP-seq module starts with a cross-linking step on frozen powder to stabilise interactions between DNA and proteins. (b) The chromatin is extracted using different buffers and then fragmented by sonication or MNase digestion. (c) Proteins of interest, among the protein/DNA complexes, are immunoprecipitated using specific antibodies coupled to magnetic beads. An aliquot of chromatin is set aside as an input fraction. (d) After different wash steps, a reverse cross-linking step is performed, and the DNA is isolated using SPRI beads. (e) The purified DNA is used in library preparation, and (f) is then sequenced. (II) (a) The RNA-seq module starts with RNA extraction from the frozen powder. (b) This DNAse treated RNA is then used in library preparation, and (c) sequenced
We have used this protocol to analyse histone modification profiles in several tree species. In a first instance, we analysed H3K27me3 in buds of Prunus persica L Batch (peach) and could replicate previously published results (de la Fuente et al. 2015). To demonstrate the versatility of this protocol, we also successfully performed ChIP-seq for H3K27me3 and H3K4me3 in sweet cherry (Prunus avium L.) and apple (Malus x domestica Borkh.). Furthermore, we directly compared expression level and enrichment for H3K4me3 by performing ChIP-seq for H3K4me3 and RNA-seq on the same sweet cherry bud samples. We demonstrated the correlation between chromatin status and gene expression for AGAMOUS (AG) and ELONGATION FACTOR 1 (EF1) that are known to be under control of H3K27me3 and H3K4me3, respectively (Saito et al. 2015). We expended our analysis of chromatin and expression in cherry buds harvested at different stages of dormancy, first to DORMANCY-ASSOCIATED MADS-BOX 6 and 5 (PavDAM6 and PavDAM5) genes, which are key regulators of dormancy in trees, and then to the entire genome. Dormancy is an important developmental stage of fruit trees and is characterised by a period of repressed growth that allows trees to persist under low winter temperature and short photoperiod (Faust et al. 1997). A proper regulation of the timing of the onset and release of bud dormancy is crucial to ensure optimal flowering and fruit production in trees. Consequently, unravelling the associated molecular mechanisms is essential, and numerous studies have been conducted in trees to answer this question. De la Fuente and colleagues (de la Fuente et al. 2015) have shown that DORMANCY-ASSOCIATED MADS-BOX (DAM)-related genes are upregulated in dormant peach buds. These genes are involved in the regulation of bud dormancy under unfavourable climatic conditions in peach (de la Fuente et al. 2015; Leida et al. 2012; Yamane et al. 2011), leafy spurge (Horvath et al. 2010), pear (Saito et al. 2015), apple (Mimida et al. 2015) and apricot (Sasaki et al. 2011). We find that dormancy-associated PavDAM6 and PavDAM5 genes are more expressed in dormant buds than in non-dormant cherry buds and that H3K4me3 occupancy is associated with PavDAM5 expression level. We also find significant changes in H3K4me3 level during dormancy for 671 genes, and that these changes are positively associated with transcriptional changes during dormancy. Our results show the potential for future exploration of the link between chromatin dynamics and expression at a genome-wide level during tree bud dormancy. Moreover, our combined ChIP-seq and RNA-seq protocol, which is working on many tree species, will allow a better understanding of transcriptional regulatory events and epigenomic mechanisms in tree buds.
Results
Validation of the protocol robustness in peach
In order to validate our protocol, we analysed H3K27me3 enrichment in the gene body of a DAM gene cluster on peach (Prunus persica L Batch) non-dormant buds (Fig. 2). H3K27me3 enrichment is known to be associated with a repressed transcriptional state. It has been shown that DORMANCY-ASSOCIATED MADS-BOX (DAM)-related genes display contrasting H3K27me3 profiles in dormant and non-dormant buds, with H3K27me3 signal only observed in non-dormant buds (de la Fuente et al. 2015). We observe a higher enrichment for H3K27me3 at the peach PpeDAM5 and PpeDAM6 loci compared with the PpeDAM3 gene in non-dormant buds, or compared to the gene PpeEF1, known to be enriched in H3K4me3 and depleted in H3K27me3 (Fig. 2; Fig. 3a). The replication of previously published results at the DAM genes confirms that our improved ChIP-seq protocol is working on tree buds.
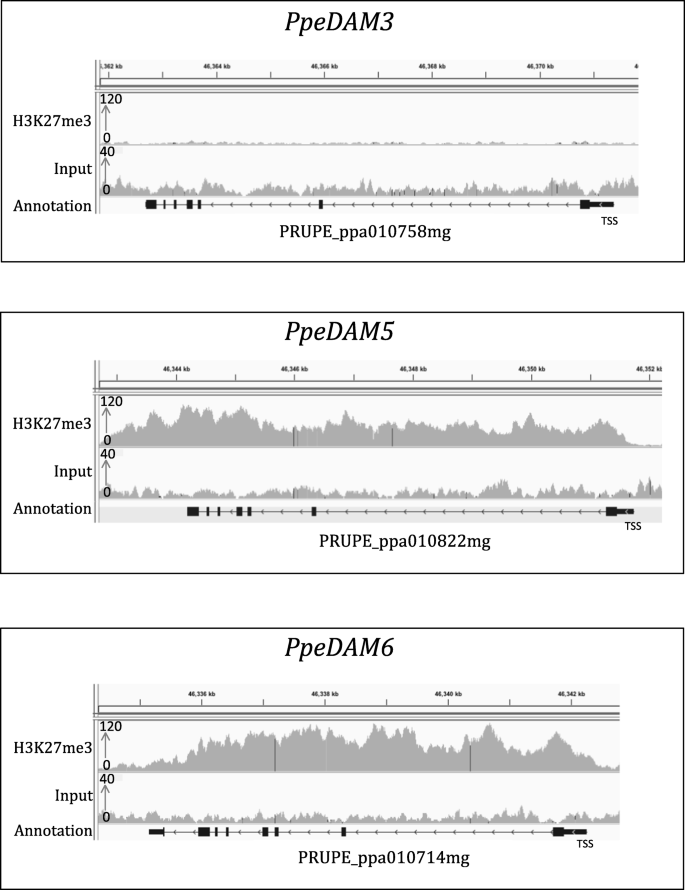
H3K27me3 ChIP-seq profile at the DAM gene cluster in peach. IGV screenshot of ChIP-seq data for H3K27me3 and its corresponding input performed on non-dormant peach buds (Prunus persica) at PpeDAM3, PpeDAM5 and PpeDAM6 genes. Genes are represented by black lines, with arrows indicating gene directionality and rectangles representing exons

H3K27me3 and H3K4me3 ChIP-seq and RNA-seq profiles three fruit tree species. IGV screenshot of ChIP-seq data for H3K27me3 and H3K4me3 and their corresponding inputs performed on peach (a), apple (b) and sweet cherry buds (c) for two control genes: ELONGATION FACTOR 1 as a positive control of H3K4me3 and AGAMOUS as a positive control of H3K27me3. RNA-seq was also carried out on sweet cherry buds (c). Genes are represented by black lines, with arrows indicating gene directionality and rectangles representing exons
Successful application of this protocol on different species
To demonstrate the versatility of this protocol, we performed ChIP-seq for two histone marks (H3K27me3 and H3K4me3) on buds of three tree species: peach, apple (Malus x domestica Borkh.) and sweet cherry (Prunus avium L.) (Fig. 3). We analysed the signal at the genes ELONGATION FACTOR 1 (EF1), known to be enriched in H3K4me3, and AGAMOUS (AG), known to be enriched in H3K27me3 (Saito et al. 2015). While H3K27me3 is associated with a repressive transcriptional state, H3K4me3 is on the contrary associated with transcriptional activation. We observed a strong H3K4me3 signal at EF1 and enrichment for H3K27me3 at AG locus for the three species (Fig. 3). This result confirms that this ChIP-seq protocol works on buds for several tree species. To test the adaptability of this protocol for other biological system, we also performed ChIP-qPCR in Arabidopsis thaliana and in Saccharomyces cerevisiae. We reproduced previously published results for the histone variant H2A.Z at HSP70 locus in Arabidopsis thaliana (Cortijo et al. 2017; Kumar and Wigge 2010), and for the binding of the TF Hsf1 at the SSA4 promoter in yeast (Erkina and Erkine 2006), Suppl. Fig. 1). This protocol is thus versatile and can be used on buds for several tree species as well as in other biological systems such as Arabidopsis thaliana and yeast.
Association between gene expression and H3K27m3 enrichment at PavDAM loci
To test if chromatin state and gene expression can be directly compared using this protocol, we carried out RNA-seq and ChIP-seq on the same starting material of sweet cherry floral buds. To start with, we analysed expression together with enrichment for H3K27me and H3K4me3 for PavEF1 and PavAG genes. We observe that PavEF1, marked by H3K4me3, is highly expressed, while PavAG, marked by H3K27me3, is very lowly expressed (Fig. 3c, Suppl. Fig. 4).
We then compared the abundance of H3K4me3 histone mark to the expression patterns of PavDAM5 and PavDAM6 during the dormancy period at three different dates for sweet cherry floral buds (October, December and January; Fig. 4). Firstly, we defined if the flower buds harvested are in endodormancy or ecodormancy at each time-point (Fig. 4a). The time of dormancy release, after which the buds are in ecodormancy, is defined when the percentage of bud break reaches 50% at BBCH stage 53 (Meier 2001). We observe that samples harvested in October and December are in endodormancy and the ones harvested in January are in ecodormancy (Fig. 4a). PavDAM5 and PavDAM6 are two key genes involved in sweet cherry dormancy corresponding to the peach PpeDAM5 and PpeDAM6, respectively. We find that PavDAM6 is highly expressed in October at the beginning of endodormancy and that its expression decreases in December and January (Fig. 4b), and that PavDAM5 is highly expressed in deep dormancy (December) and less expressed in ecodormancy (January, Fig. 4b). These results are in agreement with previous observations showing that DAM genes are upregulated in dormant peach buds (de la Fuente et al. 2015). We observe H3K4me3 enrichment at the beginning of these genes, at the level of the first exon (Fig. 4c, Suppl. Fig. 5) as expected for this chromatin mark. A low or no enrichment was found for the two controls (H3 and INPUT, Fig. 4c) meaning that the enrichment seen for H3K4me3 at these genes is relevant. We observe that H3K4me3 enrichment at PavDAM5 is higher in December compared to October and January (Fig. 4c). This is in agreement with the higher PavDAM5 expression in December. We observe that H3K4me3 enrichment at PavDAM6 is also higher in December compared to October and January, while its peak of expression is in October (Fig. 4c).

Expression and H3K4me3 profiles of PavDAM5 and PavDAM6 genes during dormancy in sweet cherry flower buds. a Evaluation of bud break percentage under forcing conditions (n = 5). b Transcriptional dynamics of PavDAM5 and PavDAM6 genes at three different dates (October 21, 2014, December 5, 2014 and January 27, 2015; n = 3). Expressions are represented in TPM (transcripts per kilobase million). c IGV screenshot of the first biological replicate of ChIP-seq data for H3K4me3 and H3 at three different dates (October 21, 2014, December 5, 2014 and January 27, 2015) and their corresponding inputs at PavDAM5 and PavDAM6 loci. Genes are represented by black rectangles, with arrows indicating gene directionality and bigger rectangles representing exons
Direct comparison of ChIP-seq and RNA-seq data
To further investigate the link between gene expression and H3K4me3 enrichments during bud dormancy, we analysed genome-wide changes between time-points in expression level as well as H3K4me3 signal. For this, we employed a gene centric approach by measuring the strength of the H3K4me3 signal at each gene and identified genes showing significant changes between at least two of the three time-points (see “Material and methods” for more detail). We identified 671 genes that show significant changes in H3K4me3 between at least two of the sampling dates. We then performed a hierarchical clustering of these genes based on a Z score [(signal for a time-point - average over all time-points)/STD across all time-points], which normalises for differences in H3K4me3 signal between genes, thus allowing direct gene-by-gene comparisons of their patterns across the studied time-points. We observe a reduction in H3K4me3 signal over time, and in particular between endodormancy and ecodormancy for most genes (Fig. 5a, see Suppl. Figure 7b for examples of H3K4me3 signal at a few genes). We then compared changes in H3K4me3 and expression over time, for the genes in the main clusters depicted in Fig. 5a (Fig. 5b, c). Genes in the purple (233 genes) and blue (313 genes) clusters are associated with simultaneous reductions in H3K4me3 signal and expression over time (Fig. 5b, c). Genes in the green (53 genes), the gold (40 genes) and the orange (13 genes) clusters show increases in H3K4me3 signal and in expression over time (Fig. 5b, c). Genes in the red cluster (19 genes) are characterised by a transient reduction in H3K4me3 signal and expression in December (Fig. 5b, c).

Genome wide comparison of H3K4me3 and expression in sweet cherry flower buds in endodormancy and ecodormancy. a Hierarchical clustering of genes showing a change in H3K4me3 level between the time points, based on the Z score of the normalised H3K4me3 level around the TSS of each gene [Z score = (signal for a time point − average over all time points)/STD across all time points]. The result is represented as a heatmap where red indicates a high Z score and blue a low Z score. The genes were separated into six clusters, indicated by the side coloured bar. b Average signal in each time point for genes in clusters showing changes in H3K4me3 over time (identified in Fig. 5a) for expression (red) and H3K4me3 (blue). Mean normalised expression and H3K4me3 levels was used (level in one time-point/average across the entire time course for a given gene). The standard deviation is also shown as a transparent ribbon. c Expression level (TPM) and normalised H3K4me3 signal over time for a few individual genes in each of the 6 clusters identified on Fig. 5a. Each point represents one biological replicate. Normalised H3K4me3 signal corresponds to the number of H3K4me3 ChIP reads in a 2000 bp window around the TSS of each gene normalised by the number of H3 ChIP reads in the same window.
We explored signalling pathways that were represented in the different clusters (Fig. 5c, Suppl. Fig. 7b, Suppl. Table 2). Among the genes classed in the green, gold and orange clusters, that increase expression over time, we identified the GLUTATHION S-TRANSFERASE19 (PavGSTU19), LATE EMBRYOGENESIS ABUNDANT14 (PavLEA14) and GALACTINOL SYNTHASE 4 (PavGolS4) genes (Fig. 5c), potentially involved in the response to drought and oxidative stresses (Hara et al. 2010; Nishizawa et al. 2008; Singh et al. 2005), together with genes associated with growth and cellular activity such as PavSWEET2, GIBBERELLIN 20 OXIDASE 1 (PavGA20ox1) and AMINO ACID PERMEASE3 (PavAAP3). On the other hand, genes from clusters purple and blue that are downregulated during ecodormancy include XYLOGLUCAN ENDOTRANSGLUCOSYLASE/HYDROLASE6 (PavXTH6), DOF AFFECTING GERMINATION2 (PavDAG2), GA-STIMULATED IN ARABIDOPSIS6 (PavGASA6), TREHALOSE-PHOSPHATASE/SYNTHASE7 (PavTPS7), PavHVA22C and PHYTOCHROME-ASSOCIATED PROTEIN1 (PavPAP1) (Fig. 5c). Homologues of XTH6, DAG2, GASA6 and HVA22C were found to be activated under cold, drought and other stress-associated stimulus while TPS7 and PAP1 are more likely associated with metabolism and auxin pathway. We also found RESPIRATORY BURST OXIDASE HOMOLOGUE C (PavRBOHC) in the cluster red, transiently downregulated in December, of which the homologue in Arabidopsis thaliana is involved in reactive oxygen species production.
Discussion
ChIP-seq and RNA-seq protocol: new epigenetic perspectives in trees
In this study, we described a combined ChIP/RNA-seq protocol for low abundance and complex plant tissues such as tree buds. This method allows a robust comparison of epigenetic regulation and gene expression as we use the same starting material. More notably, this protocol could permit to perform ChIP/RNA-seq for kinetic experiment with short intervals (every minute or less) and to collect samples in the field.
Several studies have led to the identification of molecular mechanisms involved in dormancy, including a cluster of DAM genes (Bielenberg et al. 2008). DAM-related genes are upregulated in dormant buds in peach (de la Fuente et al. 2015; Leida et al. 2012; Yamane et al. 2011), leafy spurge (Horvath et al. 2010), pear (Saito et al. 2015), apple (Mimida et al. 2015) and apricot (Sasaki et al. 2011). Conversely, DAM-related genes are downregulated in non-dormant buds. In particular, it was shown that H3K27me3 abundance is increased at DAM5 and DAM6 loci in non-dormant buds compared to dormant buds (de la Fuente et al. 2015). Using the proposed ChIP-seq protocol, we found similar results for H3K27me3 abundance in the DAM genes in peach in non-dormant buds (Fig. 2), thus validating our improved ChIP-seq method. In particular, we observe a higher enrichment for H3K27me3 at the DAM5 and DAM6 loci compared with DAM3 in non-dormant buds in peach, suggesting that not all DAM genes are regulated the same way during dormancy. Additionally, we demonstrated the correlation between the presence of histone marks and gene expression in sweet cherry (Prunus avium L.) for two control genes PavAG and PavEF1 known to be under control of H3K27me3 and H3K4me3, respectively (Fig. 3c). As the ChIP-seq and RNA-seq were performed on the same biological material, the level of gene expression and the presence/absence of particular histone marks can be directly compared with confidence. In the last two decades, ChIP has become the principal tool for investigating chromatin-related events at the molecular level such as transcriptional regulation. Our protocol will allow analysis of chromatin and expression dynamics in response to abiotic and biotic stresses, and this for trees in controlled conditions as well as growing in fields. Improvements to the ChIP-seq approach are still needed and will include an expansion of available ChIP-grade antibodies and a reduction of the hands-on time required for the entire procedure. A remaining challenge is to further decrease the amount of starting material without compromising the signal-to-noise ratio.
Correlation between expression level and H3K4me3 enrichment in sweet cherry dormant buds
Previous studies highlighted the importance of DAM genes as key components of dormancy in perennials. We have shown that, in sweet cherry, PavDAM6 is highly expressed in October, at the beginning of dormancy, and then downregulated over time (Fig. 4). Conversely, we found that PavDAM5 is highly expressed at the end of endodormancy (December), and then downregulated during ecodormancy (Fig. 4). Both PavDAM5 and PavDAM6 genes were downregulated in ecodormancy, which suggests an important role in the maintenance of endodormancy as observed in Chinese cherry (Zhu et al. 2015), peach (Bielenberg et al. 2008; de la Fuente et al. 2015; Yamane et al. 2011) and Japanese apricot (Saito et al. 2015; Sasaki et al. 2011). However their timing of expression during endodormancy was different, suggesting that they have non-redundant roles and that their expression might be regulated by different factors during dormancy.
We conducted a ChIP-seq in sweet cherry for H3K4me3, which is associated with gene activation, in order to link the abundance of histone marks to expression patterns at three different dates along dormancy (October, December and January; Fig. 4). We found an H3K4me3 enrichment around the translation start site of both PavDAM6 and PavDAM5 during dormancy (Fig. 4), as reported in peach for PpeDAM6 (Leida et al. 2012) (Leida et al. 2012) and in leafy spurge for DAM1 (Horvath et al. 2010). Generally, H3K4me3 enrichment is more abundant at the PavDAM5 locus than at the PavDAM6 locus, and this is associated with the difference in their expression levels (Fig. 4). We find a positive relation between changes over time for H3K4me3 and expression level at PavDAM5 (Fig. 4). Similarly, we find a general trend that genes with an increase over time in H3K4me3 level also show an increase in expression, while genes with a reduction in H3K4me3 over time also show a reduction in expression (Fig. 5). Despite these general correlations, changes in H3K4me3 signal that occur at a significant magnitude have been observed for only 671 genes. These results suggest that while chromatin marks might be involved in transcriptional regulation of some genes in sweet cherry buds during dormancy, other genes might exhibit changes in expression that are not associated with chromatin changes. In other genes, like PavDAM6, any relation between chromatin marks and expression seems to be more complex and possibly integrates other chromatin marks than H3K4me3. Performing a similar analysis for other chromatin marks, such as H3K27me3 that is associated with transcriptional repression, might reveal complex links between chromatin and expression dynamics during bud dormancy in sweet cherry.
Our analysis has been done with only 3 time-points spanning a period of 4 months. A finer time resolution would be needed to better identify relations between chromatin expression dynamics during dormancy, and in particular to define if chromatin changes happen before or after expression changes. Together with our results, the observation from Leida et al. (2012) and De la Fuente et al. (2015) of the presence of repressive histone mark such as H3K37me3 in peach DAM loci during dormancy support the hypothesis of a balance of histone mark enrichment controlling the dormancy process in sweet cherry and probably more largely in perennials.
Genes involved in bud dormancy
In addition to DAM genes, we identified genes that showed differential H3K4me3 enrichment between the different bud dormancy stages. We found genes involved in the response to drought, cold and oxidative stresses that were either highly expressed at the beginning of endodormancy, such as PavGSTU19 and PavLEA14, or expressed during ecodormancy (PavXTH6, PavDAG2, PavGASA6 and PavHVA22C). This is consistent with previous studies showing the key role of redox regulation (Ophir et al. 2009; Considine and Foyer 2014; Beauvieux et al. 2018) and stress-associated stimulus (Maurya and Bhalerao 2017) in bud dormancy. Interestingly, we highlighted PavGASA6 and PavGA20ox1, two genes associated with the gibberellin pathway. In particular, PavGA20ox1, that encodes an enzyme required for the biosynthesis of active GA (Plackett et al. 2012), is markedly upregulated after endodormancy release, associated with H3K4me3 enrichment at the locus, therefore, suggesting that epigenetic and transcriptomic states facilitate an increase in active GA levels during ecodormancy, as previously shown in hybrid aspen (Rinne et al. 2011) and grapevine (Zheng et al. 2018).
Finally, our results highlighted the CHROMATIN REMODELING5 (PavCHR5) gene, upregulated during ecodormancy. In Arabidopsis, CHR5 is required to reduce nucleosome occupancy near the transcriptional start site of key seed maturation genes (Shen et al. 2015). We can therefore hypothesise that chromatin remodelling, other than post-transcriptional histone modification, occurs during dormancy progression. Our results confirm that the analysis of differential H3K4me3 states between endodormant and ecodormant buds might lead to the identification of key signalling pathways involved in the control of dormancy progression.
Materials and methods
Plant material
Sweet cherry trees (cultivar ‘Burlat’), apple trees (cultivar ‘Choupette’) and peach trees (unknown cultivar) were grown in an orchard located at the Fruit Experimental Unit of INRA in Toulenne (France, 44° 34′ N 0° 16′ W) under standard agricultural practices. Sweet cherry flower buds used for the RNA-seq and ChIP-seq experiment were collected on October 21, 2014 and December 5, 2014 for dormant buds and January 27, 2015 for non-dormant buds. Apple buds were collected on January 25, 2016 and peach buds on February 5, 2016. Buds were harvested from the same branches, flash frozen in liquid nitrogen and stored at − 80 °C prior to performing ChIP-seq and RNA-seq.
Measurements of bud break
Three branches bearing floral buds were randomly chosen from the sweet cherry cultivar ‘Burlat’ trees at different dates. Branches were incubated in water pots placed in forcing conditions in a growth chamber (25 °C, 16 h light/8 h dark, 60–70% humidity). The water was replaced every 3–4 days. After 10 days under forcing conditions, the total number of flower buds that reached the BBCH stage 53 (Meier 2001) was recorded. We estimate that endodormancy is released when the percentage of buds at BBCH stage 53 is above 50% after 10 days under forcing conditions.
ChIP/RNA-seq protocol
Material sampling section
Harvest tree buds in 2-ml tubes with screw cap, immediately flash-freeze in liquid nitrogen and store at − 80 °C until ready to proceed for the ChIP-seq or RNA-seq. There is no need to remove the scales after harvesting. Grind the tissues to a fine powder using mortars and pestles pre-chilled with liquid nitrogen. Add liquid nitrogen several times while grinding to facilitate cell lysis and to ensure that the material remains completely frozen to prevent degradation of tissues. Weights of powder for this protocol are for buds for which scales have not been removed.
For the cross-linking and chromatin extraction, weigh out 300 to 500 mg of powder in a 50-ml Falcon tube pre-chilled with liquid nitrogen. The same amount of powder should be used for all samples to allow a direct comparison of results. Then proceed to ‘ChIP and library preparation section’.
For RNA extraction, weigh out 50–70 mg of powder in a 2-ml tubes (screw cap) pre-chilled with liquid nitrogen. Then proceed to ‘RNA extraction and library preparation section’. Due to the small amount of starting material, it is necessary to keep the tubes in liquid nitrogen to prevent any degradation.
ChIP and library preparation section
Cross-linking and chromatin extraction
Timing 2–3 h. Work on ice, except when specified otherwise. Add 25 ml of ice-cold Extraction buffer 1 [0.4 M sucrose, 10 mM HEPES pH 7.5, 10 mM MgCl2, 5 mM β-mercaptoethanol, 1 mM PMSF, 1% PVP-40 (polyvinylpyrrolidone), 1 tablet of complete protease inhibitor EDTA free for 50 ml of buffer from Sigma cat no. 11836170001] to the powder. For each buffer, the protease inhibitor (PMSF), the tablet of complete protease inhibitor and β-mercaptoethanol should be added directly before using the buffer. PVP-40 is a chelator used to remove phenolic derivatives as well as polysaccharides and improve the quality of the chromatin extraction. It is commonly used in RNA and chromatin extractions in buds sampled from fruit trees (Gambino et al. 2008; Leida et al. 2012; Ionescu et al. 2017). When extracting chromatin in other biological systems such as Arabidopsis thaliana or Saccharomyces cerevisiae, the PVP-40 in Extraction buffer 1 may optionally be removed.
Immediately add 675 μl of 37% formaldehyde solution (1% final concentration) and invert the tube several times to resuspend the powder. Cross-link the samples by incubating at room temperature for 10 min and then quench the formaldehyde by adding 1.926 ml 2 M of fresh glycine solution (0.15 M final concentration). Invert the tube several times and incubate at room temperature for 5 min. Filter the homogenate through Miracloth (Millipore cat no. 475855) in a funnel and collect in a clean 50-ml Falcon tube placed on ice. Repeat the filtration step once more. Centrifuge the filtrate at 3200×g for 20 min at 4 °C. Discard the supernatant by inverting the tube, being careful not to disturb the pellet. Gently resuspend the pellet in 1 ml of Extraction buffer 2 [0.24 M sucrose, 10 mM HEPES pH 7.5, 10 mM MgCl2, 1% Triton X-100, 5 mM β-mercaptoethanol, 0.1 mM PMSF, 1 tablet protease inhibitor EDTA free for 50 ml of solution], without creating bubbles, and transfer the solution to a clean 1.5-ml tube. Centrifuge at 13,500×g for 10 min at 4 °C. Carefully remove the supernatant by pipetting. If the pellet is still green, repeat the resuspension in 1 ml of Extraction buffer 2, centrifuge at 13,500×g for 10 min at 4 °C, and remove the supernatant. In a new 1.5-ml tube, add 300 μl of Extraction buffer 3 (1.7 M sucrose, 10 mM HEPES pH 7.5, 2 mM MgCl2, 0.15% Triton X-100, 5 mM β- mercaptoethanol, 0.1 mM PMSF, 1 mini-tablet protease inhibitor EDTA free for 50 ml of solution). Slowly resuspend the pellet in 300 μl of Extraction buffer 3 to prevent the formation of bubbles. Take the resuspended pellet and carefully layer it on top of the 300 μl Extraction buffer 3. Centrifuge at 21,200×g for 1 h at 4 °C. During this process, nuclei are pelleted through a sucrose cushion to remove cellular contaminants.
From this step, chromatin fragmentation can be performed in two different ways: (A) sonication, to shear the chromatin into 100–500 bp fragments, or (B) MNase (Micrococcal nuclease) digestion, to enrich for mono-nucleosomes (~ 150–200 bp). Results shown in this paper come from ChIP-seq performed on sonicated chromatin.
A. Sonication: TIMING 3–4 h (+ 8 h of incubation)
i. Chromatin fragmentation
Carefully remove the supernatant with a pipette and resuspend the nuclei pellet in 300 μl of sonication buffer (50 mM HEPES pH 7.5, 10 mM EDTA, 1% SDS, 0.1% sodium deoxycholate, 1% Triton X-100, 1 mini-tablet protease inhibitor EDTA free for 50 ml of solution). To improve nuclear membrane breaking, flash-freeze the tube in liquid nitrogen and then thaw rapidly by warming the tube in your hand. Repeat once more. This freeze-thaw step is not essential, but could improve the chromatin yield. Centrifuge the tube at 15,800×g for 3 min at 4 °C to pellet debris, and carefully recover the supernatant into a new tube. Complete the tube to 300 μl with the sonication buffer. Set aside a 10 μl aliquot of chromatin in a PCR tube to serve as the non-sonicated control when assessing sonication efficiency by gel electrophoresis and keep on ice. Shear the chromatin into ~ 300 bp (100–500 bp) fragments by sonication (e.g., using Diagenode Bioruptor Twin- UCD400, sonicate 300 μl chromatin in 1.5-ml microcentrifuge tubes for 14 to 16 cycles, on high setting, with 30s ON/30s OFF per cycle). The number of cycles of sonication to obtain DNA fragments of around 300 bp should be tested and optimised for different tissues and different concentrations of chromatin. Transfer 40 μl of sheared chromatin to a PCR tube, which will be used to check the sonication efficiency. The rest of the sonicated chromatin should be stored at − 80 °C.
ii. Analysis of sonication efficiency
Complete the sonicated (40 μl) and non-sonicated (10 μl) aliquots to 55.5 μl with TE buffer (10 mM Tris-HCl pH 8, 1 mM EDTA), add 4.5 μl of 5 M NaCl and incubate at 65 °C for 8 h to reverse cross-link. Add 2 μl of 10 mg/ml RNase A (Fisher cat no. EN0531) and incubate at 37 °C for 30 min. Add 2 μl of 20 mg/ml proteinase K (Fisher cat no. EO0491) and incubate at 45 °C for 1 h. During this step, take out the SPRI beads (e.g., AMPure beads; Beckman Coulter, cat no. A63880) from the fridge and allow them to equilibrate at room temperature (for at least 30 min before use).
To extract DNA using SPRI beads, vortex the beads until they are well dispersed, add 126 μl of beads to 60 μl of sample (2.1 × ratio) and mix well by pipetting up and down at least 10 times. Incubate 4 min at room temperature and then place the tubes on a magnetic rack (96 well; Fisher, cat no. AM10027) for 4 min to capture the beads. Carefully remove and discard the supernatant without disturbing the beads. Without removing the tubes of the magnetic rack, add 200 μl of freshly prepared 80% v/v ethanol, incubate for 30 s and discard the supernatant. Repeat the ethanol wash once more and then completely remove all ethanol. Allow the beads to dry for 15–30 min, until cracks appear in the bead pellet and no droplets of ethanol are visible. Tubes can alternatively be placed in a fume hood for 10 min to accelerate drying. The beads must be completely free from ethanol as it can interfere with downstream processes. Remove the tubes from the magnetic rack and resuspend the beads in 15 μl of 10 mM Tris-HCl (pH 8) by pipetting up and down at least 10 times. Incubate for 5 min at room temperature and place on the magnetic rack for 4 min to capture the beads. Carefully transfer 14 μl of supernatant containing DNA to a new tube. Add 2.8 μl of 6× Loading dye to 14 μl of DNA. Separate the DNA by electrophoresis on a 1.5% agarose gel for at least 1 h at 70 V. The smear should be concentrated between 100 and 500 bp (Fig. 6a). If necessary, perform additional sonication cycles. Otherwise, continue directly to the ‘Immunoprecipitation (IP)’ step.
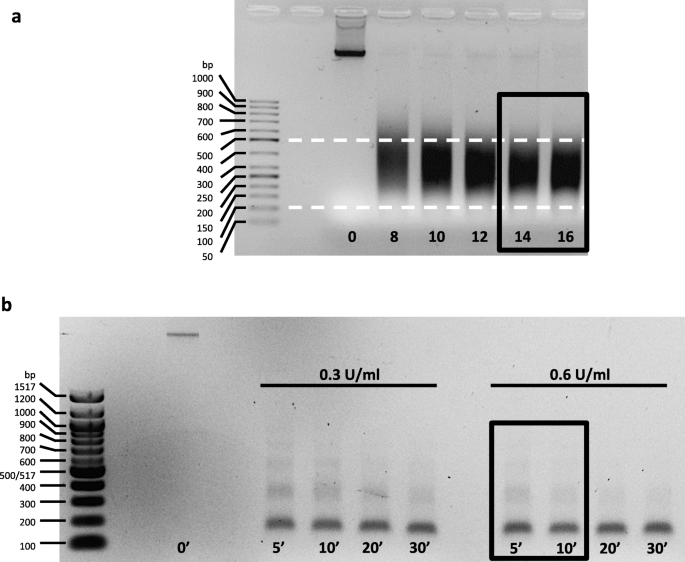
DNA profiles for MNase-digested and sonicated chromatin (Prunus avium L.). a DNA profiles of chromatin fragmented with different numbers of sonication cycles (0–16). The dotted white lines represent the optimal range of DNA fragments size (100–500 bp). Optimal sonication profiles are indicated with the black rectangle. b DNA profiles of chromatin digested with different concentrations of MNase (0.3 and 0.6 U/ml) for various durations (5, 10, 20 and 30 min). Optimal MNase digestion profiles, with ~ 80% of chromatin in mono-nucleosome form, are indicated with the black rectangle
B. MNase digestion: TIMING 4–5 h (+ 2 × 8 h of incubation)
i. DNA quantification prior to MNase digestion
Carefully remove the supernatant with a pipette and resuspend the nuclei pellet in 500 μl of MNase buffer (20 mM HEPES pH 7.5, 50 mM NaCl, 0.5 mM DTT, 0.5% NP-40, 3 mM CaCl2, Triton X-100, 1 mini-tablet protease inhibitor EDTA free for 50 ml of solution). To improve nuclear membrane breaking, flash-freeze the tube in liquid nitrogen and then thaw rapidly by warming the tube in your hand. Repeat once more. This freeze-thaw step is not essential, but could improve the chromatin yield. Transfer 40 μl of chromatin to a PCR tube to quantify DNA prior to MNase digestion and complete to 55.5 μl with MNase digestion buffer, add 4.5 μl of 5 M NaCl and incubate in a PCR machine or thermocycler at 65 °C for 8 h to reverse cross-link. Keep the rest of the chromatin at − 80 °C. Add 2 μl of 10 mg/ml RNase A and incubate at 37 °C for 30 min. Add 2 μl of 20 mg/ml proteinase K and incubate at 45 °C for 1 h. During this step, take out the SPRI beads from the fridge and allow them to equilibrate at room temperature (for at least 30 min before use). Proceed to the DNA extraction using SPRI beads as explained before in the sonication analysis section (ii). Use 1 μl from each sample to quantify the DNA using a Qubit fluorometer (ThermoFisher Scientific), or a Nanodrop spectrophotometer (Thermo Scientific).
ii. MNase digestion
Adjust all samples to the same concentration according to the quantification results using MNase buffer and to a final volume of 500 μl. Set aside a 20 μl aliquot of chromatin in a PCR tube to serve as the non-digested control when assessing MNase efficiency by gel electrophoresis and keep on ice. Incubate chromatin in a ThermoMixer (Eppendorf) for 2–5 min at 37 °C with shaking at 1200 rpm, for optimal MNase activity. Add MNase (Fisher cat no. 88216) to the chromatin to a final concentration of 0.6 U/ml and incubate 10 min in the ThermoMixer at 37 °C, 1200 rpm. Stop the digestion by adding 5 μl of 0.5 M EDTA pH 8 (5 mM final concentration), invert the tube several times to mix and immediately place on ice for 5 min. The optimal MNase enzyme concentration and incubation time to obtain predominantly mono-nucleosomes should be tested and optimised for different tissues and different concentrations of chromatin. For the optimisation of MNase digestions, we recommend using 1 ml of chromatin and carrying out digestions in 100 μl aliquots with varying concentrations of MNase (0.2 U/ml to 1 U/ml) and incubation times (5 to 20 min). Transfer 50 μl of digested chromatin to a PCR tube, which will be used to check the MNase efficiency. The rest of the digested chromatin should be stored at − 80 °C.
iii. MNase digestion analysis
Complete the digested sample (50 μl) and non-digested (20 μl) aliquots to 55.5 μl with TE buffer, add 4.5 μl of 5 M NaCl and incubate in a PCR machine or thermocycler at 65 °C for 8 h to reverse cross-link. Add 2 μl of 10 mg/ml RNase A and incubate at 37 °C for 30 min. Add 2 μl of 20 mg/ml proteinase K and incubate at 45 °C for 1 h. During this step, take out the SPRI beads from the fridge and allow them to equilibrate at room temperature (for at least 30 min before use). Proceed to the DNA extraction, using SPRI beads as explained before in the sonication analysis section (ii). Add 2.8 μl of 6× Loading dye to 14 μl of DNA. Separate the DNA by electrophoresis on a 1.5% agarose gel for at least 1 h at 70 V. The most abundant band should be 150–200 bp in size (Fig. 6b), which corresponds to chromatin in mono-nucleosome form, with a less abundant 300–350 bp band (di-nucleosomes) and a faintly visible ~ 500 bp band (tri-nucleosomes). For optimum sequencing results, approximately 80% of chromatin should be in mono-nucleosome form. If this is judged not to be the case from the gel, it is not possible to carry out further MNase digestions on the chromatin, as EDTA sequesters calcium ions that are required for MNase activity.
Immunoprecipitation (IP)
TIMING 7–8 h (+ overnight incubation). Work on ice, except when specified otherwise. Transfer 50 μl of protein A- and/or protein G-coupled magnetic beads (Invitrogen cat no. 10-002D and cat no. 10-004D, respectively) per IP to a 2-ml tube. Wash the beads with 1 ml of Binding buffer [0.5% (wt/vol) BSA, 0.5% (vol/vol) Tween-20 in PBS (without Ca2+, Mg2+)] during 5 min at 4 °C on a rotating wheel (low speed, around one rotation every 5–6 s). Place the tubes on a magnetic rack (Thermo Fisher cat no. 12321D) until the liquid is clear and remove the supernatant. Repeat three times. After the washes, resuspend the beads in 250 μl of binding buffer. Add 5 μl of antibody per IP to the beads. In our study, we used anti-trimethyl-histone 3 Lys 27 antibody (Millipore cat no. 07–449) and anti-trimethyl-histone 3 Lys 4 antibody (Millipore cat no.17–614). Incubate 4 h on a rotating wheel at 4 °C (low speed). During this incubation time, centrifuge the sonicated or digested chromatin at 15,800×g for 5 min at 4 °C to pellet debris, and carefully recover supernatant into a new tube. Transfer 100 μl of sonicated chromatin to a new 2-ml tube for one IP, add 900 μl of binding buffer and keep on ice. Or transfer 200 μl of MNAse-digested chromatin to a new 2-ml tube for one IP, add 800 μl of Binding buffer and keep on ice. Transfer 20 μl of sonicated or MNAse-digested chromatin as an input fraction (no immunoprecipitation) in a PCR tube and store at − 80 °C. The rest of the chromatin can be used for another IP or stored at − 80 °C. After completion of the incubation of protein A/G beads with the antibody, place the tubes containing the antibody-bead complexes on a magnetic rack, remove the supernatant and wash the beads with 1 ml of binding buffer during 5 min at 4 °C on a rotating wheel (low speed). Repeat three times. Resuspend the beads in 50 μl of binding buffer per IP and transfer to the 1 ml of diluted chromatin. Incubate overnight on a rotating wheel at 4 °C (low speed). Briefly centrifuge the tube (< 3 s) to pull down the liquid in the lid of the tube. Place on a magnetic rack and remove the supernatant. Wash the beads to reduce unspecific interactions by incubating 5 min at 4 °C on a rotating wheel (low speed) with 1 ml of the following buffers and total number of washes:
-
a.
5 washes with low-salt wash buffer (150 mM NaCl, 0.1% SDS, 1% triton X-100, 2 mM EDTA, 20 mM Tris-HCl pH 8);
-
b.
2 washes with high-salt wash buffer (500 mM NaCl, 0.1% SDS, 1% triton X-100, 2 mM EDTA, 20 mM Tris-HCl pH 8);
-
c.
2 washes with LiCl Wash buffer [0.25 M LiCL 1% NP-40 (IGEPAL), 1% sodium deoxycholate, 1 mM EDTA, 10 mM Tris-HCl pH 8];
-
d.
2 washes with TE buffer.
After the second wash in TE buffer, resuspend the beads in 100 μl of TE buffer and transfer the beads to a PCR tube. Place the tube on a magnetic rack, remove the TE buffer and resuspend the beads in 60 μl of Elution buffer (10 mM Tris-HCl pH 8.0, 5 mM EDTA pH 8.0, 300 mM NaCl, 0.5% SDS).
Reverse cross-linking and elution by proteinase K treatment
Timing 2 h (+8 h of incubation). Defrost the input fraction on ice (20 μl of sonicated or MNAse-digested chromatin). Complete the input fraction to 60 μl with the elution buffer. Incubate the input fraction and the IP sample (60 μl beads-elution buffer) at 65 °C for 8 h in a PCR machine or thermocycler to reverse crosslink. Add 2 μl of RNase A (10 mg/ml) and incubate at 37 °C for 30 min. Add 2 μl of proteinase K (20 mg/ml) and incubate at 45 °C for 1 h. During this step, take out the SPRI beads from the fridge and allow them to equilibrate at room temperature (for at least 30 min before use). Place the tubes on a magnetic rack to collect the beads, transfer 60 μl of supernatant from each well to a new PCR tubes (or a new 96-well-plate).
DNA extraction using SPRI beads and qPCR
Timing 1 h. Proceed to the DNA extraction, using SPRI beads as explained before in the sonication analysis section (ii) until just before the elution. Remove the tubes from the magnetic rack and for the elution, resuspend the beads in 50 μl of 10 mM Tris-HCl (pH 8.0) by pipetting up and down at least 10 times. Incubate for 5 min at room temperature and place on the magnetic rack for 4 min to capture the beads. Carefully transfer 49 μl of supernatant containing DNA to a new tube. For qPCR analysis, use 1 μl of DNA per 10 μl reaction, from the IP and input. The percentage of enrichment of DNA in the ChIP fraction relative to the input fraction is calculated according to the formula: (2- Cp ChIP/2 - Cp input) × 100. Keep the rest of the DNA for sequencing (continue to ‘ChIP library preparation and size selection section’).
ChIP library preparation and size selection
TIMING 2–3 days. Use 5–10 ng from the input fraction for the preparation of sequencing libraries. Quantify the input fraction using a DNA high sensitivity Qubit kit. For the IP fraction, as yield is often too low to be able to quantify DNA, we recommend to use the entire volume from the IP for the preparation of sequencing libraries. Using this protocol we extracted around 500 ng of DNA from 300 to 500 mg of powder of sweet cherry buds. We recommend carrying out ChIP-seq library preparation using the TruSeq ChIP Sample Prep Kit (Illumina 48 samples, 12 indexes, Illumina, cat no. IP-202-1012) with minor modifications.
-
1.
The “Purify Ligation Products” section using the gel electrophoresis is eliminated to minimise DNA loss.
-
2.
DNA size selection is carried out after the “Enrich DNA fragments” section. This is a required step to increase the visualisation of nucleosome positioning. Smaller and larger reads might disturb the MNase input profile after analysis.
The Illumina TruSeq ChIP Sample Preparation protocol is available at the following URL:
Check the quality of libraries using a 4200 TapeStation or Bioanalyzer instruments (Agilent) following manufacturer’s. See Suppl. Fig. 2 for profiles with and without adapter contaminations. If the libraries are contaminated with adapters, repeat again a size selection step with SPRI beads to remove them, otherwise proceed directly with the ‘quantification and pool of libraries”’ section. Store DNA for sequencing at − 20 °C.
RNA extraction and library preparation section
RNA extraction: timing 2–5 h
We recommend for the RNA extraction the use of RNeasy® Plant Mini kit from Qiagen (cat no. 74904) for less than 50 samples with the following minor modifications:
-
1)
Start from 50 to 70 mg of buds powder with scales. Only remove the tubes from the liquid nitrogen when the RNA Extraction buffer is prepared.
-
2)
Add 1.5% of PVP-40 (polyvinylpyrrolidone) in the RLT buffer to chelate phenolic compounds and thus prevent any interaction. Then add the appropriate volume of ß-mercaptoethanol mentioned in the Qiagen protocol.
-
3)
Add 750 μl of RNA Extraction buffer (RLT buffer + PVP-40 + ß-mercaptoethanol) instead of 450 μl if the starting material contains scales to increase the RNA yield.
Alternatively, RNA can be extracted using the MagMAX™-96 Total RNA Isolation Kit from Thermo Fisher (cat no. AM1830) for more than 50 samples following manufacturer’s instructions. Store RNA at − 80 °C.
RNA library preparation: timing 3–4 days
We recommend carrying out RNA-seq library preparation using the Truseq Stranded mRNA Library Prep Kit from Illumina (96 samples, 96 indexes, Illumina cat no. RS-122-2103). Check the quality of libraries using 4200 TapeStation or Bioanalyzer instruments (Agilent) following manufacturer’s instructions. See Suppl. Fig. 3 for profiles of libraries with and without adapter contaminations. If the libraries are contaminated with adapters, continue with a size selection step with SPRI beads to remove them, otherwise, proceed directly with ‘the quantification and pool of libraries’ section.
Quantification and pool of libraries section
Quantification of RNA and ChIP libraries
From this step, the quantification and the pool for RNA and ChIP libraries are the same. However, ChIP-seq libraries on one-hand and RNA-seq libraries on the other should be pooled and sequenced separately. Libraries are quantified using a Qubit Fluorometer from Thermo Fisher (DNA high sensitivity). Dilute the DNA high sensitivity dye to 1/200 in the DNA high sensitivity buffer (e.g., for 10 samples: mix 1.990 ml of DNA high sensitivity buffer and 10 μl of DNA high sensitivity dye). Add 198 μl of mix in Qubit tubes (Thermo Fisher cat no. Q32856) and 2 μl of DNA (for standard: 190 μl of mix + 10 μl of standard). Vortex and spin down. Quantification is performed using Qubit fluorometer following manufacturer’s instructions.
Pool of libraries: timing 1 h
According to the quantification results, dilute libraries at 10 nM using this calcul to convert from ng/μl to nM: (concentration*10^6)/(size × 617.96 + 36.04), where concentration is in ng/μl and size in bp. And pool the libraries using 5 μl of each library. Quantify the pool by Qubit as explained before and dilute the pool to the concentration required by the sequencing facility/company or the sequencer system used.
Data analysis
(i) RNA-seq
The raw reads obtained from the sequencing were analysed using several publicly available software and in-house scripts. Firstly, we determined the quality of reads using FastQC (www.bioinformatics.babraham.ac.uk/projects/fastqc/).
Then, possible adaptor contaminations were removed using Trimmomatic (Bolger et al. 2014), before alignment to the Prunus persica v.1 (Verde et al. 2017) or Malus domestica v.3 (Velasco et al. 2010) reference genome using Tophat (Trapnell et al. 2009). Possible optical duplicates resulting from library preparation were removed using the Picard tools (https://github.com/broadinstitute/picard). Raw reads and TPM (transcripts per million) were computed for each gene (Wagner et al. 2012). To finish, data are represented using the Integrative Genome Viewer (Robinson et al. 2011) as a tool for visualising sequencing read profiles.
(ii) -ChIP-seq
Sequenced ChIP-seq data were analysed in house, following the same quality control and pre-processing as in RNA-seq. The adaptor-trimmed reads were mapped to the Prunus persica reference genome v.1 (Verde et al. 2017) or Malus x domestica reference genome v3.0 (Velasco et al. 2010) using Bowtie2 (Langmead et al. 2009). Possible optical duplicates were removed using Picard, as described above. Data are represented using the Integrative Genome Viewer (Robinson et al. 2011). The efficiency of the H3K4me3 ChIP-seq was evaluated using fingerplots (Suppl. Fig. 6a) from deeptools (Ramírez et al. 2016). We observe that a smaller fraction of the genome contains a high proportion of reads for all H3K4me3 ChIP-seq compared to H3 ChIP-seq, suggesting that the H3K4me3 ChIP worked. Also, around 30% of the genome is not covered by reads, which can be explained by the fact that the ChIP-seq has been performed on cherry tree buds, but mapped on the peach genome.
We used a gene-centric approach to identify genes with significant changes in the strength of H3K4me3 signal between time-points. The DiffBind R package was used for the read counting and differential binding analysis steps (Stark and Brown 2011; Ross-Innes et al. 2012). Firstly, to quantify H3K4me3 signal at genes, we measured the number of H3K4me3 ChIP reads in a 2000 bp window around the TSS of each gene (Suppl. Fig. 7a). Two biological replicates were present for each time point, and DiffBind combines the available information to provide a statistical estimate of the H3K4me4 signal for any particular gene. Next, we identified a subset of genes that exhibit significant differential binding between any two time-points (October vs December; October vs January and December vs January). For this step, we used the H3 ChIP as a control, instead of the INPUT, because the number of mapped reads for one of the INPUT is much lower than other samples (Suppl. Table 1), and this might have created some bias in detecting genes with significant differences in H3K4me3 enrichment between time-points. The quality of biological replicates was assessed by performing a correlation heatmap, and hierarchical clustering of samples (Suppl. Fig. 6b), based on the H3K4me3 signal around TSS for all genes, normalised by H3. It shows that H3K4me3 ChIP-seq replicates are of high quality.
To identify groups of genes with similar H3K4me3 dynamics, hierarchical clustering was performed on the Z score of the H3K4me3 signal normalised by H3 using the function hclust on 1-Pearson correlation in the statistical programme R (R Core Team 2014). The Z score has the formula (signal for a time-point - average over all time-points/STD across all time-points), which allows the changes in H3K4me3 between time-points to be compared on a gene-to-gene basis, after normalising for differences that exist between genes.
Change history
20 November 2020
The correct name of the 3rd Author is presented in this paper.
References
Beauvieux R, Wenden B, Dirlewanger E (2018) Bud dormancy in perennial fruit tree species: a pivotal role for oxidative cues. Front Plant Sci 9:657
Bielenberg DG, Wang Y, Li Z, Zhebentyayeva T, Fan S, Reighard GL, Scorza R, Abbott AG (2008) Sequencing and annotation of the evergrowing locus in peach [Prunus persica (L.) Batsch] reveals a cluster of six MADS-box transcription factors as candidate genes for regulation of terminal bud formation. Tree Genet Genomes 4:495–507
Bílková J, Albrechtová J, Opatrná J (1999) Histochemical detection and image analysis of non-specific esterase activity and the amount of polyphenols during annual bud development in Norway spruce
Bolger AM, Lohse M, Usadel B (2014) Trimmomatic: a flexible trimmer for Illumina sequence data. Bioinformatics (Oxford, Engl) 30:2114–2120
Considine MJ, Foyer CH (2014) Redox regulation of plant development. Antioxid Redox Signal 21(9):1305–1326
Cortijo S, Charoensawan V, Brestovitsky A, Buning R, Ravarani C, Rhodes D, van Noort J, Jaeger KE, Wigge PA (2017) Transcriptional regulation of the ambient temperature response by H2A.Z nucleosomes and HSF1 transcription factors in Arabidopsis. Mol Plant 10:1258–1273
Cortijo S, Charoensawan V, Roudier F, Wigge PA (2018) Chromatin Immunoprecipitation sequencing (ChIP-Seq) for transcription factors and chromatin factors in Arabidopsis thaliana roots: from material collection to data analysis. Methods Mol Biol (Clifton, NJ) 1761:231–248
de la Fuente L, Conesa A, Lloret A, Badenes ML, Ríos G (2015) Genome-wide changes in histone H3 lysine 27 trimethylation associated with bud dormancy release in peach. Tree Genet Genomes 11:45
Erkina TY, Erkine AM (2006) Displacement of histones at promoters of Saccharomyces cerevisiae heat shock genes is differentially associated with histone H3 acetylation. Mol Cell Biol 26:7587–7600
Faust M, Erez A, Rowland LJ, Wang SY, Norman HA (1997) Bud dormancy in perennial fruit trees: physiological basis for dormancy induction. Maint Release 32:623
Gambino G, Perrone I, Gribaudo I (2008) A rapid and effective method for RNA extraction from different tissues of grapevine and other woody plants. Phytochem Anal 19:520–525
Hara M, Yatsuzuka Y, Tabata K, Kuboi T (2010) Exogenously applied isothiocyanates enhance glutathione S-transferase expression in Arabidopsis but act as herbicides at higher concentrations. J Plant Physiol 167:643–649
Haring M, Offermann S, Danker T, Horst I, Peterhansel C, Stam M (2007) Chromatin immunoprecipitation: optimization, quantitative analysis and data normalization. Plant Methods 3:11
He Y, Michaels SD, Amasino RM (2003) Regulation of flowering time by histone acetylation in Arabidopsis. Science (New York, NY) 302:1751–1754
Horvath DP, Sung S, Kim D, Chao W, Anderson J (2010) Characterization, expression and function of DORMANCY ASSOCIATED MADS-BOX genes from leafy spurge. Plant Mol Biol 73:169–179
Hussey SG, Mizrachi E, Groover A, Berger DK, Myburg AA (2015) Genome-wide mapping of histone H3 lysine 4 trimethylation in Eucalyptus grandis developing xylem. BMC Plant Biol 15:117
Ionescu IA, López-Ortega G, Burow M, Bayo-Canha A, Junge A, Gericke O et al (2017) Transcriptome and metabolite changes during hydrogen cyanamide-induced floral bud break in sweet cherry. Front Plant Sci 8:1233
Kaufmann K, Muino JM, Osteras M, Farinelli L, Krajewski P, Angenent GC (2010) Chromatin immunoprecipitation (ChIP) of plant transcription factors followed by sequencing (ChIP-SEQ) or hybridization to whole genome arrays (ChIP-CHIP). Nat Protoc 5:457–472
Krichevsky A, Zaltsman A, Kozlovsky SV, Tian GW, Citovsky V (2009) Regulation of root elongation by histone acetylation in arabidopsis. J Mol Biol 385:45–50
Kumar SV, Wigge PA (2010) H2A.Z-containing nucleosomes mediate the thermosensory response in arabidopsis. Cell 140:136–147
Langmead B, Trapnell C, Pop M, Salzberg SL (2009) Ultrafast and memory-efficient alignment of short DNA sequences to the human genome. Genome Biol 10:R25
Lee DY, Hayes JJ, Pruss D, Wolffe AP (1993) A positive role for histone acetylation in transcription factor access to nucleosomal DNA. Cell 72:73–84
Leida C, Conesa A, Llacer G, Badenes ML, Rios G (2012) Histone modifications and expression of DAM6 gene in peach are modulated during bud dormancy release in a cultivar-dependent manner. New Phytol 193:67–80
Li W, Lin YC, Li Q, Shi R, Lin CY, Chen H, Chuang L, Qu GZ, Sederoff RR, Chiang VL (2014) A robust chromatin immunoprecipitation protocol for studying transcription factor-DNA interactions and histone modifications in wood-forming tissue. Nat Protoc 9:2180–2193
Maurya JP, Bhalerao RP (2017) Photoperiod- and temperature-mediated control of growth cessation and dormancy in trees: a molecular perspective. Ann Bot 120(3):351–360
Meier U (2001) Growth stages of mono-and dicotyledonous plants
Mimida N, Saito T, Moriguchi T, Suzuki A, Komori S, Wada M (2015) Expression of DORMANCY-ASSOCIATED MADS-BOX (DAM)-like genes in apple. Biol Plant 59:237–244
Miozzo F, Saberan-Djoneidi D, Mezger V (2015) HSFs, stress sensors and sculptors of transcription compartments and epigenetic landscapes. J Mol Biol 427:3793–3816
Nakabayashi K, Okamoto M, Koshiba T, Kamiya Y, Nambara E (2005) Genome-wide profiling of stored mRNA in Arabidopsis thaliana seed germination: epigenetic and genetic regulation of transcription in seed. Plant J Cell Mol Biol 41:697–709
Narlikar GJ, Fan HY, Kingston RE (2002) Cooperation between complexes that regulate chromatin structure and transcription. Cell 108:475–487
Nelson JD, Denisenko O, Bomsztyk K (2006) Protocol for the fast chromatin immunoprecipitation (ChIP) method. Nat Protoc 1:179–185
Nishizawa A, Yabuta Y, Shigeoka S (2008) Galactinol and raffinose constitute a novel function to protect plants from oxidative damage. Plant Physiol 147:1251–1263
Ophir R, Pang X, Halaly T, Venkateswari J, David S, Etti Or G (2009) Gene-expression profiling of grape bud response to two alternative dormancy-release stimuli expose possible links between impaired mitochondrial activity, hypoxia, ethylene-ABA interplay and cell enlargement. Plant Mol Biol 71:403
Plackett A, Powers S, Fernandez-Garcia N, Urbanova T, Takebayashi Y, Seo M, Jikumaru Y, Benlloch R, Nilsson O, Ruiz-Rivero O, Phillips A, Wilson Z, Thomas S, Hedden P (2012) Analysis of the developmental roles of the Arabidopsis gibberellin 20-oxidases demonstrates that GA20ox1, −2, and −3 are the dominant Paralogs. Plant Cell 24:941–960
R Core Team (2014) R: a language and environment for statistical computing. Vienna, Austria: R Foundation for Statistical Computing
Ramírez F, Ryan DP, Grüning B, Bhardwaj V, Kilpert F, Richter AS, Heyne S, Dündar F, Manke T (2016) deepTools2: a next generation web server for deep-sequencing data analysis. Nucleic Acids Res 44:160–W165
Ricardi MM, Gonzalez RM, Iusem ND (2010) Protocol: fine-tuning of a chromatin Immunoprecipitation (ChIP) protocol in tomato. Plant Methods 6:11
Rinne PL, Welling A, Vahala J, Ripel L, Ruonala R, Kangasjärvi J, van der Schoot C (2011) Chilling of dormant buds hyperinduces FLOWERING LOCUS T and recruits GA-inducible 1,3-beta-glucanases to reopen signal conduits and release dormancy in Populus. Plant Cell 23(1):130–146
Robinson JT, Thorvaldsdottir H, Winckler W, Guttman M, Lander ES, Getz G, Mesirov JP (2011) Integrative genomics viewer. Nat Biotechnol 29:24–26
Ross-Innes CS, Stark R, Teschendorff AE, Holmes KA, Ali HR, Dunning MJ, Brown GD, Gojis O, Ellis IO, Green AR, Ali S, Chin S, Palmieri C, Caldas C, Carroll JS (2012) Differential oestrogen receptor binding is associated with clinical outcome in breast cancer. Nature 481:4
Saito T, Bai S, Imai T, Ito A, Nakajima I, Moriguchi T (2015) Histone modification and signalling cascade of the dormancy-associated MADS-box gene, PpMADS13-1, in Japanese pear (Pyrus pyrifolia) during endodormancy. Plant Cell Environ 38:1157–1166
Saleh A, Alvarez-Venegas R, Avramova Z (2008) An efficient chromatin immunoprecipitation (ChIP) protocol for studying histone modifications in Arabidopsis plants. Nat Protoc 3:1018–1025
Sasaki R, Yamane H, Ooka T, Jotatsu H, Kitamura Y, Akagi T, Tao R (2011) Functional and expressional analyses of PmDAM genes associated with endodormancy in Japanese apricot. Plant Physiol 157:485–497
Shen Y, Devic M, Lepiniec L, Zhou D (2015) Chromodomain, helicase and DNA-binding CHD1 protein, CHR5, are involved in establishing active chromatin state of seed maturation genes. Plant Biotechnol J 13:811–820
Singh S, Cornilescu CC, Tyler RC, Cornilescu G, Tonelli M, Lee MS, Markley JL (2005) Solution structure of a late embryogenesis abundant protein (LEA14) from Arabidopsis thaliana, a cellular stress-related protein. Protein Sci 14:2601–2609
Stark R, Brown G (2011). DiffBind: differential binding analysis of ChIP-Seq peak data
Stokes TL, Kunkel BN, Richards EJ (2002) Epigenetic variation in Arabidopsis disease resistance. Genes Dev 16:171–182
Trapnell C, Pachter L, Salzberg SL (2009) TopHat: discovering splice junctions with RNA-Seq. Bioinformatics (Oxford, Engl) 25:1105–1111
Velasco R, Zharkikh A, Affourtit J, Dhingra A, Cestaro A et al (2010) The genome of the domesticated apple (Malus × domestica Borkh). Nat Genet 42:833–839
Verde I, Jenkins J, Dondini L, Micali S, Pagliarani G, Vendramin E et al (2017) The peach v2.0 release: high-resolution linkage mapping and deep resequencing improve chromosome-scale assembly and contiguity. BMC Genomics 18:225
Wagner GP, Kin K, Lynch VJ (2012) Measurement of mRNA abundance using RNA-seq data: RPKM measure is inconsistent among samples. Theory Biosci = Theorie in den Biowissenschaften 131:281–285
Wal M, Pugh BF (2012) Genome-wide mapping of nucleosome positions in yeast using high-resolution MNase ChIP-Seq. Methods Enzymol 513:233–250
Wolffe AP, Matzke MA (1999) Epigenetics: regulation through repression. Science (New York, NY) 286:481–486
Xie Z, Presting G (2016) Chromatin immunoprecipitation to study the plant epigenome. Methods Mol Biol (Clifton, NJ) 1429:189–196
Yamaguchi N, Winter CM, Wu MF, Kwon CS, William DA, Wagner D (2014) PROTOCOLS: chromatin immunoprecipitation from Arabidopsis tissues. The arabidopsis book 12: e0170
Yamane H, Ooka T, Jotatsu H, Hosaka Y, Sasaki R, Tao R (2011) Expressional regulation of PpDAM5 and PpDAM6, peach (Prunus persica) dormancy-associated MADS-box genes, by low temperature and dormancy-breaking reagent treatment. J Exp Bot 62:3481–3488
Zheng C, Kwame Acheampong A, Shi Z, Halaly T, Kamiya Y, Ophir R, Galbraith DW, Or E (2018) Distinct gibberellin functions during and after grapevine bud dormancy release. J Exp Bot 69(7):1635–1648
Zhu J, Jeong JC, Zhu Y, Sokolchik I, Miyazaki S, Zhu JK, Hasegawa PM, Bohnert HJ, Shi H, Yun DJ, Bressan RA (2008) Involvement of Arabidopsis HOS15 in histone deacetylation and cold tolerance. Proc Natl Acad Sci U S A 105:4945–4950
Zhu Y, Li Y, Xin D, Chen W, Shao X, Wang Y, Guo W (2015) RNA-Seq-based transcriptome analysis of dormant flower buds of Chinese cherry (Prunus pseudocerasus). Gene 555:362–376
Acknowledgments
We thank the Fruit Experimental Unit of INRA (Bordeaux-France) for growing the trees and Varodom Charoensawan (Mahidol University, Thailand) for sharing his scripts for RNA-seq and ChIP-seq mapping.
Data archiving statement
ChIP-seq and RNA-seq raw data are available on GEO: GSE141983.
Funding
This work was supported by a CIFRE grant funded by the CMI-Roullier Group (St Malo-France) for the ChIP and RNA-seq. S.C. was supported by an EMBO long-term fellowship [ALTF 290–2013]. P.A.W’s laboratory is supported by a Fellowship from the Gatsby Foundation [GAT3273/GLB].
Author information
Authors and Affiliations
Contributions
SC and BW organized the project. NV performed the experiments and analysed the data. DGS performed the ChIP-qPCR in Saccharomyces cerevisiae, and SC performed the ChIP-qPCR in Arabidopsis thaliana. NV, SC and BW wrote the paper. DGS, FR, ED and PAW edited the paper. All authors read and approved the final manuscript.
Corresponding author
Ethics declarations
Competing interests
The authors declare that they have no competing interests.
Additional information
Communicated by A. Brunner
Publisher’s note
Springer Nature remains neutral with regard to jurisdictional claims in published maps and institutional affiliations.
Key message: We developed a combined ChIP-seq and RNA-seq protocol for tree buds; optimised to work on small amount of material and on samples flash frozen in the field, and explored the link between expression level and H3K4me3 enrichment.
This article is present on a Biorxiv repository website and can be accessed on https://www.biorxiv.org/content/10.1101/334474v1. This article is not published nor is under publication elsewhere.
Rights and permissions
Open Access This article is distributed under the terms of the Creative Commons Attribution 4.0 International License (http://creativecommons.org/licenses/by/4.0/), which permits unrestricted use, distribution, and reproduction in any medium, provided you give appropriate credit to the original author(s) and the source, provide a link to the Creative Commons license, and indicate if changes were made.
About this article

Cite this article
Vimont, N., Quah, F.X., Schöepfer, D.G. et al. ChIP-seq and RNA-seq for complex and low-abundance tree buds reveal chromatin and expression co-dynamics during sweet cherry bud dormancy. Tree Genetics & Genomes 16, 9 (2020). https://doi.org/10.1007/s11295-019-1395-9
Received:
Revised:
Accepted:
Published:
DOI: https://doi.org/10.1007/s11295-019-1395-9