Abstract
Technical copper alloys with tin are commonly named bronzes. Modern tin bronzes used in industry contain between 1 and 9 at.% of tin. Those alloys are used mostly for mechanical working. An increase in tin content in bronzes cooled in standard conditions results with appearance next to heterogeneous structure α and also other structures, including adverse phase δ. In ancient times, bronzes with tin content up to 14 at.% were used in order to manufacture ornaments or items used for everyday life such as singing bowl. An analysis of discussed bowl structure indicated dominant \(\beta_{1}^{'}\) and \(\gamma_{1}^{'}\) martensite phase, which is an evidence of quenching in order to preserve the high-temperature β and γ phase structure. The main goal of this work was to obtain high-tin bronze structure corresponding to phases identified in singing bowl. On the basis of chemical composition and structural analysis of the singing bowl, a binary technical alloy was prepared by induction melting process. On such prepared alloy, a differential thermal analysis was performed in order to determine the presence of phase transitions. Based on results of thermal analysis, the temperature ranges and cooling conditions of heat treatment were investigated in order to perform structural analysis. Additionally, the structure of the alloy was analyzed in context to achieve a similar martensite phase as a matrix with α secondary phase.
Introduction
Bronzes are alloys of copper and tin with other metals and also nonmetallic elements such as silicon or phosphorus [1]. Designation of bronze derives from Latin word aes brundusinu that means Brindisian ore, which indicates that Brindisi is specialized with treatment of this alloy. They characterize with good plasticity, good strength and good impact resistance; additionally, they show good corrosion resistance in water vapors and sea water. Highly alloyed bronzes can be easily quenched [2].
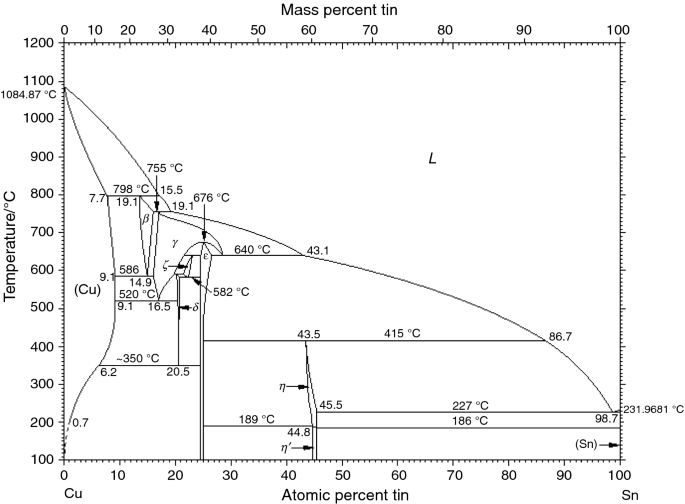
Cu–Sn binary alloy phase diagram (Fig. 1) shows several peritectic and eutectoid transformations, whose products are α, β, γ, δ, ε and other phases. Tin bronzes of technical application have tin content between 1 and 9 at.%. Those alloys are used mostly for mechanical working and characterized with α structural solution. An increase in tin content in bronzes cooled in standard conditions results with appearance next to heterogeneous structure α and also other structures, including brittle phase δ. However, in ancient times daily used objects such as embellishment, tableware or musical instruments were manufactured from high-tin bronzes. A microstructural analysis of those objects indicated that they are produced by hot forging and quenching [3,4,5].
Cu–Sn phase diagram [6]
In this paper, singing bowl purchased in Patan (Nepal) and made from high-tin bronze was analyzed. Those vessels have many applications, e.g., for storing food, very likely due to non-toxicity of a high-tin content and corrosion resistance, as sacrificial dishes and also as instruments for meditations or for sound therapy [5]. In particular, the last property indicates uniqueness of particular bowl. During rubbing or hitting, distinctive sounds can be heard; therefore, similar vessels are also named as sound bowls. Such properties of the bowl owe the chemical composition, in particular, the phase structure of the alloy from which it is made.
Figure 2 shows the view of the tested bowl. It had an approximate diameter of 130 mm. Bowl was cut lengthwise and crosswise in order to obtain samples for analysis from the inside of the material. Analysis of chemical composition was carried out by XRF method. The EDXRF PANalytical Epsilon 3X spectrometer was used for this purpose. In Table 1, results were presented as an arithmetic average of nine measurements. Apart from the main constituents such as Cu and Sn, the presence of metals such as Zn, Pb, Sb, Ag, Fe and Ni was found.
X-ray phase analysis (Fig. 3) was performed on a JEOL JDX-7S X-ray diffractometer using a copper X-ray tube (λCuKα = 1.54178 Å) powered by 20 mA at 40 kV and a graphite monochromator. The recording was carried out with a step method of 0.05° and a count of 3 s in the range of 10°–90° 2θ. The tests were performed on solid samples. Phase identification was carried out using the ICDD PDF-2 database.
In Cu–Sn alloys which have disordered β phase (cubic, cI2, Im\(\bar{3}\)m, a0 = 0.29781–0.29871 nm), martensitic transformation can occur during quenching from the β phase range (586–798 °C depending on the tin content). The martensite phases form in the following way with increasing tin concentration: (a) The \(\beta_{1}^{'}\) (18R) martensite has an ordered orthorhombic structure and is found between 13 and 13.8 at.% Sn, (b) \(\beta_{1}^{''}\)—lamellar composite of structures \(\beta_{1}^{'}\) and \(\gamma_{1}^{'}\) found between 13.8 and 15 at.% Sn, (c) \(\gamma_{1}^{'}\)—ordered orthorhombic (2H structure) formed in alloys between 15 and 15.8 at.% Sn, (d) β’—orthorhombic (4H structure) [6,7,8,9]. Generally, the formation of martensite in β-Cu–Sn alloys is a well-known phenomenon; however, the crystal structure of martensitic phases is not fully explained. The crystal structure of \(\beta_{1}^{'}\) martensite is reported as orthorhombic, monoclinic or triclinic [6, 10,11,12,13]. In case of metastable \(\gamma_{1}^{'}\) phase, hexagonal, orthorhombic or monoclinic crystal structures were reported [6, 10, 12, 13]. Thus, X-ray diffraction analysis encounters difficulties in unambiguous identification of compounds in Cu–Sn alloys. X-ray diffraction pattern of the singing bowl is shown in Fig. 3. It can be seen that the singing bowl consists of α-Cu solid solution (cF4, Fm\(\bar{3}\)m, A1). The lattice parameters of Cu (a0 = 0.369 nm) indicate that the concentration of Sn in Cu is close to 8 at.% and it is above the maximum solubility at room temperature. The results presented in [13] were used to assign the remaining diffraction lines due to insufficient information in the ICDD databases. Soejima et al. obtained separate X-ray diffraction patterns corresponding to \(\beta_{1}^{'}\) martensite with monoclinic or orthorhombic structure and \(\gamma_{1}^{'}\) martensite with orthorhombic structure (a0 = 0.4558, b0 = 0.5402 and c0 = 0.4358 nm) [13]. Comparing their results with XRD pattern presented in Fig. 3 shows that the singing bowl consists of \(\beta_{1}^{''}\) martensite composed of \(\beta_{1}^{'}\) and \(\gamma_{1}^{'}\) compounds.
The microstructure (Fig. 4) was evaluated on an Olympus GX71 metallographic microscope. The chemically digested samples were made in a reagent designed to reveal the microstructure of tin bronzes with the following chemical composition: 5 g FeCl3·6H2O, 2 mL HCl, 98 mL C2H5OH. It has been shown that the matrix of the examined singing bowl is a coniferous phase, which is predominant. Also the occurrence of a second phase of irregular morphology was disclosed. It can be concluded that the structure of the test alloy consists of martensite \(\beta_{1}^{'}\) and \(\gamma_{1}^{'}\) matrix and α-Cu solid solution.
The main goal of this work was to obtain in high-tin bronze structure corresponding to phases identified in tested singing bowl. Based on bowl chemical composition analysis, analogical alloy was prepared. Differential thermal analysis (DTA) was performed in order to determine the presence of phase transitions. Based on thermal analysis results, temperature ranges were determined; subsequently, attempts of cooling of proper structures of alloys were carried out.
Experimental
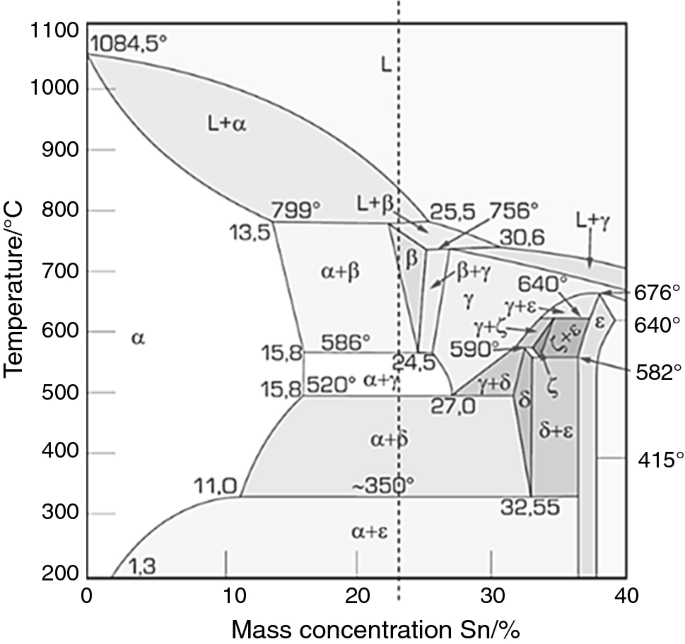
Based on the results of phase and structural analysis of singing bowl, a copper alloy with tin content of approx. 23% was prepared. Pure metals (Cu 99.99% and Sn 99.9%) were melted in a protective atmosphere of argon, in a Balzers VSG 02 single chamber vacuum induction melting furnace. The final temperature reached approximately 1200 °C. Subsequently, the alloy was cast into the graphite mold and cooled down freely in the air. Results of chemical analysis using XRF method are presented in Table 2. Figure 5 shows fragment of Cu–Sn phase diagram with dotted line indicating chemical composition of obtained alloy.
Section of Cu–Sn phase diagram [14]. Dotted line marked chemical composition of studied alloy
Researched alloy was used for preparation of samples of approx. 0.4 g mass that were used for thermal analysis DTA performed on simultaneous thermal analyzer STA 449 F3 Jupiter from NETZSCH company. Measurement was conducted using the following parameters: alundum crucibles, empty reference crucible, protective atmosphere of argon with spectral purity, maximum heating temperature 900 °C and heating/cooling rate 5 °C min−1. Based on obtained results, temperature of phase transition was identified. DTA results are presented in Fig. 6.
The literature data present results of DTA analysis of alloy with similar content of Sn equal to 14 at.% (in this work about 14.3%) [6, 16]. The found liquidus temperature presents good match with data from [14]; however, compared to [15] it is approx. 30 °C lower. Additionally, in the close proximity of liquidus temperature, one can note overlapping peaks occurring during melting. Comparing those with effects accompanying during solidification of the alloy and also looking at derivative, it can be assigned to peritectic reaction (Cu) + L → β reported at 798 °C [15] (in this work designated as L + α ↔ L + β transition) and phase transition L + β ↔ β.
Subsequently, in the literature eutectoid reaction at 586 °C (β → (Cu) + γ) [15] can be found. However, temperature 567 °C obtained in presented experiment (transition marked as α + β ↔ α + γ) is proximal to the value of 566 °C obtained from work [16]. As it is commented by the author of [16], it indicates the presence of a second-order transition between β and γ. Additional confirmation for this assumption can be the presence of thermal effect occuring also during cooling (570 °C) that shows good compatibility with order–disorder transition observed in alloys from Ni–Al–Cr or Fe–Al systems [17,18,19,20].
The presence of transition marked in this paper as α + γ ↔ α + δ was stated based on distinct thermal effect observed during heating and cooling (respectively, 506 °C and 503 °C). In the literature, this transition is described as eutectoid reaction (γ → (Cu) + δ) at 520 °C [15] or 518 °C [16]. Result obtained in this paper, however, is similar to the one obtained during thermal derivative analysis (TDA) of alloy CuSn20-C with transition temperature for γ → δ of 502 °C [21].
Another eutectoid reaction that can be found in the literature: δ → (Cu) + ε was estimated at 350 °C [15]. In this paper, the presence of transition in the close proximity of that temperature was stated and described as α + δ ↔ α + ε. This value is approx. 25 °C higher compared to the literature. During TDA analysis in paper [21], described reaction is not mentioned that was explained by insignificant copper diffusion.
Table 3 presents a summary of temperatures determined in this paper together with referring transitions. Dotted lines in Fig. 6 present selected temperature (450 °C, 550 °C, 650 °C and 725 °C) to heat treatment and structural analysis.
Additional DTA measurements were conducted with different heating and cooling rates (respectively, 10, 15, 20, 25 and 30 °C min−1). Based on results presented in Fig. 7, it was stated that, with an increase in heating and cooling rate, thermal effects on DTA curve, not related to melting and solidification, become less distinct, which makes identification of subtle transition more difficult, especially compared to analysis for rate 5 °C min−1. This behavior results from features of the DTA method, especially related to the heat transfer rate between sample and crucible and between crucible and thermocouple. Large differences indicate that studied alloy shows a tendency to turn into non-equilibrium state during rapid cooling [17, 18].
Results and discussion
Based on results of DTA analysis and Cu-Sn phase diagrams study, four temperatures were selected to heat treatment and structural analysis. Studied alloy was homogenized at temperature 725 °C for 4 h. A heat treatment was performed on so-prepared alloy. Heating at temperature 450 °C, 550 °C, 650 °C and 725 °C for 1.5 h with quenching in water was done. After every stage of heat treatment, metallographic samples were prepared and polished with 240–1200-grit papers. A Hitachi S-3400-N SEM was used to examine the microstructure. The backscattered electron (BSE) technique was applied to obtain better contrast, and EDS analysis was performed in standardless mode. The acceleration voltage was equal to 15 kV, and working distance was 10 mm (optimal for the given take-off angle in the SEM).
In Fig. 8, microstructure of studied alloy after heat treatment was shown. After homogenization, structural α-Cu solid solution as well as δ phase was observed. Both phases showed different morphologies, although as indicated by the elongated shape of two phases, they retained the primary structure. Studied alloy after treatment at 450 °C exhibited a similar structure to the alloy after homogenization, but morphology of phases was clearly changed. The elongated shape of two phases disappeared in order to form irregular shapes. The SEM microstructure together with analysis of chemical composition in microareas by EDS seemed to confirm the presence of the δ phase. In α-Cu solid solution, annealing twins were formed. Treatment at 550 °C affected the phase transition δ ↔ γ. EDS analysis seemed to confirm the presence of the γ phase in place of the previous δ phase. The γ phase expanded on cost of decay α-Cu solid solution. Treatment at 650 °C and at 725 °C influenced significant change in morphology of the alloy matrix. One could notice the formation of coniferous structure significantly similar to that observed in singing bowl. It was therefore very probable that heat treatment at 650 °C and at 725 °C with quenching in water influenced the formation of a metastable matrix structure in the form of martensite \(\beta_{1}^{'}\) and \(\gamma_{1}^{'}\) next to α-Cu solid solution.
Conclusions
-
1.
Traditional singing bowl made of bronze owes its characteristic properties to the phase structure obtained through appropriate heat treatment.
-
2.
Phase composition of singing bowl indicates the presence of metastable martensite \(\beta_{1}^{'}\), \(\gamma_{1}^{'}\) and α-Cu solid solution which was confirmed by XRD and microscopic analysis. Areas of α phase are located in formed into thin plates martensite \(\beta_{1}^{'}\) and \(\gamma_{1}^{'}\) matrix.
-
3.
An alloy with chemical composition similar to the singing bowl was prepared using the induction melting method and subjected to thermal analysis. This allowed to identify temperatures in which phase transitions occur.
-
4.
Studied alloy was subjected to a heat treatment consisting of heating and quenching in water. After the treatment at 650 °C and 725 °C, the same structure as in a singing bowl was obtained, which confirms that the structure of the bowl is a result of hardening.
References
Schlechten AW, Butts A, Taylor JC. Copper processing. In: Encyclopædia Britannica. 2017. https://www.britannica.com/technology/copper-processing. Accessed 06 Oct 2017.
Kahane H, Kahane R. Byzantium’s impact on the west: the linguistic evidence. Ill Class Stud. 1981;06:395.
Voce E. Examination of specimens from the Pitt Rivers Museum. In: Coghlan HH, editor. Notes on the prehistoric metallurgy of copper and bronze in the Old World. Pitt Rivers Museum Occasional Papers on Technology. Oxford: The University Press; 1951. p. 105–11.
Shemakhanskaya MS. New aspect of the origin of ancient bronze. Bull Met Mus. 1991;16:3–9.
Srinivasan S. The use of tin and bronze in prehistoric southern Indian metallurgy. JOM 1998;50:44–50.
Saunders N, Miodownik AP. The Cu–Sn (copper–tin) system. Bull Alloy Phase Diagr. 1990;11:278–87.
Warlimont H. Iron and Steel lnst., Special Rep., 1965;93:58.
Kennon NF, Miller TM. Martensitic transformations in beta-1 Cu–Sn alloys. Trans Jpn Inst Met. 1972;13:322.
Miura S, Morita Y, Nakanishi N. Superelasticity and shape memory effect in Cu–Sn alloys. In: J. Perkins, editor. Shape memory effects in alloys. Boston: Springer; 1975. https://doi.org/10.1007/978-1-4684-2211-5_18.
Nishiyama Z. Martensitic transformations. In: Fine MD, Meshii M, Wayman CM, editors. Material science and technology. New York: Academic Press; 1978. https://doi.org/10.1016/B978-0-12-519850-9.50001-6.
Artunc E, Cakmak S, Cakmak S. Crystallographic analysis of martensitic transformation in CuSn alloy. Turk J Phys. 2000;24:737–45.
International Centre for Diffraction Data (ICDD) to Powder Diffraction File (PDF) describing phases that appear in this work. The number 00-006-0621 indicates the following work: Isajcev I. Zh. Tekh. Fiz. 1947;17:829.
Soejima T, Hagiwara H, Nakanishi N. Remarks on X-ray diffraction patterns of martensite in β Cu–Sn alloys. Trans Jpn Inst Met. 1964;5:273.
Dobrzański L. Materiały inżynierskie i projektowanie materiałowe. 2nd ed. Warszawa: WNT; 2006.
Saunders N, Miodownik AP. Cu–Sn (copper–tin). In: Massalski TB, editor. Binary alloy phase diagrams. 2nd ed. Ohio: The Materials Information Society; 1990. p. 1481–3.
Fürtauer S. Investigation of relevant phase diagrams for high temperature solder materials: the binary systems Cu–Sn and Cu–Sb. Vienna; 2010. http://othes.univie.ac.at/10616/.
Maciąg T, Rzyman K, Przeliorz R. DSC analysis of order-disorder transition in Ni3Al based alloys from Ni–Al–Cr system. Arch Metall Mater. 2015;60:1871–6.
Maciąg T, Rzyman K. Determination of γ’ + γ/γ phase boundary in Ni–Al–Cr system using DTA thermal analysis. Arch Metall Mater. 2016;61:237–40.
Jabłońska M, Mikuskiewicz M, Śmiglewicz A, et al. Study of phase transformation in alloys of the Al–Fe system. Defect Diffus Forum. 2012;326:573–7.
Bernstock-Kopaczynska E, Jabłońska M. Determination of thermal diffusivity and influence of defect structure in alloys based on the Fe–Al system. Defect Diffus Forum. 2013;336:129–34.
Bartocha D, Baron C. The Secret” of traditional technology of casting bells. Arch Foundry Eng. 2015;3:5–10.
Acknowledgements
The work was supported by the Ministry of Science and Higher Education within the framework of the BK-221/RM0/2018.
Author information
Authors and Affiliations
Corresponding author
Additional information
Publisher's Note
Springer Nature remains neutral with regard to jurisdictional claims in published maps and institutional affiliations.
Rights and permissions
Open Access This article is distributed under the terms of the Creative Commons Attribution 4.0 International License (http://creativecommons.org/licenses/by/4.0/), which permits unrestricted use, distribution, and reproduction in any medium, provided you give appropriate credit to the original author(s) and the source, provide a link to the Creative Commons license, and indicate if changes were made.
About this article
Cite this article
Jabłońska, M., Maciąg, T., Nowak, M. et al. Thermal and structural analysis of high-tin bronze of chemical composition corresponding to the composition of the singing bowl. J Therm Anal Calorim 137, 735–741 (2019). https://doi.org/10.1007/s10973-019-08015-z
Received:
Accepted:
Published:
Issue Date:
DOI: https://doi.org/10.1007/s10973-019-08015-z


