
M-001
Application of PK/PD Modeling in Lead Optimization and Human Dose Projection in a Covalent Inhibitor-Based Drug Discovery Project
Aberra Fura, Mary Obermeier, Joe Tino, Jim Burke, Punit Marathe and Zheng Yang
Bristol-Myers Squibb, Princeton, NJ; Research and Development, USA
Objectives: This work demonstrates how PK/PD modeling that integrates drug and system properties was used in a covalent inhibitor-based drug discovery project to guide lead optimization, selection and projection of human dose.
Methods: The model was developed using data generated in a preclinical mouse model of PK/PD/efficacy with BMS-X and further substantiated with clinical data. Basal level and rate of degradation of the target protein, and apparent rate of inactivation were determined. A PK/PD model was built using the system parameters and the drug pharmacokinetics parameters to predict the extent and time course of inactivation of the target protein. The PK/PD model was then used to guide optimization for optimal pharmacokinetics and rate of inactivation in order to achieve a lead candidate with low efficacious dose and low daily covalent binding burden. Impact of down- or up-regulation and rate of synthesis of the target protein on the efficacious doses was also examined.
Results: The PK/PD model adequately described the time course of inactivation of the target protein by BMS-X in the preclinical mouse model. The model showed that, contrary to popular views, high drug clearance could lead to significantly higher doses and that Cmax alone may not be enough for desired extent of inactivation of the target protein even for irreversible inhibitors. The model further showed that a combination of optimal PK and rate of inactivation is required to achieve a low efficacious dose (< 15 mg) and low daily covalent body burden as demonstrated by the final lead compound that was advanced to the clinics.
Conclusions: The work showed that PK/PD modeling approach could significantly impact lead optimization and selection of irreversible covalent inhibitors during drug discovery. To achieve low and desirable efficacious doses, optimization of drug pharmacokinetics in consult with the target turnover rate, its basal concentration, and drug intrinsic potency is critical.
M-002
Using visualization to address the reliability of sources of initial parameter values in a Quantitative Systems Pharmacology model
Abhishek Gulati1, Stacey Tannenbaum1
1Modeling & Simulation, Clinical Pharmacology & Exploratory Development, Astellas Pharma., Northbrook, Illinois
Objectives: An important aspect of quantitative systems pharmacology (QSP) model development is the identification of initial parameter values. Published QSP models usually present tables with parameter values including their sources as references. Reliability of the parameter values is never evident, and evaluating each reference individually can be an enormous undertaking for models that have hundreds of parameters. The aim of this work is to develop a simple, clear, intuitive visualization that aids in evaluating the reliability of parameter sources in a QSP model framework.
Methods: Various strategies were investigated for presentation of parameter sources for an internal QSP model under development. Different visualizations with varying patterns, colors, and sizes of components were developed that ultimately resulted in an intuitive self-explanatory figure that summarized the reliability of parameter sources for the entire model in a single comprehensive graphic. Graphics were created in MATLAB vR2018a.
Results: Figure 1 shows the final proposed graphic. For each ODE in the model, a row of boxes was created, with each box representing a parameter used in that ODE. Green, yellow and red boxes show the source of the respective parameter being human, animal or in vitro data, respectively. In this example, the higher number of green boxes signify that most of the parameters in the model have human data as the source. This would give the reader much higher confidence on the model and resulting simulations. Yellow and red boxes indicate that the parameter values may be less reliable, and would suggest a sensitivity analysis or further validation, via additional mining of the literature or in vivo experiments.
Conclusions: A simple, comprehensive, and intuitive visualization was developed that highlights the sources of initial parameter values in a QSP model and their reliability. These strategies will help streamlining the validation and reporting of QSP models.

M-003
A Physiologically-based Pharmacokinetic Model for Voriconazole to Explore Apparent Differences in Pharmacokinetics between Adults and Children
Ahmed Elmokadem1,4, Marc R Gastonguay1,4, Kyle T Baron1, Kyle Barrett1,2, Nicole Zane3, Tara Yankee4 and Matthew M Riggs1
1Metrum Research Group, LLC, Tarriffville, CT, USA; 2Drexel University, Philadelphia, PA, USA; 3Children’s Hospital of Philadelphia, Philadelphia, PA, USA; 4University of Connecticut, Storrs, CT, USA
Objectives: Characterize voriconazole pharmacokinetics (PK), including potential influence of intestinal, first-pass metabolism following oral dosing, in adults and pediatrics using physiologically-based pharmacokinetic (PBPK) modeling.
Methods: A reported voriconazole PBPK model, without (ZT) and with intestinal clearance for pediatrics (ZTGu), was implemented in the open-source R package mrgsolve. The most influential ZT parameters were investigated through sensitivity analyses, followed by optimization (optim function). Improvement of previous over-predictions following adult oral dosing was investigated with inclusion of intestinal clearance (CLGu). CLGu was calculated from hepatic clearance as the relative difference in expression of voriconazole metabolizing enzymes in liver and intestine (CLGu,calc).
Results: Sensitivity analyses highlighted muscle:plasma partition coefficient and blood:plasma concentration ratio as the two most influential parameters. Optimization of these parameters yielded improved model predictions for the IV infusion dosing that were comparable to ZT predictions; RMSE = 0.49 and 0.38, compared with 0.55 and 0.34 from ZT, for adults and pediatrics, respectively. CLGu added to adults (and pediatrics) provided notable improvement in predictions of adult oral dosing: AUCss,0–12/Cmax were 12.17/2.01 (observed), and 21.05/2.24 and 17.1/2.02 mg.h.L−1/mg.L−1 from ZT and CLGu models, respectively. Estimated CLGu was different between adults and pediatrics, e.g., in a 19 kg, 5 yo pediatric patient was 0.22 mL/min/kg or about 3-fold that of a 73 kg, 30 yo adult patient (0.08 mL/min/kg).
Conclusions: A voriconazole PBPK model translated using mrgsolve, with further development and optimization, notably improved predictions of IV and oral voriconazole PK in pediatrics and adults. The model suggested a difference between oral voriconazole PK in adults and children may be attributed to the magnitude of intestinal metabolism between the populations and this difference suggests the need for a higher relative oral dose for pediatrics (7–8 mg/kg) compared to adults (~ 3 mg/kg) to achieve similar exposure.
M-004
Combined Efficacy and Safety Modeling and Simulation Approach to Inform Drug Development Decisions for an Oral Gonadotropin-releasing Hormone (GnRH) Receptor Antagonist
Ahmed Nader1, Insa Winzenborg1, Ahmed Suleiman1, Akshanth Polepally1, Juki Ng2, Mohamad Shebley1, Peter Noertersheuser1, Nael Mostafa1, Walid Awni1
1Clinical Pharmacology and Pharmacometrics, AbbVie, Inc., North Chicago, IL, USA. 2Clinical Development, AbbVie, Inc., North Chicago, IL, USA
Objectives: An oral GnRH receptor antagonist (GnRHA) under development for management of endometriosis with associated moderate to severe pain results in partial estradiol suppression, alleviation of pain (e.g. dysmenorrhea (DYS) and non-menstrual pelvic pain (NMPP)), and some hypoestrogenic effects (e.g. changes in bone mineral density (BMD)). The objective of this analysis was to develop a clinical pharmacology modeling and simulation framework to predict key efficacy and safety outcomes under several GnRHA dosing scenarios to inform drug development decisions.
Methods: A discrete-time Markov Chain model was used to describe the time-course of DYS and NMPP responses using data from > 1670 subjects in four Phase 3 studies (150 mg QD and 200 mg BID). Additionally, an indirect response model was developed to describe GnRHA effects on BMD changes (NONMEM 7.3). Following covariate selection, exposure-efficacy/safety models were combined to conduct clinical trial simulations predicting GnRHA efficacy and BMD changes under several dosing scenarios.
Results: Both exposure–response models adequately described observed data with higher GnRHA concentrations resulting in more pain control and BMD changes. Higher baseline DYS and NMPP pain scores were significantly associated with higher placebo pain response rates. African American race, higher body mass index (BMI), and lower C-terminal telopeptide levels were significantly associated with higher baseline BMD. Baseline BMI was also associated with higher bone formation rates regardless of GnRHA treatment. Model simulations suggest that continuous GnRHA dosing for 12 months, mean (95% CI) BMD % change from baseline is predicted to be −0.94% ( −1.34%, −0.41%) and −2.65% ( −3.21%, −1.96%) for 150 mg QD and 200 mg BID doses, respectively.
Conclusions: GnRHA efficacy and effects on BMD changes are not affected by patient baseline demographics or disease characteristics. The combined efficacy-safety modeling platform can be used to conduct future simulations to inform GnRHA dosing and drug development decisions.
M-005
A Model Based Meta-Analysis to support development of drugs for treatment of Diabetic Peripheral Neuropathy (DPN), Post Herpetic Neuralgia (PHN) and Fibromyalgia
Akshita Chawla (1)*, Richard Franzese (2)*, Leticia Arrington (1)*, Han Witjes (2), Mark Lovern (2) and Sreeraj Macha (1)
(1) Merck & Co., Inc. (2) Certara Strategic Consulting
*Equal Contribution
Objectives: The objective of the analysis was to develop a Model Based Meta-Analysis (MBMA) comparator model for neuropathic pain to provide a quantitative framework for comparison of drugs commonly used for the treatment of diabetic peripheral neuropathy (dpn), post herpetic neuralgia (phn) and fibromyalgia. Average pain score change from baseline was considered as the primary endpoint for this analysis.
Methods: A systematic review of the literature was conducted using a predefined inclusion/exclusion criteria. The database captures publicly available, summary-level clinical trial data from 111 trials, representing 31,041 patients. The response in the MBMA model was described as the sum of a trial specific non-parametric (unstructured) placebo effect and a parametric drug effect depending on indication, dose, time, model parameters and covariates. Dose–response was estimated where possible, with drug-specific treatment effects within indication using a shared Emax within a drug class and a drug-specific potency (ED50). Covariates were graphically explored and tested for statistical significance.
Results: The available average pain score data were well described by an Emax model. The final MBMA model shows that the magnitude of placebo response differs between indications. The estimated placebo response for average pain at 8 weeks was approximately −16, −13 and −12 points for dpn, phn, and fibromyalgia respectively. Baseline pain score was identified as a significant covariate whereby the average pain score decreased as the baseline pain score increased. Age and disease duration were also identified as significant covariates on efficacy. All other covariates (sex, BMI, race etc.) were not found to be significant.
Conclusions: Placebo response and drug effects differed markedly across indications. The model derived from this analysis will provide a quantitative framework for benchmarking new investigational compounds to SOC and improve understanding of their dose–response relationship to inform clinical development.
M-006
Development of an innovative multi-state repeated time-to-categorical event placebo effect model for migraine prophylaxis trials
Alejandro Perez-Pitarch1, Sreedharan Sabarinath1, Gopichand Gottipati2, Ramana Uppoor1, Mehul Mehta1
1Division of Clinical Pharmacology I, Office of Clinical Pharmacology, US Food and Drug Administration, Silver Spring, MD, USA 2Division of Pharmacometrics, Office of Clinical Pharmacology, US Food and Drug Administration, Silver Spring, MD, USA
Objectives: Migraine-days reduction is a clinically acceptable primary endpoint for migraine prophylaxis trials but entails difficulties from a modeling and simulation perspective. Developed models should simultaneously describe rate, severity and duration of migraine episodes (ME). The objective of this project was to develop a fit-for-purpose model for migraine prophylaxis trials and to investigate placebo effect.
Methods: In-house data from episodic migraine patients in placebo arms from multiple studies were used. Models were developed using NONMEM7.3. A survival model was combined with an ordered categorical model to form the repeated time-to-start of categorical ME model, which simultaneously described the time-to-start of ME and the severity of the starting ME(1). This was linked to a repeated time-to-end of ME model with a different hazard function depending on the severity of the ongoing episode (Figure 1). The performance of the final model was internally and externally validated.
Results: Patients responding to placebo had a reduction in rate of ME, an increase in mild ME proportion and a reduction in severe ME proportion. Age was related to ME duration (e.g. predicted severe episode-duration is 12 h for a 20-year-old patient vs. 7.5 h for a 60-year-old patient). The model was successfully validated.
Conclusions: The model represents an innovative modeling and simulation framework for clinical trials in migraine prophylaxis, successfully describes placebo effect and could be used to investigate the exposure–response relationship of drugs. This framework could also be useful in other therapeutic areas where the rate, duration and severity of disease episodes are relevant to trial outcomes.
The opinions expressed are those of the authors, and should not be interpreted as the position of the US Food and Drug Administration.

Fig. 1 Schematic representation of model
Reference
-
1.
Plan EL et al. Approaches to simultaneous analysis of frequency and severity of symptoms. Clin Pharmacol Ther.2010;88(2):255–9.
M-007
Application of Modeling and Simulation (M&S) in Design and Discovery of Multi-Specific T-cell Redirecting Antibodies
Aman P. Singh, Thomas Carpenter, Alice Zong, Donald Heald and Weirong Wang
Translational Research, Biologics Development Sciences, Janssen R&D, PA
Background: Recent advances in antibody engineering have facilitated innovation of novel platforms with the ability to target ≥ 2 antigens simultaneously. Such molecules have the potential to achieve enhanced potency and/or tumor selectivity by targeting multiple tumor antigens, e.g. antigens that are truly tumor-specific but sparsely expressed on tumors and antigens that are abundantly expressed on tumors but also expressed on normal tissues at lower levels. Use of M&S can serve as a linchpin in guiding discovery and design of these molecules.
Objectives: To develop a novel target-engagement model capable of 1) characterizing the binding to two different antigens co-expressed on a tumor cell and 2) combining with a third arm binding to CD3 receptors on T cells to form a synapse for T cell-mediated killing of tumor cells. The avidity effects of the two tumor antigens due to enhanced cross-arm binding efficiency was also incorporated within the modelA.
Methods: A therapeutic scenario was hypothesized where Target A was expressed both in tumor (105 copies) as well as normal (103 copies) tissues whereas Target B was highly restricted within tumor tissue (103 copies). A tri-specific modality was designed, with bivalent binding to Target A incorporated to improve tumor selectivity, and monovalent binding to both Target B and CD3. The model (Fig. 1) incorporated simultaneous interactions between different biologic-target complexes and their engagement with CD3-expressing T cellsB. Two different avidity effect parameters (χ) describing enhanced binding efficiency were incorporated between biologic interacting with targets A–A and A–B. Finally, simulations were performed for overall target cell-biologic-effector cell (TBE) complex formation in normal c.f. tumor cells to predict the desired affinity combination resulting in wide-most therapeutic window.
Results and Conclusion: Model simulations revealed the desired affinity combinations for given Target A, Target B and CD3, showing its value in design of these complex multi-specific molecules.

Fig. 1 Schematics for a target cell-biologic-effector cell engagement model for tri-specific biologics
References
Zheng A, et al. mAbs, 2016, 551–561.
Jiang B, et al. mAbs, accepted
M-008
Translational PK/PD Predictions as an Alternative to Antituberculosis Early Bactericidal Activity Phase IIA Studies
Amelia N. Deitchman1, Nan Zhang1,2, Eric Nuermberger2, Rada M. Savic1
1Department of Bioengineering and Therapeutic Sciences, University of California, San Francisco; 2Center for Tuberculosis Research, Department of Medicine, Johns Hopkins University School of Medicine
Objectives: Early clinical efficacy of novel antituberculosis drugs are evaluated in Early Bactericidal Activity (EBA) Phase 2A studies, quantifying bacterial kill in sputum of TB patients for up to 2 weeks monotherapy. As the first clinical efficacy studies, EBA trials have historically been used to determine the minimum effective dose. However, the lack of evidence linking EBA to treatment outcome has shifted their focus to be more “confirmatory” of preclinical efficacy. Here we investigate if EBA study metrics can be reliably predicted using preclinical PK/PD knowledge linked with clinical PK information.
Methods: Clinical PK models were linked to a previously-established translational mouse-to-human model1, consisting of “systems” parts describing bacterial growth, immune response, and drug-specific aspects (i.e. protein binding, concentration-effect relationships). Preclinical PKPD parameters were obtained by fitting a mechanistic model to PK-CFU data from BALB/c mouse models. Growth dynamics and bacterial kill were simulated in patients for rifampin, rifapentine, pyrazinamide, and isoniazid in NONMEM (v7.4). Relevant clinical PK covariates (e.g. sex, NAT2 acetylator status, food effects) were included. Calculated EBAs (decline in log CFU/mL/day) and 95% prediction intervals were compared to reported literature EBAs.
Results: This in silico approach confirmed positive clinical efficacy for all drugs and > 95% of all EBA results were within a 2.5-fold range of observed EBAs (Figure 1). Dose–response aspects of bacterial kill were well-preserved. Given EBA studies’ small sample sizes, it was critical to account for covariate differences in simulations.
Conclusions: A translational “mouse-to-human” model successfully predicted and confirmed early clinical efficacy for 4 major TB drugs from different classes. This tool, once further validated with novel drug classes, will offer an alternative approach to the efficacy component of EBA studies. Our work further confirms relevance of a mouse model linked with a mechanistic modeling platform as a key translational tool in TB drug development.

Reference
-
1.
CTS.2017;10(5):366
M-009
Predictions of Isavuconazonium Sulfate Dosage in Patients Aged 6 months - < 18 years by Physiologically Based Pharmacokinetic Modeling and Allometric Scaling
Amit Desai1, Laura Kovanda1, Christopher Lademacher1, William Hope2, Michael Neely3, Peter Bonate1 and Andrea Edginton4
1Astellas Pharma, Inc., Northbrook, IL, 2University of Liverpool, Liverpool, United Kingdom, 3University of Southern California, Los Angeles, CA, 4Design2Code Inc., Waterloo, ON, Canada
Objectives: To predict pediatric equivalent doses (PED) for patients between the ages of 6 months to 17 years, using physiologically based pharmacokinetic (PBPK) modeling and allometric scaling.
Methods: PED were predicted for patients aged 6 months and < 18 years using PBPK modeling and compared to predictions made by allometric scaling. Allometric scaling was performed in NONMEM 7.2, with allometric exponent fixed to 0.75 for clearance and 1 for volume related parameters. All PBPK simulations were completed using PK-Sim®, which implements a whole-body PBPK model with 15 organs and appropriate maturation of anatomical and physiological parameters for pediatrics. The adult PBPK model was built using knowledge of drug physico-chemistry and clearance partitioning. Simulations were performed to predict optimal doses in pediatrics based on age and weight to achieve at least a median steady-state daily area under the curve (AUCss) of 100 mg*h/L, and the majority below 230 mg*h/L. These targets were derived from efficacy and safety data in clinical trials with adults.
Results: As shown in the Figure, an isavuconazonium sulfate dose of 10 mg/kg is expected to result in AUCss within the target range for the majority of patients > 1 year old, in agreement with that predicted by allometry for patients aged 2–17 years. For patients aged 6 months to 1 year, a dose of 6 mg/kg predicts comparable exposures.
Conclusion: A proposed isavuconazonium sulfate dose of 10 mg/kg administered every 8 h for the first 2 days and once daily thereafter is predicted to result in safe and efficacious steady state exposures in patients aged 1–17 years, similar to predictions from allometric scaling for patients aged 2–17 years. For subjects aged 6 months to 1 year, a dose of 6 mg/kg is predicted to achieve similar exposures. These doses are tested in clinical trials to confirm.

M-010
Routine clinical care data for population pharmacokinetic modeling: the case for Fanhdi/Alphanate in hemophilia A patients
Pierre Chelle1; Cindy HT Yeung2; Santiago Bonanad3; Juan Cristóbal Morales Muñoz4; Margareth C Ozelo5; Juan E Megías Vericat3; Alfonso Iorio2,6; Jeffrey Spears7; Roser Mir8; Andrea Edginton1
1School of Pharmacy, University of Waterloo, Waterloo, ON, Canada; 2Department of Health Research Methods, Evidence, and Impact, McMaster University, Hamilton, ON, Canada; 3Hospital Universitari i Politècnic La Fe, Valencia, Spain; 4Complejo Asistencial Dr. Sótero del Río, Santiago, Chile; 5Unidade de Hemofilia IHTC ‘Claudio L. P. Correa’, Instituto Nacional de Tecnologia do Sangue, Hemocentro; NICAMP, University of Campinas, Campinas, Brazil; 6Department of Medicine, McMaster University, Hamilton, ON, Canada; 7Grifols, Research Triangle Park, NC, United States; 8Grifols, Sant Cugat, Spain
Objective: The Web-Accessible Population Pharmacokinetic Service–Hemophilia (WAPPS-Hemo) platform provides hemophilia treaters with a PopPK application to estimate individual parameters for clotting factors using sparse samples to tailor prophylaxis. PopPK models are usually built for the platform using clinical trial data. To increase the range of concentrate-specific models, we tested the use of routine clinical care data uploaded to the platform to derive a Fanhdi/Alphanate-specific model for which no trial data is available.
Materials and Methods: Plasma factor activity measurements and covariate data from hemophilia A patients on Fanhdi/Alphanate were extracted and split into a derivation and evaluation cohort. NLME and Bayesian post hoc estimations were completed in NONMEM (ver7.3). Evaluation of Bayesian forecasting included 10-fold cross validation, limited sampling analysis and external evaluation using subsequently collected WAPPS data. A comparison between a generic FVIII model on WAPPS and the Fanhdi/Alphanate model assessed the importance of developing concentrate-specific models for the platform.
Results: Post-infusion measurements from 67 patients from three centers (Campinas, Brazil; Valencia, Spain; and Santiago, Chile) were used for derivation. Measurements on 25 patients from the remaining WAPPS centres were used for validation. Patients were 1–71 yrs (~ 40% < 20 yrs) each with 1–8 samples over 72 h. As the evaluation cohort was well-described, a final model was re-fit using all data and followed 2-compartment kinetics with fat-free mass and age as covariates. Three-sample designs produced non-biased estimates (Figure 1) with precision similar to other models in WAPPS. Bayesian estimation using the generic FVIII and Fanhdi/Alphanate specific model produced similar half-lives [mean difference (90% CI) = 0.89 h (0.06–3.30), p = 0.085].
Conclusions: The use of real-world data for model development is feasible and expands the covariate space for what is traditionally included in trials. Evaluation of the model for Bayesian forecasting resulted in equivalent outcomes as models developed from rich sampling data

Fig. 1 Boxplots of the errors in the individual half-life estimates between rich sampling and 3-sample designs in limited sampling analysis of 1000 virtual PK profiles.
M-011
Translational prediction of drug-induced neutropenia for TAK-264, a GCC-targeted antibody drug conjugate
Andy Z.X. Zhu, Qin Wang, Huyuan Yang, Chirag Patel, Dean Bottino, Matt Wagoner, Thea Kalebic, Mary Carsillo, and Cindy Xia
Millennium Pharmaceuticals, Inc., Cambridge, MA, a wholly owned subsidiary of Takeda Pharmaceutical Limited Company
Introduction: TAK-264 is an antibody drug conjugate (ADC) comprised of a human IgG1 monoclonal antibody targeting guanylyl cyclase C, a potent microtubule-disrupting agent monomethyl auristatin E (MMAE) and a linker (licensed from Seattle Genetics). Myeloid suppression, particularly neutropenia, was observed in TAK-264 cynomolgus monkey toxicology studies and clinical studies in patients with gastrointestinal malignancies.
Objectives: To use translational pharmacokinetic/pharmacodynamic (PK/PD) modeling approaches to: 1) better understand the impact of dosing regimen on neutropenia risks, 2) estimate the potential risks of grade 3 or 4 neutropenia based on toxicology data, and 3) compare the predicted neutropenia values to the observed values in humans.
Methods: PK and absolute neutrophil count (ANC) data from 50 monkeys were modeled using a 2-compartment PK model and a semi-mechanistic model quantifying myeloid suppression of anticancer agents adapted from Friberg et al., 2002 (PMID: 12488418). The model was able to describe well the PK, nadir of ANC and ANC recovery in monkeys for all dose levels tested. The model was then translated into the human setting by changing parameters for monkey PK, drug sensitivity, and physiology to those of the predicted human PK, in vitro drug sensitivity, and published human physiology.
Results: For TAK-264, the translational model predicted a maximum tolerated dose (MTD) of 2.1 mg/kg using monkey ANC data and the observed human MTD of 1.8 mg/kg. The simulation suggested that Q2W and Q3W dosing would result in a better tolerability profile compared with the Q4W dosing schedule.
Conclusions: A translational PK/PD model for neutropenia was implemented for TAK-264. The model-based analysis predicted the clinical MTD. Also, the model suggested that Q2W and Q3W dosing schedule could be better tolerated than less frequent dosing in humans at a given total cycle dose.
M-012
Towards predictive longitudinal PKPD models of antimalarial combinations with Phase 2b data
Anne Kümmel (1), Daniel Kaschek (1), Bart E. Laurijssens (2), Nathalie Gobeau (3), Fiona MacIntyre (3)
(1) IntiQuan GmbH, Basel, Switzerland (2) BEL Pharm Consulting, Chambonas, France, (3) MMV, Geneva, Switzerland
Objectives: The World Health Organization recommends artemisinin-based combination therapies against malaria. However, the emergence of resistance calls for the generation of new drug combinations. Medicines for Malaria Venture (MMV) and its partners tested a new drug combination, artefenomel with piperaquine, in patients. A logistic regression model for treatment success was built [1], however, not using entire time course data. Extrapolation to different dosing regimens of this model is delicate. Here, a longitudinal PKPD model for the combination treatment of artefenomel and piperaquine is developed.
Methods: A population PKPD model was build using data from three Phase 2 trials with either artefenomel monotherapy or artefenomel and piperaquine combination therapy. A sigmoidal model was used to link drug concentrations with parasite clearance. The mutual impact on the maximum effect (Emax) or the potency for one drug (EC50) by the other was accounted for [2]. PD parameters for piperaquine were estimated or fixed to values determined in a previous monotherapy controlled human malaria infection (CHMI) study.
Results: The developed model accurately described the observed individual profiles and the fraction of recrudescent patients over time as shown in visual predictive checks. Fixing the piperaquine PD parameters to CHMI estimates resulted in a biologically plausible model.
Conclusion: The agreement of observed and predicted time courses demonstrates the power of longitudinal modeling, making use of all available data. Two critical data aspects were highlighted: a) availability of monotherapy data for both compounds, and b) presence of recrudescence events (treatment failures). In the future, MMV is planning to test both mono- and combination therapy in controlled human malaria infection studies prior to going into patients including subtherapeutic doses, enriching the data with information about treatment failures and monotherapy data.
References
-
1.
Macintyre et al. BMC Medicine 2017 15:181.
-
2.
Wicha et al., Nature Communications (2017) 8, 2129.
M-013
A Model-based Approach to Bridge IL-2 Mediated Immune System Pharmacodynamics from Healthy Subjects to an Autoimmune Disease Population
Ari Pritchard-Bell1, Vaishali L Chudasama1, Nadia Tchao1, Kevin S Gorski1, Sameer Doshi1
1Amgen Inc., Thousand Oaks, CA, USA
Objectives: We use mathematical modeling to project pharmacodynamics in an immunosuppressed disease population using data from literature and a healthy volunteer study.
Methods: Data from two low-dose IL-2 studies [1, 2] were combined with data from healthy volunteers who received a single dose of AMG 592, an IL-2 mutein. The dataset was used to approximate the difference between single and multiple doses and the effect of immunosuppressive agents on regulatory T-cell dynamics following IL-2/AMG 592 administration.
Results: A PK/PD model approximating a non-immunosuppressed response of regulatory T-cells to IL-2 was calibrated with data in which a single dose of IL-2 was administered to type 1 diabetes patients [1]. The IL-2 mediated T-cell growth parameter was scaled to capture another dataset, in which daily IL-2 was administered to patients with graft-versus-host disease [2]. The modified T-cell growth parameter captures key differences between the two studies: single-dose, non-immunosuppressed versus multiple-dose, immunosuppressed subjects. The modified T-cell growth parameter was applied to a separate model describing the AMG 592 single-dose healthy volunteer study to predict the expected regulatory T-cell dynamics following multiple doses of AMG 592 in immunosuppressed patients and select starting doses for the subsequent proof-of-concept study.
Conclusions: Starting doses of a proof-of-concept study were selected by translating healthy volunteer data using mathematical modeling. The model accounts for the immunosuppressive effect on regulatory T-cell dynamics by scaling a growth parameter and accounting for different baseline cell counts. This work shows how published clinical trial results can be leveraged with modeling to inform key development decisions and study design.
References
-
1.
Todd et al., PLOS Medicine, 13(10):e1002139, Oct. 2016.
-
2.
Koreth et al., Blood, 128(1):130–137, Jul. 2016.
M-014
A Markov Transition Model for Characterization of Exposure–Response of Tofacitinib During Maintenance Therapy in Patients with Ulcerative Colitis
Shinichi Tsuchiwata1, Akiyuki Suzuki1, Arnab Mukherjee2
1Pfizer Japan Inc, Tokyo, Japan; 2Pfizer Inc, Groton, CT, USA
Objectives: A Phase 3 study (NCT01458574) demonstrated efficacy of tofacitinib 5 and 10 mg twice daily (BID) for 52 weeks as maintenance therapy in patients with moderate to severe ulcerative colitis (UC) who achieved clinical response following 8 weeks of induction therapy. Longitudinal exposure–response (E-R) characterization of efficacy was performed, with potential factors influencing efficacy evaluated.
Methods: The binary efficacy endpoint of remission (total Mayo score ≤ 2 points, no individual subscore > 1 point, and rectal bleeding subscore of 0), measured at baseline, Week 24, and Week 52, was modeled as a function of predicted average steady state concentration (Cavg) from a population pharmacokinetic analysis. E-R analysis evaluated linear and non-linear (Emax) relationships in a binomial model with Markov dependence, using maximum likelihood methods implemented in SAS v9.2. The Markov model described the probabilities of transition between responder and non-responder status over time. Clinically relevant covariates were evaluated as potential predictors of efficacy.
Results: Markov model transition probabilities for a typical subject of remission at Week 24 among baseline remitters were 0.16, 0.52, and 0.66 for placebo, tofacitinib 5 mg, and 10 mg BID, respectively. Among remitters at Week 24, probabilities of remission at Week 52 were 0.49, 0.65, and 0.70, respectively. Overall probability of remission at Week 52 was higher among baseline remitters compared with baseline non-remitters at both tofacitinib doses. EC50 was 16.2 ng/mL, similar to the geometric mean Cavg at 5 mg BID (16.8 ng/mL), indicating 5 mg BID as the approximate ED50 for remission. Higher baseline Mayo score was associated with lower probability of remission among baseline non-remitters.
Conclusions: A Markov transition model of maintenance remission data as a function of Cavg in UC patients provided adequate description of the observed data, enabling identification of clinically important predictors of efficacy including, baseline Mayo score among baseline non-remitters.
M-015
Sequential Modeling of the Population Pharmacokinetics of Revefenacin and its Major Metabolite in COPD Patients
Arthur Lo1, Marie T Borin1, David L Bourdet1
1Theravance Biopharma US, Inc., South San Francisco, CA, USA
Objectives: Revefenacin (REV) is a novel, once-daily, lung-selective, long-acting muscarinic receptor antagonist in late-stage development for the nebulized treatment of chronic obstructive pulmonary disease (COPD). A sequential population pharmacokinetic (PK) model was developed to describe the plasma PK of REV and its major metabolite (THRX-195518) to identify sources of inter-individual PK variability.
Methods: Data from three phase 2 (dose range: 22–700 µg) and two phase 3 (doses: 88 and 175 µg) studies in patients ranging from moderate to very severe COPD were used in the model. The influences of gender, age, weight, height, body mass index, race, creatinine clearance, liver enzymes, smoking status, and baseline forced expiratory volume in 1 s were tested as potential covariates. A model for REV was developed initially, followed by a model for THRX-195518 using the individual post hoc estimates derived from the final REV covariate model.
Results: The REV PK profile was best described by a 2-compartment model with first-order absorption and elimination from the central compartment. Apparent clearance was 668 L/hr with an apparent volume of distribution of 867 L. The statistically significant covariates were age on apparent clearance and body weight on inter-compartmental clearance of REV. The THRX-195518 PK profile was best described by a 2-compartment model with first-order elimination and with the metabolite formation proportional to the rate of REV clearance. The statistically significant covariates were age on apparent metabolite clearance and body weight on the fraction of REV that was metabolized to THRX-195518.
Conclusions: Although overall exposures were low, REV was rapidly absorbed from the lungs into the systemic circulation with subsequent first order elimination. None of the evaluated covariates demonstrated a clinically meaningful effect on REV or THRX-195518 exposure. No dose adjustments are required based on the efficacy and safety profile established in the REV phase 3 program.
M-016
A PBPK model for predicting drug exposures of lamotrigine in breastfed infants
Ashwin Karanam1, Catherine Sherwin2, Angela Birnbaum1
1Department of Experimental and Clinical Pharmacology, University of Minnesota; 2Department of Pharmacotherapy, College of Pharmacy, University of Utah.
Objectives: Lamotrigine (LTG) is considered a safer antiepileptic drug (AED) to use during pregnancy when compared to older AEDs such as phenytoin. However, little information is available on drug exposure of LTG in breastfeeding infants. We developed a partial-body PBPK model to describe and predict LTG passage into breastmilk and subsequently to infants whose mothers are on chronic LTG therapy.
Methods: A base partial-body PBPK model with four tissues (blood, liver, breast, and small intestine) was developed based on observed concentration–time profiles in nonpregnant women of childbearing age. Due to lack of information on tissue partition coefficients, a sensitivity analysis was performed to approximate these coefficients. As LTG is a Breast Cancer Resistance Protein (BCRP) transporter substrate, partitioning into breastmilk was assumed to be BCRP efflux mediated. This function was added to the non-pregnant model, creating a base post-partum maternal PBPK model. The infant PBPK model was developed by adding an ontogeny function and infant physiology-based changes to the adult non-pregnant model. The final breastfeeding PBPK model was created by linking the post-partum maternal and infant models via breastfeeding. Models were developed and simulated in R using package mrgsolve. Simulations were compared to published infant and mother plasma LTG concentrations [1].
Results: BCRP mediated LTG transfer to breastmilk was best described as a saturable function and infant enzyme maturation pattern by a sigmoid Emax model as a function of post-menstrual age. The prediction fold errors for maternal and infant concentrations were less than one-fold from observed concentrations.
Conclusions: Using a partial-body PBPK model, we estimated infant drug exposure via breastfeeding. Model simulations were in agreement with observed maternal and infant data. This PBPK model will be helpful in identifying exposure risk relationships for infant neurodevelopmental outcomes.
Reference
-
1.
Newport JD. et al. Pediatrics. 2008 Jul; 122(1): e223–e231.
M-017
Population Pharmacokinetics of Pemetrexed in Adult Non-Small Cell Lung Cancer in Indian Patients
Meenakshi Srinivasan1, Ayyappa Chaturvedula1, Michael J. Fossler3, Anand Patil2, Kumar prabhash4, Vikram Gota2
1University of North Texas Health Science Center, Fort Worth, TX, USA 2Advanced Centre for Treatment, Research and Education in Cancer, India 3Trevena Inc, Chesterbrook, PA, USA 4Tata Memorial Hospital, India
Objective: To develop a population pharmacokinetic (PPK) model of Pemetrexed (PEM) and identify factors contributing to variability in exposure in Indian patients.
Methods: PPK analysis was performed using plasma samples from 85 patients following 500 mg/m2 IV infusion using NONMEM® (v.7.3.0) with ADVAN3 TRANS4 subroutine. The stochastic approximation expectation maximization (SAEM) method was used to estimate parameters. Standard errors and objective function value were calculated using Monte Carlo importance sampling (IMP). Full covariate model (FCM) approach was utilized by specifying clinically meaningful covariates a priori. Power model was used to describe covariate-parameter relationships. Credible intervals (95% CI) obtained using Markov chain Monte Carlo Bayesian analysis (BAYES) were used to reduce the FCM by eliminating the covariates whose CI included the null. Model qualification was performed using Visual Predictive Check (VPC) and bootstrap.
Results: A total of 850 PEM concentrations were used for model development. Population parameter estimates are provided in Table 1. Pharmacokinetic parameters agreed well with previous reports except lower V1 was observed in our study. A large between subject variability (50–108% CV) was observed in pharmacokinetic parameters. The final model included V1, V2 and Q scaled to body surface area (BSA) raised to a fixed exponent of 1. Creatinine clearance and sex on CL and albumin on V1 were statistically significant covariates based on Bayesian CI. However, traditional bootstrap resulted in 95% confidence interval of gender effect parameter including null. Given the size and non-significant gender effect in traditional bootstrap, it is considered clinically not significant. Diagnostic plots showed no major bias in the model.
Conclusion: Lowering CRCL to 75 and 45 mL/min from 100 mL/min caused a 13 and 32% decrease in CL, respectively. Decrease in ALB by 1 g/dL from 3.6 g/dL increased V1 by 55%. The covariate effects identified could be used to individualize dosing.
Table 1 Population pharmacokinetic model parameters of Pemetrexed from Full Covariate Model
Parameter | SAEM-IMP estimate (RSE) | BAYES median (95% credible interval) | Bootstrap median (95% confidence interval) |
|---|---|---|---|
θ CL (L/h) | 3.28 (10.81) | 3.26 (2.85–3.69) | 3.27 (2.58–4.04) |
θ CRCL on CL | 0.5 (39.32) | 0.5 (0.11–0.87) | 0.47 (0.02–0.9) |
θ SEX on CL | 1.21 (12.39) | 1.21 (1.03–1.41) | 1.21 (0.95–1.54) |
θ V1 (L) | 5.17 (7.84) | 5.22 (4.72–5.77) | 5.19 (3.86–6.36) |
θ ALB on V1 | −1.35 (21.32) | −1.34 (−1.89 to −0.81) | −1.27 (−2.1 to −0.39) |
θ V1 (L) | 5.92 (14.54) | 5.97 (4.75–7.39) | 6.01 (4.19–14.2) |
θ Q (L/h) | 6.78 (14.28) | 6.64 (5.25–8.16) | 6.74 (3.6–12.39) |
ω 2CL (%CV) | 51.87 (20.03) | 53.56 (45.81–63.51) | 51.25 (40.3–62.51) |
COV CL–V1 (%CV) | 34.81 (42.04) | 34.7 (22.21–45.86) | 33.92 (−20.36–60.17) |
ω 2V1 (%CV) | 50.43 (23.55) | 52.01 (43.49–62.73) | 51.22 (36.31–86.78) |
COV V1–V2 (%CV) | 55.07 (31.47) | 55.34 (37.5–72.25) | 53.58 (28.36–75.13) |
ω 2V2 (%CV) | 107.8 (33.16) | 116.11 (89.51–148.43) | 104.81 (41.5–162.81) |
ω 2Q (%CV) | 80.42 (55.45) | 79.86 (50.21–116.8) | 86.53 (35.62–132.19) |
σ 2PROP (%CV) | 28.43 (15.12) | 28.44 (26.39–30.63) | 28.49 (23.91–32.94) |
σ 2ADD (mcg/mL) | 0.82 (49.72) | 0.79 (0.52–1.11) | 0.81 (0.21–1.75) |
M-018
Rifampin dose optimization in children with tuberculous meningitis using dynamic PET imaging data.
Beatriz Guglieri-Lopez1, Elizabeth W. Tucker2,3,4,5 Alvaro A. Ordonez2,3,6, Joga Gobburu1, Sanjay K. Jain2,3,6,7, Vijay Ivaturi1
1Center for Translational Medicine, University of Maryland School of Pharmacy, Baltimore, MD, USA; 2Center for Infection and Inflammation Imaging Research, Johns Hopkins University School of Medicine, Baltimore, MD, USA; 3Center for Tuberculosis Research, Johns Hopkins University School of Medicine, Baltimore, MD, USA; 4Department of Anesthesiology and Critical Care Medicine, Johns Hopkins University School of Medicine, Baltimore, MD, USA; 5Division of Pediatric Critical Care, Johns Hopkins All Children’s Hospital, St. Petersburg, FL, USA; 6Department of Pediatrics, Johns Hopkins University School of Medicine, Baltimore, MD, USA; 7Division of Nuclear Medicine and Molecular Imaging, Russell H. Morgan Department of Radiology and Radiological Science, Johns Hopkins University School of Medicine, Baltimore, MD, USA
Objectives: Tuberculous meningitis (TBM) is the most devastating form of tuberculosis (TB). Key TB antimicrobials have restricted brain penetration. The objective of this analysis was to optimize rifampin dosing in children with TBM to achieve brain exposures above the target for M. tuberculosis.
Methods: A micro-dose (ng) of 11C-rifampin was injected to New Zealand white rabbits (n = 12) and dynamic PET imaging was performed. After imaging, a 30 mg/kg dose of unlabeled rifampin was administered and blood samples were analyzed using mass-spectrometry. A published pharmacokinetic model for rifampin after oral administration in humans (1) was scaled down and used to describe the pharmacokinetics of both rifampin and 11C-rifampin in plasma in rabbits. Then, the pharmacokinetic model was expanded to describe the brain distribution of 11C-rifampin. This pharmacokinetic-brain-biodistribution model was used to perform Monte Carlo simulations of different doses in children in order to predict rifampin exposure in brain. Probability of target attainment curves were generated. The target value for rifampin was assumed to be Cmax > 4 times the minimum inhibitory concentration (MIC) (MIC = 1 μg/mL).
Results: The developed pharmacokinetic-brain-biodistribution model described the distribution of 11C-rifampin into brain, including a decrease in penetration over time. This decrease, which may represent a return to homeostasis due to decreased infection and improved blood brain barrier integrity, had an estimated half-life of approximately 3 weeks. In children, only an oral dose of ≥ 30 mg/kg would achieve the target exposure in the brain lesions at the initiation of treatment and sustained Cmax > 1 μg/mL during the first 6 weeks of TBM treatment.
Conclusion: Our integrated pharmacokinetic-brain-biodistribution model predicts that rifampin doses ≥ 30 mg/kg are required to achieve adequate concentrations in brain lesions in children.
References
-
1.
W. Smythe, A. et al., A semimechanistic pharmacokinetic-enzyme turnover model for rifampin autoinduction in adult tuberculosis patients. Antimicrobial agents and chemotherapy 56, 2091–2098. 2012.
M-019
Comparing PK-PD and K-PD approaches to inform dose selection of GSK2256294, a potent and selective soluble Epoxide Hydrolase Inhibitor
Bhargava Kandala1, Aili L. Lazaar2, Navin S Goyal2
1Merck & Co., Inc; 2GlaxoSmithKline
Objectives: To inform dose selection (and probability of success) in a First-Time-In-Human (FTIH) healthy volunteer clinical study with GSK2256294, a potent and selective soluble epoxide hydrolase (sEH) inhibitor.
Method: Single escalating doses of GSK2256294 (2–12 mg or placebo) were administered in a randomized, crossover study design to 12 healthy male subjects. GSK2256294 exposures were measured in human plasma, and sEH activity was assessed in whole blood samples [1]. Population pharmacokinetic-pharmacodynamic (PK-PD) and K-PD models were developed (NONMEM VII) to characterize sEH inhibition by GSK2256294. Standard graphical and model diagnostic criteria were applied to assess model performance. Clinical trial simulations were carried to select doses with a high probability of achieving a target the sEH inhibition 24 h post-dose at steady state in a majority of the study population.
Results: A PK-PD model comprised of a two-compartment PK model, and an indirect response model (inhibition of the production of sEH enzyme activity) was found to adequately describe the exposure and enzyme inhibition data. The K-PD model provided comparable parameter estimates albeit with better characterization of the inter-individual variability. Based on simulations with the PK-PD and K-PD models, a 6 mg dose provided high probability of success in achieving > 90% enzyme inhibition in > 90% of the patients at steady state. The clinical data from the 6 mg repeat dose cohort confirmed the model predictions.
Conclusion: A K-PD model was more precise compared to the PK-PD approach in adequately characterizing the observed clinical data and specifically the associated variability. Application of similar modeling techniques may be necessary based on the clinical question encountered by the study team. Model based approaches provide a high probability of success for dose selection with the desired level of target engagement.
Funding: GlaxoSmithKline [NCT01762774].
Reference
-
1.
A.L. Lazaar et al. Br J Clin Pharmacology 2016. 81:5; 971–979.
M-020
A product-profile-driven clinical utility index (CUI) analysis to balance benefits and risks for dose selection in oncology
Bill Poland (1), Russ Wada (1), Qi Liu (2), Luna Musib (2), Daniel Maslyar (2), Eunpi Cho (2), Wei Yu (2), Han Ma (2), Jin Yan Jin (2), Nageshwar Budha (2), Rui Zhu (2)
(1) Certara, Menlo Park, CA, USA; (2) Genentech, Inc., South San Francisco, CA, USA.
Objectives: (1) characterize exposure-efficacy and exposure-safety relationships for ipatasertib in combination with abiraterone in patients with metastatic castration-resistant prostate cancer; (2) trade off benefits and risks vs. dose to support phase III dose selection; (3) compare this CUI implementation to others recently used in oncology.
Methods: A phase Ib/II trial (n = 253 randomized) compared placebo and two ipatasertib doses [1]. A proportional-hazards model characterized exposure-efficacy (radiographic progression-free survival hazard ratio), and logistic regression models characterized exposure-diarrhea and exposure-rash in terms of probability of grade ≥ 3 events, with lognormal uncertainty. CUI analysis (multi-criteria decision analysis) put these onto the same scale and combined them. Pre-defined minimal, target, and optimistic product profiles (PPs) determined utility scales for each endpoint. The safety endpoints were weighted 40% (30% diarrhea + 10% rash) in the CUI function. Sensitivity analyses varied these weights and the adverse event grade threshold.
Results: Efficacy showed a modest trend toward improvement at higher exposures; safety endpoints showed consistent worsening over the exposure range. CUI results with sensitivity analysis supported a 400 mg daily phase III dose, with the highest expected utility and probability of reaching minimal and target PPs compared to other doses evaluated (Figure 1).
Conclusions: In CUI analysis, pre-defined PPs help to define the utility function for each attribute. Other recent benefit-risk assessments in oncology are simpler with only two attributes (efficacy vs. safety in multiple myeloma [2]) or less generalizable scaling (all scales converted to adjusted survival time in multiple myeloma [3] and NSCLC [4]).

Fig. 1 CUI distribution (A) and probabilities of reaching PPs (B) vs. dose
Encore: Part of this abstract was presented at PAGE May 29–June 1, 2018.
References
-
1.
de Bono, JSD et al. JCO. 34, Abstract 5017 (2016).
-
2.
Freise KJ et al. CPT. 102, 970–976 (2017).
-
3.
Raju GK et al. CPT. 103, 67–76 (2018).
-
4.
Raju GK et al. CPT. 100, 672–684 (2016).
M-021
Bridging the Gap of Macrolide Resistance Mechanisms and Clinical Application through PK/PD Modeling and Pharmacovigilance Analyses
Brian Cicali, Adam J. Collin, Arturo Vega, Stefanie Raghunandan, Stephan Schmidt
Center of Pharmacometrics and Systems Pharmacology, Department of Pharmaceutics, University of Florida, Orlando, FL, USA.
Objectives: Macrolide antibiotics are a widely prescribed class of antibiotics, but are associated with significant bacterial resistance development. The emphasis for studying the cause of resistance has been on pharmacodynamics (PD), while the contribution of pharmacokinetics (PK) to the emergence of resistance is much less appreciated. Azithromycin is a macrolide antibiotic that accumulates extensively in tissues, resulting in a long half-life (t1/2: ~ 68 h). The objective of this study was to determine if a causal link between the slow clearance of Azithromycin and the emergence of resistance exists as compared to a second macrolide, erythromycin (t1/2: ~ 1.6 h).
Methods: Minimum inhibitory concentrations (MIC) of erythromycin and azithromycin were curated from the EUCAST database for three clinically relevant bacterial strains: S. aureus, S. pneumoniae, H. influenzae. Time course of exposure relative to MIC breakpoints was explored via mechanism-based PK/PD modeling to characterize the impact of subtherapeutic exposure during and after treatment on resistance development considering known resistance mechanisms. To verify these findings, FDA’s Adverse Event Reporting System (FAERS) was used to compare bacterial resistance emergence signals for erythromycin and azithromycin using pharmacovigilance analyses via proportional reporting ratios (PRR).
Results: MIC90 thresholds varied between 0.016–0.125 mg/L for azithromycin and .008–0.250 mg/L for erythromycin for fully susceptible organisms. For both drugs, MIC thresholds significantly increased in resistant isolates (efflux pumps: 4–32 mg/L; methylation mutations: 128–256 mg/L). While resistance against both macrolides exists, it seems to be more pronounced against azithromycin (PRR: 10.4 [95% CI: 8.9–12.3]) compared to erythromycin (PRR: 6.6 [95% CI: 3.9–11.5]).
Conclusions: Our integrated PK/PD and pharmacovigilance analysis suggests that the prolonged subtherapeutic exposure of azithromycin upon treatment termination may significantly contribute to the emergence of bacterial resistance. Combination therapy may be required to ensure sufficient antimicrobial activity during azithromycin’s long elimination period.
M-022
Physiologically-based pharmacokinetic modeling of ziprasidone in pregnant women
Carla Biesdorf1, Frederico Martins2, Andrea Diniz1
1Department of Pharmacy, State University of Maringá, Maringá, Brazil; 2Simcyp Limited (a Certara company), Sheffield, UK.
Objectives: Pregnancy is associated with physiological changes that alter the pharmacokinetics (PK) of drugs. We used a pregnancy physiologically based pharmacokinetic (p-PBPK) model to predict the PK of ziprasidone in pregnant women and evaluated the necessity of dose adjustment in this special population.
Methods: A full PBPK model of ziprasidone was developed using Simcyp® virtual populations of healthy adult volunteers. The performance of simulations was assessed by the mean fold error (MFE) of PK parameters (area under the plasma (AUC) concentration–time curve, peak plasma concentration (Cmax) and time to maximum concentration (Tmax)) extracted from Simcyp®. Model was accepted if all predicted PK parameters were within two-fold of the observed values. Simulations for pediatric and geriatric population were assumed to validated the built model and this was extended to the pregnant state using the p-PBPK Simcyp® software package to assess PK profile of ziprasidone throughout pregnancy.
Results: PBPK model successfully predicted the ziprasidone disposition in healthy adult volunteers (AUC MFEs ranged 0.94–1.04; Cmax MFEs ranged 0.89–1.31; Tmax MFEs ranged 0.80–1.03). Pediatric and geriatric population, also showed predicted AUC, CMax and Tmax within a two-fold range of observed values. The simulated exposure in pregnant women using p-PBPK model showed no significant difference when compared to non-pregnant women.
Conclusions: The p-PBPK model predicted the impact of physiological changes during pregnancy on PK and exposure of ziprasidone, showing that dose adjustment is not necessary in this special population.
References
Abduljalil K, et al. Anatomical, physiological and metabolic changes with gestational age during normal pregnancy: a database for parameters required in physiologically based pharmacokinetic modelling. Clin Pharmacokinet 2012; 51: 365–96.
Gaohua, L., et al. A pregnancy physiologically based pharmacokinetic (p‐PBPK) model for disposition of drugs metabolized by CYP1A2, CYP2D6 and CYP3A4. British Journal of Clinical Pharmacology 2012; 74: 873–885.
M-023
In vitro screening of drug combinations against Mycobacterium tuberculosis
Carolina De Miranda Silva,1 Amirhossein Hajihosseini,1 Jenny Myrick,2 Jocelyn Nole,2 Arnold Louie,2 Stephan Schmidt,1George L. Drusano2
1Center for Pharmacometrics & Systems Pharmacology, Department of Pharmaceutics, College of Pharmacy, University of Florida; 2Institute for Therapeutic Innovation, College of Medicine, University of Florida, Orlando, Florida, United States of America
Objectives: Tuberculosis is a major infectious disease cause of death worldwide, with treatment success rates of 30% for extensively resistant Mycobacterium tuberculosis (Mtb) strains. Conversion to resistant strains is related to treatment duration and patient adherence. Combination therapy is a promising strategy to tackle both issues as it could maximize Mtb killing and improve patient adherence by shortening the duration of therapy[1]. However, the selection of the most favorable combination within the available drugs is a challenging task. Therefore, our objective was to identify 2-drug combinations with additive or synergistic activity towards in vitro bacterial killing of Mtb in Log-, Acid, and nonreplicating persister (NRP)-Phases.
Methods: Mtb strain H37Rv in Log- and Acid-Phase growth and Mtb strain 18b in NRP-Phase growth were incubated in 9 × 8 microdilution plates containing varying combinations of linezolid (LZD)/bedaquiline, (BDQ) or moxifloxacin (MOXI)/pretomanid (PA824). Data on quantitative culture counts were modeled in ADAPT 5 and the Greco Universal Response Surface Approach (URSA) was used to characterize drug combinations as additive, synergistic, and antagonistic [2].
Results: Prediction vs Observation plots (r2 > 0.771) showed the URSA was able to describe data in all tested strains and metabolic phases. Our model results indicated a tendency for synergy for MOXI/PA824 bacterial killing towards H37Rv in Log- and Acid-Phases. Additivity was observed for NRP-phase under MOXI/PA824 and for LZD/BDQ in all of the tested strains and metabolic phases.
Conclusions: The strategy was suitable to identify MOXI/PA824 and LZD/BDQ as promising combinations for the treatment of tuberculosis to be further tested in in vitro hollow fiber infection model and in animal models.
References
-
1.
Drusano GL et al. PLoS One 9:e101311., 2014.
-
2.
Greco WR et al. Pharmacol Rev 47: 331–385, 1995.
M-024
How do body composition differences affect gentamicin therapy in pediatric patients?
Carolina Llanos-Paez1, Christine Staatz1, Stefanie Hennig1
The University of Queensland, School of Pharmacy, Brisbane, QLD, Australia.
Objectives: To investigate how reported differences in body composition1 between pediatric oncology and non-oncology patients potentially affect gentamicin pharmacokinetics (PK).
Methods: Data from pediatric patients given gentamicin over 5 years was available. FREM approach2 was used to investigate the influence of being an oncology patient on gentamicin PK, using a previously published model3. The effect of normal fat mass (NFM)4 on all parameters was examined using a mechanistic-based approach. Simulations were performed to explore target attainment (peak concentrations, overall exposure and bacterial killing5).
Results: Data from 423 oncology and 115 non-oncology patients were combined for analysis. FREM results showed differences in drug distribution for oncology patients, with a significant effect on V1 (mean effect: 25.7%). Further development of the mechanistic model by addition of NFM on all structural parameters (∆OFV = −12.9), and inclusion of different V1 and Q estimates for oncology patients (∆OFV = −72.6) improved model fit. Final parameter estimates (between-subject variability %) were a CL (L/h/70 kg of body weight) of 4.58 (16.5%); V1 (L/70 kg of body weight) of 18.1 (23.8%) for oncology and 21.4 (26.0%) for non-oncology patients; Q (L/h/70 kg of body weight) of 0.57 (29.4%) in oncology and 0.84 (59.7%) in non-oncology patients; and V2 (L/70 kg of body weight) of 18.2 (67.6%). Simulations demonstrated low target attainment at the recommended starting dose of 7.5 mg/kg, with 47.6% of oncology and 21.0% of non-oncology patients achieving a Cmax ≥ 25 mg/L and AUC24 ≥ 70 mg*h/L after the first dose.
Conclusions: Differences in gentamicin V1 and Q was observed between the two populations. A gentamicin starting dose > 7.5 mg/kg may be needed in pediatrics for optimal bacterial killing, with non-oncology patients potentially needing a higher dose.
References
-
1.
Murphy et al. Am J Clin Nutr 2010;92(1):55–60.
-
2.
Karlsson et al. In: PAGE; 2012.
-
3.
Llanos-Paez et al. AAC 2017;61(8).
-
4.
Anderson et al. Annu Rev Pharmacol Toxicol 2008;48:303–32.
-
5.
Mohamed et al. AAC 2012;56(1):179–88.
M-025
Human Systemic Exposure Prediction of GSK2981278 following topical administration using Ex Vivo Human Skin Penetration and Allometric Based Scaling for Dose Determination
Chakradhar V Lagishetty1*, Leandro L Santos2, Julie Speitel3, Catherine Booth-Genthe3, Rajendra Singh1
1Clinical Pharmacology Modeling Simulation, GlaxoSmithKline, Upper Providence, PA; 2Biopharm Analytical Sciences, GlaxoSmithKline, Upper Providence, PA; 3In vitro/In vivo translation, Translation Platform Projects Specialist, GlaxoSmithKline, Upper Merion, King of Prussia PA.
Objectives: GSK2981278 is a ROR-gamma inverse agonist investigated in a Phase 1/2a study for topical treatment of psoriasis. We sought to prospectively predict human systemic exposure of GSK2981278 in the Phase 1/2a study (NCT03004846) using ex vivo human skin penetration and human PK parameters from allometric scaling of preclinical PK parameters to inform dose of a topical ointment, and to compare projections with the clinical data.
Methods: Skin penetration was assessed using flow-through diffusion cells and ex vivo healthy human skin. Flux (ng/h/cm2) was determined from skin penetration study data and modelled against doses (Flux = E0 + Emax*Dose/ED50 + Dose). Human CL and Vd were allometrically predicted from preclinical PK parameters. Assuming skin absorption at a constant rate/flux, steady state Cmax and AUC24 in humans were calculated for b.i.d applications of 4% strength to 5–15% of total BSA. Human safety-fold margins were calculated to established NOAELs from 13-week studies in rats (oral) and minipigs (dermal) to inform human dose. Projections were compared with the clinical PK data in psoriatic patients.
Results: The Emax model for flux provided estimates (mean; SE) of E0 (−3.708; 3.806), Emax (56.028; 5.712) and ED50 (0.564; 0.298). Predicted human CL and Vd were 52.5 L/h and 175.9 L, respectively. Projections were well below NOAEL limits (a minimum of 5-fold for AUC and 21-fold for Cmax) for the planned clinical use. These conservative projections were in agreement with clinical data from patients with psoriasis (Figure).

Figure Individual GSK2981278 plasma concentration–time curves following application of 4% w/w ointment with 7–14% BSA on Days 1 (panel a), 15 (b), 29 (c), and 57 (d). Pink horizontal lines represent predicted lower and upper steady state Cmax (Color figure online).
Conclusions: Systemic exposure predictions of GSK2981278 using skin penetration in conjunction with predicted PK parameters projected topical dose, align with clinical PK supporting conservative prospective use of this approach.
M-026
Use of Pharmacokinetics-Pharmacodynamics Modeling and Simulation to Support Early Phase Dose Selection for PF-06741086, an anti-TFPI Monoclonal Antibody
Chay Ngee Lim1, Tong Zhu1, Pinky Dua2
1Pfizer Inc., Cambridge, MA, USA; 2Pfizer Inc., Cambridge, UK
Objectives: Tissue factor pathway inhibitor (TFPI) is a protease inhibitor of tissue factor-activated coagulation factor VII (FVIIa) and activated factor X (FXa). PF-06741086 is a monoclonal antibody that targets TFPI with the intent to reduce inhibition of the extrinsic coagulation pathway and increase clotting activity in bleeding disorders such as hemophilia. The objective was to develop population pharmacokinetic-pharmacodynamic (PKPD) models for PF-06741086 with data from healthy subjects and use these to support internal decision making and dose selection for the Phase 1b/2 study. PD biomarkers of interest included ex vivo coagulation endpoints such as diluted prothrombin (dPT), peak thrombin generation (PKT) and in vivo biomarker prothrombin fragment 1 + 2 (PF1 + 2).
Methods: Nonlinear mixed effects modeling approach was taken to describe PF-06741086 PK, total TFPI and coagulation biomarkers data from a randomized, placebo-controlled Phase 1 single ascending dose study. Various models were explored for PK and total TFPI (including quasi-steady-state approximation of a target mediated drug disposition model, parallel linear and Michaelis–Menten elimination) and PKPD (direct Emax, indirect response). Modeling and simulations were performed using NONMEM.
Results: Data following intravenous (150 to 440 mg) and subcutaneous (30 to 300 mg) administration of PF-06741086 in healthy subjects was included in the analysis. PF-06741086 PK was adequately characterized by a two-compartment model with first-order absorption and parallel linear and Michaelis–Menten elimination from the central compartment. PK-dPT and PK-PKT relationships were described with direct effect Emax model, and PK-PF1 + 2 relationship by indirect response model with stimulatory effect on PF1 + 2 input. Based on simulations utilizing the PKPD models, a certain dosing regimen was predicted to produce robust changes in the biomarkers, with projected steady-state trough concentrations above the estimated EC90 for all the biomarkers.
Conclusions: Modeling and simulations was used to facilitate dose selection for the Phase 1b/2 study using Phase 1 data.
M-027
Prospective Application and Validation of a Systems Pharmacology Model to Guide the Clinical Development of PF-05251749: A Casein Kinase 1 (CK1) inhibitor
Francois Gaudreault1, Arthur Simen2, Eve Pickering3, Dmitri Volfson3, Travis Wager3, Jaekyoung Kim4, Kyoung-Ae Kim5, Taeshin Park5, John Tolsma5, Cheng Chang3
1Biogen Inc., Cambridge, MA, USA; 2Takeda Inc., Cambridge, MA, USA; 3Pfizer Inc., Cambridge, MA USA; 4Korean Institute of Advanced Technology, Daejeon, South Korea; 5RES Group Inc., Needham, MA, USA.
Objectives: PF-05251749 is a small molecule, selective CK1 inhibitor currently in development for the treatment of circadian related disorders. A systems pharmacology model was developed to account for the oscillating target concentration and interference by light on the effect of PF-05251749 on circadian rhythm. The model was prospectively applied to guide the design of a proof of mechanism (POM) study.
Methods: Simulations from the systems pharmacology model [1] were used to inform on the dose, time of dosing, time of pharmacodynamic endpoint measurement, and duration of dosing for the POM study. This was a Phase 1, double blind, placebo and active comparator controlled (Melatonin 0.5 mg) multiple ascending doses safety study in 97 healthy subjects dosed either in the morning (AM) or evening (PM) for 14 consecutive days (NCT02691702). Salivary melatonin concentrations and leukocyte clock gene mRNA levels were measured and fitted by mixed-effect modeling to estimate the treatment effect, which was subsequently used to evaluate the systems model prediction performance.
Results: A statistically significant and dose-related increase in circadian phase modulation was observed for both AM and PM dosing times based on both endpoints. Consistent with the systems model projections, PF-05251749 produced larger phase delays in the evening (based on mRNA), where the maximal phase delay [95% CI] was estimated to be 19.9 [15.4, 23.8] hours (vs 9.2 [4.4, 12] hours in the morning). AM and PM dosing effect was not differentiated based on the salivary melatonin levels due to limited dynamic range.
Conclusions: The systems pharmacology model prospectively and accurately predicted the clinical responses upon inhibiting CK1 with PF-05251749. This model bridged the translation gap from nonclinical to human and played an essential role in the design of an efficient and informative clinical study.
Reference
CPT Pharmacometrics Syst Pharmacol. 2013 Jul 17
M-028
Revisiting Contribution of Convection and Diffusion to Antibody Transport from Tumor Vasculature to Interstitium
Chia-Hung Tsai, Craig Giragossian, Steven Hansel
Boehringer Ingelheim Pharmaceuticals Inc., Ridgefield, CT, USA.
Objectives: Mathematical models, including physiologically-based pharmacokinetic (PBPK) models and semi-mechanistic models, have been widely used for quantitatively describing antibody PK across species. As tumor microenvironment is generally thought to deviate from normal physiology, antibody transport between vasculature and interstitium in a solid tumor is expected to behave differently compared to that in other organs. Different assumptions are made in models describing the antibody transport process, and they are reflected in the structure of equations that account for: (1) both convection and diffusion, (2) only convection, or (3) only diffusion. This work aims to evaluate theoretically the contribution of convection and diffusion to antibody transport in the tumor of xenograft mice.
Methods: A model having a two-compartment linear PK component and a tumor compartment is developed for a non-specific antibody. The case with only convection as the transport mechanism is studied first. Diffusion is later added to the model, and the concentration profiles are examined. Parameter values for convection and diffusion are either fixed according to published models or adjusted to fit literature data generated using radiolabeled non-specific antibodies. The Patlak equation is revisited to yield insight into the process of solute transport through a porous structure such as the endothelial lining in a tumor.
Results: With the addition of the diffusion component to antibody transport between tumor vasculature and tumor interstitium, peak antibody interstitial concentration is increased by at least 2-fold compared to the model with solely convection. Antibody transport rate through diffusion is shown to be slightly higher than through convection.
Conclusions: With commonly used physiological parameter values for antibody transport in a tumor, it is shown that convection and diffusion are comparable driving forces. Hence, a mathematical model intended for describing antibody transport between tumor vasculature and interstitium should include both mechanisms.
M-029
Investigation of Maximum Likelihood and Bayesian techniques to inform probability of success using model-based analysis
Chiara Zecchin1, Richard Dimelow1, Stefano Zamuner1
1GlaxoSmithKline, Stevenage, UK.
Objectives: Modelling and simulation is central to understanding PKPD and optimizing clinical study design. In this analysis, we investigate maximum-likelihood (ML) and Bayesian methods for modelling Phase 1 data and simulating probability-of-success (POS) of future studies.
Methods: A PKPD model describing drug and target plasma concentration was fitted to Phase 1 data from a single ascending dose study [1] with reach PK and target sampling, using ML (IMP and SAEM) and BAYES estimation methods in NONMEM7.3 [2]. The in vitro drug-target dissociation constant (KD) was used as prior for BAYES.
Target engagement (TE) with repeat dosing and different sample sizes was simulated using 1) parameters sampled about their ML with multivariate-normal covariance (IMP and SAEM); 2) parameters sampled by BAYES during its stationary distribution phase. Success was defined as %TEtrough > 90% at steady-state in 90% of subjects.
Results: A one compartment model with target-mediated drug disposition and quasi-steady-state [3] approximation described well the data. Model estimated KD (~ 0.56 nM) was different from the in vitro measurement (0.038 nM). BAYES was robust to misspecification of prior KD information. Differences between parameters simulated using ML and BAYES were visible. Figure 1 shows the distribution of simulated %TEtrough. POS based on sample size of 20 was 80% with BAYES, 53% with ML methods.

Conclusions: Unlike ML based approaches, parameters sampled by BAYES are not necessarily centred on their ML estimates and may be more reliable representation of the data. Bayesian estimation techniques might simulate more realistic trials to better inform decision making in drug development.
References
-
1.
Zecchin C, et al. Quantitative modelling to assess target engagement and pharmacology in early clinical development of an anti-OSM humanised mAb. PAGE26 (2017).
-
2.
Beal SL, et al. NONMEM7.3.0 Users Guides (1989–2013).
-
3.
Gibiansky L, et al. Approximations of the target-mediated drug disposition model and identifiability of model parameters. JPKPD 35.5 (2008).
M-030
Predicting Torsades de Pointes (TdP) Risk from Ion Channel Inhibition Using Machine Learning and Myocyte Models
Christopher Keefer1, Eric Watt1, Zhenhong Li2, Stephen Jenkinson3, Tristan Maurer2
1Pfizer, Inc., Groton, CT, USA; 2Pfizer Inc., Cambridge, MA, USA; 3Pfizer Inc., La Jolla, CA, USA.
Objectives: The accurate prediction of TdP risk has been an ongoing challenge in drug discovery. Recent efforts have explored a mechanistic approach utilizing human myocyte models of action potential and Ca2+ concentration profiles combined with machine learning.1 This technique was investigated using Random Forests and the results of models using waveform parameters, ion channel inhibition profiles alone, and physical properties descriptors were compared.
Methods: A set of 86 drug compounds with annotated TdP risk and ion channel inhibition measurements for hERG, Cav1.2, and Nav1.5 were obtained.1 For each compound, three myocyte models were run at three pulsing rates for three different cell types (epi, mid, and endo), with the models modified for the experimental ion channel inhibition values. Parameters were extracted from the voltage and Ca2+ waveforms which were then used as features to train a Random Forest model to predict TdP. Models were also built using subsets of myocyte models and subsets of waveform parameters, ion channel blocks, and/or physical property descriptors.
Results: The approach using all the waveform parameters is highly predictive (auROC 0.95, accuracy 88%). Using waveforms from just one model (O’Hara, epithelial, 1 Hz) is equally predictive (auROC 0.96, accuracy 87%), suggesting a single myocyte model may be sufficient. A model built using the ion channel blocks alone performed favorably to the waveform models (auROC 0.93, accuracy 89.5%). Exploration of this model shows the interaction between hERG and Cav1.2, illustrating the mitigation ability of concurrent calcium with hERG inhibition risk.
Conclusions: This combination of systems modeling and machine learning is a promising approach to predict TdP and provide insight into which parameters are most influential, providing a pathway to better understand the biology and allow a more nuanced risk assessment of new chemical entities.

Out-of-bag estimates of TdP risk contribution vs. proportion of ion channel block for 86 compounds
Reference
-
1.
MC Lancaster & EA Sobie. Clin. Pharmacol. Ther. 100, 371–379 (2016).
M-031
Development of a Quantitative Systems Pharmacology (QSP) Model, the Respiratory PhysioPD™ Platform, to Investigate Biological Mechanisms Underlying Bronchoconstriction
Christina Friedrich1, Ben Weber2, Meghan Pryor1, Colleen Witt1, Jens Borghardt2, Bernd Disse2, Claudia Dallinger3, Abhya Gupta2, Dave Singh, Birgit Jung2, Andy Fowler2
1Rosa and Co, LLC 2Boehringer Ingelheim 3Boehringer Ingelheim Pharma GmbH & Co. KG, Biberach, Germany
Objectives: Bronchoconstriction can be a significant component of airway diseases and a particular safety concern as an adverse drug reaction for patients with respiratory diseases. A quantitative mechanistic understanding of the biology, extent and duration of bronchoconstriction could help identify this issue prospectively and guide rational drug development.
Methods: A mechanistic QSP model of bronchoconstriction, the Respiratory PhysioPD Platform, was developed to elucidate mechanisms of bronchoconstriction and aide in interpretation of methacholine (MCh) challenge results.
Results: The team identified the key mechanisms contributing to bronchoconstriction, including a cascade of events in the neuromuscular junction (NMJ) consisting of neurons and airway smooth muscle (ASM) as follows:
-
MCh or acetylcholine (ACh) bind to muscarinic receptors (M2, M3) on ASM
-
Action potentials are triggered via the autonomic reflex arc, causing release of endogenous ACh into the NMJ
-
Binding of ACh to M2 receptors on the efferent neurons results in down-regulation of ACh release and attenuation of bronchoconstriction
-
Clearance of ACh and MCh by esterases also plays a role in attenuating bronchoconstriction
Platform development supported scientific hypotheses including:
-
Exogenous MCh is rapidly cleared but sets off a cascade of events leading to bronchoconstriction
-
Endogenous ACh is the agonist that engages ASM muscarinic receptors to sustain bronchoconstriction
-
In airway disease, inflammation increases ASM and neuronal excitability and impairs signal relay filters and M2 neuronal receptor function, thus both increasing the likelihood of a bronchoconstriction event and decreasing the ability to attenuate the response
-
Increased mucus and esterase inhibition can also worsen bronchoconstriction
Modeled virtual healthy and asthmatic persons provided FEV1 responses similar to clinical observation and supported these insights.
Conclusions: The Platform enables quantitative evaluation of bronchoconstriction pathways and the impact of interventions that interact with pulmonary muscarinic biology. Bronchoconstriction responses to MCh challenge protocols and novel drug-intervention protocols may thus be better predicted to de-risk respiratory drug development.
M-032
A Tumor Growth Inhibition (TGI) Model for Long-term Tumor Measurements in ALK-Positive NSCLC Patients on Crizotinib Therapy
Ronilda D’Cunha1, Luke Fostvedt2, Weiwei Tan2, Dana Nickens2
1College of Pharmacy, University of Iowa, Iowa City, IA, USA; 2Pfizer Oncology, La Jolla, CA, USA
Objectives: Crizotinib (Xalkori®), a selective small-molecule inhibitor of Anaplastic Lymphoma Kinase (ALK) and ROS1, is approved for treatment of non-small-cell-lung cancer (NSCLC) in ALK- and ROS1-positive patients. TGI models for longitudinal tumor measurements and clinical data were developed in crizotinib-treated patients with ALK-positive NSCLC.
Methods: Tumor data and progression-free survival (PFS) for crizotinib came from the PROFILE-1005 study. Two TGI models were developed using: (1) sum-of-longest diameter of target lesions (SLD) and (2) individual target lesions ordered by baseline size within patient, modeled simultaneously. Specific TGI approaches [1–3] were modified to develop Model 2. Population analysis used non-linear mixed-effects modelling. Final model selection used stepwise-covariate modeling. Tumor model metrics from final models were used to evaluate the relationship with PFS.
Results: Out of a total of 1065 patients, 753 patients were evaluable for TGI modeling analysis with a baseline tumor measurement and ≥ 1 measurement post-baseline, with a maximum of 5 target lesions/patient. Linear tumor growth models based on Wang3 best described long-term tumor dynamics for both Models 1 and 2. Population estimates for tumor dynamics were similar in both models. In Model 2, the tumor shrinkage rate was highest in the largest target lesion and progressively lower for smaller lesions. Tumor model metrics showed greater tumor shrinkage is associated with longer PFS.
Conclusions: TGI models with linear tumor growth best describe longitudinal tumor changes for both models. Model 1 has a single metric for tumor changes and is simpler to interpret. Model 2 is more informative about individual target lesion dynamics. Tumor metrics from these models can be used to describe PFS in NSCLC patients receiving crizotinib.
References
-
1.
Claret L, et al. J Clin Oncol. 2009, 27:4103
-
2.
Stein WD, et al. Clin Cancer Res. 2010, 17:907
-
3.
Wang Y, et al. Clin Pharmacol Ther. 2009, 86:167.
M-033
Towards FDA and EMA Endorsement of a Clinical Trial Simulation Tool for Amnestic Mild Cognitive Impairment
Daniela J Conrado1, Brian Willis2, Vikram Sinha3, Timothy Nicholas4, Jackson Burton1, Julie Stone3, Danny Chen4, Neva Coello5, Wenping Wang6, Volker D Kern1, Stephen P Arnerić1, Klaus Romero1 on behalf of the Critical Path for Alzheimer’s Disease
1Critical Path Institute, Tucson, AZ, USA; 2Eli Lilly and Company, Indianapolis, IN, USA, 3Merck & Co. Inc., North Wales, PA, USA, 4Pfizer, Groton, CT, USA, 5Novartis Pharmaceuticals Corporation, Basel, Switzerland, 6Novartis Pharmaceuticals Corporation, East Hanover, NJ
Objectives: There is an increased focus on evaluating Alzheimer disease (AD) drug candidates at earlier disease stages. Challenges in early AD clinical trials include: (a) slow rate of change in clinical outcomes over the study duration, and (b) patient pathophysiological uncertainty and heterogeneity. Therefore, an improved understanding of rates of change and its predictors for registration endpoints is critical for optimal trial design. The goal herein is to develop a disease progression model-based clinical trial simulation tool to help inform clinical trial design in subjects with amnestic mild cognitive impairment (aMCI). The analysis endpoint was the Clinical Dementia Rating scale – Sum of Boxes (CDR-SB).
Methods: Subject-level data from three sources—the Alzheimer’s Disease Neuroimaging Initiative (ADNI)-1 and ADNI-2 observational studies, and the Investigation Into Delay to Diagnosis of Alzheimer’s Disease With Exelon (InDDEx) trial placebo arm—yielded a total of 1051 aMCI subjects with 7860 CDR-SB timepoints in the screening-to-48 months interval. The disease progression model was built using ADNI data (n = 702), with InDDEx being reserved for external validation. The time course of CDR-SB was described by a non-linear mixed-effects model. Based on prior knowledge and/or clinical interest, the pre-specified covariates were: baseline intracranial volume-adjusted hippocampal volume (ICV-HV), sex, baseline mini-mental-state-examination (MMSE), baseline age, and apolipoprotein-E (APOE) genotype.
Results: The Richards model, a generalized logistic model, best captured the non-linear time course of CDR-SB scores. The table presents the parameter estimates, with its respective predictors. The disease progression model is being coded into an R simulation package and web-simulator with a user-friendly graphical interface. Expansion of the modeling dataset with clinical trials data will also allow a description of placebo effect. FDA and EMA endorsement are being pursued.
Conclusions: This clinical trial simulation tool will help inform trial design, including inclusion/exclusion criteria, enrichment and stratification approaches for aMCI.
Interpretation of parameter values, covariates effects, and their relationships 1,2
Parameter | Frequentist FOCE Population estimate | Transformation or parameter–covariate relationship | Interpretation for the population estimate at the original scale | Bayesian NUTS Median estimate (2.5th, 97.5th) |
|---|---|---|---|---|
Baseline (points) | 0.081 | \( {\text{Baseline}}^{\prime} \times 18 \) Where Baseline′ denotes the estimated typical baseline CDR-SB within the (0, 1) interval; the 18 points denotes the highest possible observed CDR-SB score. | The estimated baseline CDR-SB score is 1.5 points | 0.081 (0.078, 0.085) |
MMSE effect on baseline (centered at 27.5 points) | −2.2 | \( {\text{Baseline }} \times \left( {\frac{\text{MMSE}}{27.5}} \right)^{ - 2.2} \) | A decrease in baseline MMSE score from 27.5 to 26.5 is associated to approximately 8% increase in baseline CDR-SB score | −2.2 (−2.8, −1.6) |
Intrinsic progression rate (year−1) | 0.13 | \( \frac{{{\text{dScore}}_{\text{i}} }}{\text{dt}} = {\text{r}}_{\text{i}} \times {\text{Score}}_{\text{i}} \times \left[ {1 - \left( {\frac{{{\text{Score}}_{\text{i}} }}{{{ \hbox{max} }\left( {{\text{Score}}_{\text{i}} } \right)}}} \right)^{{{\beta }}} } \right] \times 18 \) \( 0.13 \times 0.081 \times \left( {1 - 0.081^{3.3} } \right) \times 18 \) | The estimated typical rate of change in CDR-SB score is 0.2 point/year | 0.12 (0.088, 0.15) |
Age effect on rate (centered at 73 years old) | 1.5 | \( {\text{Rate of change }} \times \left( {\frac{\text{Age}}{73}} \right)^{1.5} \) | An increase in age from 73 to 74 years old is associated to approximately 2% increase in CDR-SB progression rate | 1.5 (0.046, 3) |
Female sex effect on rate | 1.3 | \( {\text{Rate of change }} \times 1.3 \) | Females have approximately 30% higher CDR-SB progression rate than males | 1.3 (1, 1.7) |
MMSE effect on rate (centered at 27.5 points) | −3.2 | \( {\text{Rate of change }} \times \left( {\frac{\text{MMSE}}{27.5}} \right)^{ - 3.2} \) | A decrease in baseline MMSE score from 27.5 to 26.5 is associated to approximately 12% increase in CDR-SB progression rate | −3.1 (−5.1, −1.2) |
APOE-ɛ4 non-carrier effect on rate | 0.60 | \( {\text{Rate of change }} \times 0.6 \) | APOE-ɛ4 non-carriers have approximately 40% lower CDR-SB progression rate than carriers | 0.60 (0.41, 0.79) |
ICV-HV effect on rate3 (centered at 5.29 cm3) | −0.81 | \( {\text{Rate of change }} \times \left[ {1 - 0.81 \times \left( {{\text{ICVHV}} - 5.29} \right)} \right] \) \( {\text{Rate of change }} \times \left[ {1 - 0.52 \times \left( {{\text{ICVHV}} - 7.54} \right)} \right] \) | A 1-cm3 decrease in baseline ICV-HV is associated to approximately 81% increase in CDR-SB progression rate | −0.84 (−1.2, −0.49) |
Missing ICV-HV effect on rate | 1.7 | \( {\text{Rate of change }} \times 1.7 \) | On average, the group of subjects with missing ICV-HV have approximately 70% higher CDR-SB progression rate than the subjects with a ICV-HV of 5.29 cm3 | 1.7 (1.1, 2.4) |
Shape factor of the Richards’ model | 3.3 | \( {\text{Inflection point}} = \left( {\frac{1}{{1 + {\text{shape}}}}} \right)^{{1/{\text{shape}}}} \times 18 \) | The inflection point of the rate of change in CDR-SB is estimated to occur at a score of approximately 11.6 points | 4.6 (−0.17, 9.5) |
Variance of baseline random effects | 0.25 | \( {\text{Coefficient of variation}} = \sqrt {e^{0.25} - 1} \times 100 \)Where log-normally distributed between-subject variability was estimated for the baseline scores to prevent the prediction of nonsensical scores at the subject level | The coefficient of variation for the baseline CDR-SB scores is approximately 53% | 0.25 (0.21, 0.29) |
Covariance between baseline and rate random effects | 0.046 | \( {\text{Correlation coefficient}} = \frac{0.046}{{\sqrt {\text{variance of baseline}} \times \sqrt {\text{variance of rate}} }} \) | The correlation coefficient between baseline and rate random effects is 0.37 | 0.046 (0.033, 0.06) |
Variance of rate random effects | 0.062 | \( {\text{Coefficient of variation}} = \frac{{\sqrt {0.062} }}{\text{intrinsic progression rate}} \times 100 \) | The coefficient of variation for the CDR-SB intrinsic progression rate is approximately 196% | 0.063 (0.052, 0.075) |
Dispersion factor of the beta distribution | 57 | \( {\text{Standard deviation}} = \frac{{{\text{Score}}^{\prime} \times \left( {1 - {\text{Score'}}} \right)}}{57 + 1} \) where Score′ denotes the expected CDR-SB score of the beta distribution within the (0, 1) interval | At the typical baseline CDR-SB score, the standard deviation of the beta distributed residual variability is 0.036 points | 57 (54, 60) |
Condition number | 15 | Not applicable | Condition number is the ratio of the largest to the smallest eigenvalue of the covariance matrix, and measures ill-conditioning. There is no consensus in the literature of what constitutes a large condition number. In the field of Pharmacometrics, it is commonly accepted that a condition number exceeding 1,000 is indicative of severe ill-conditioning. | 17 |
M-034
Optimality in paediatric dosing – a weighty issue?
Daren Austin, Isabelle Pouliquen
Clinical Pharmacology Modelling & Simulation, GlaxoSmithKline
Objectives: To identify formally optimal solutions for dosing paediatric patients based on weight bands of interest
Methods: Multiple methods exists to define dosing in children. Allometric scaling is commonly used to extrapolate clearance and volume of distribution, and hence exposure, from species to species and from adults to children. We present formally optimal closed-form solutions to the problem of estimating both paediatric exposure ratio to adults, and root mean square difference in exposure from adults across a weight band of interest. Having solved in closed-form, we then consider the role age (as opposed to weight) and between-subject variability play on recommending doses for paediatric subjects.
Results: Over a weight band of interest, there is a formally optimal dose ratio necessary to match adult exposure closely. For the weight bands 15–60 kg, 7.5–15 kg, 15–30 kg, and 30–60 kg, the optimal root mean square error, compared with adult target exposures are 29, 15, 15 and 15%, respectively, with optimal dose ratios of 0.52, 0.24, 0.41 and 0.68 (see figure). Other alternative weight bands are easily estimable in closed-form and depend only on the weight ratios selected for each band. The results are shown to be robust to assumptions regarding allometric scaling powers and the effects of between-subject variability.
Conclusions: An optimal closed-form solution for dose ratio that minimises root mean square error compared with target adult exposure, shows that even a single weight band of 15–60 kg for paediatrics presents only a 29% RMSE compared with target adult exposure, if dosed at a ratio of 52% of the adult dose. The need for fine-tuning of weight bands for paediatric dosing is therefore called into question.

Reference
Mahmood I, Prediction of drug clearance in children: a review of different methodologies. Expert Opin Drug Metab Toxicol. 2015 Apr;11(4):573–87.
M-035
Bedside Sample Time Collection to Improve Model Informed Precision Dosing for Patient Care
David McDougall1,2, Bruce Green1, Stephen Duffull3
1Model Answers, Brisbane, Australia; 2Univeristy of Queensland, Brisbane, Australia; 3University of Otago, Dunedin, New Zealand
Objectives: The aim of model informed precision dosing (MIPD) is to individualize drug doses from pharmacokinetic or pharmacodynamic observation(s) together with a population model. The clinical utility of MIPD may be influenced by the quantity and timing of observation(s) collected. The objective of this analysis is to illustrate how sample times can be optimized for MIPD for voriconazole (which shows 2-compartment behavior with mixed linear and nonlinear elimination).
Methods: A clinically plausible sampling design space was selected that allowed three samples within the first 48 h of therapy. A published voriconazole population PK model was available1, with the variance–covariance matrix scaled to reduce the prior information for the PK parameters with the largest impact on the target trough concentration (Ctrough). The design space was searched using an exchange algorithm to derive robust D-optimal sampling times. Joint sampling windows were determined using an efficiency criterion of ≥ 0.9.
Results: The PK parameters, CL, Vmax and KM had the largest impact on Ctrough. The optimal sampling time points for voriconazole MIPD were 4 h, 12.5 h, and 41.5 h following the start of Q12H dosing. The joint and marginal sampling windows derived are displayed in Figure 1.
Conclusions: Samples collected during the joint sampling windows will likely result in increased precision in parameter estimates and allow valuable dose recommendations through MIPD. The application of OD for MIPD is rarely discussed and could potentially improve the clinical utility of this approach and ultimately patient outcomes.

Fig. 1 Sampling windows for voriconazole MIPD. The solid lines represent the marginal sampling windows, and the colored areas represent the joint sampling windows (Color figure online).
Reference J Pharmacokinet Pharmacodyn. 2016 Apr;43(2):165–77.
M-036
A Population Pharmacokinetic Model of Samidorphan Following Sublingual Administration of ALKS 5461 in Patients With Major Depressive Disorder
David McDougall1, Fran Stringer1, Hong Lu2, Marjie Hard2, Bruce Green1, Lisa von Moltke2
1Model Answers, Brisbane, Australia, 2Alkermes Inc, MA, USA
Objectives: ALKS 5461 (a fixed-dose sublingual (SL) combination of buprenorphine and samidorphan (SAM)) is an opioid system modulator intended for the adjunctive treatment of major depressive disorder (MDD) in patients who have an inadequate response to standard therapies.[1] The objective was to characterize the PK of SAM following SL administration of ALKS 5461.
Methods: Data from 10 studies (healthy volunteers (HV), adult subjects with MDD, renal and hepatic impairment) were included in the analysis. A non-linear mixed effects model was developed in NONMEM v7.3. Diagnostics, and prediction corrected visual predictive checks were used to evaluate the model.
Results: The PK of SAM in healthy and MDD subjects following single and multiple doses of SL ALKS 5461 was described by a 2-compartment model, linear elimination, and absorption via a series of transit compartments. Population estimates of CL/F and Vc/F were 45.3 L/h and 383 L, respectively. Inter-individual variability estimates on CL/F and Vc/F were 28.1% and 25.4%, respectively. A time dependent residual error model was included to account for the higher variability observed in the absorption phase. Patient intrinsic factors such as age, gender, race, and the concomitant administration of anti-depressant therapy (ADT) had no effect on the PK of SAM. Subjects with renal or hepatic impairment showed increased SAM exposure and were accounted for by the covariate model.
Conclusions: A population PK model for SAM following SL administration of ALKS 5461 was developed which demonstrated that no dose adjustment of SAM in ALKS 5461 is needed in patients based on age, gender, race or concomitant treatment of ADTs.

Fig. 1 Prediction corrected visual predictive check for the final SAM model in subjects with MDD
References
-
1.
Fava M. Am J Psychiatry. 2016 May 1;173(5):499–508.
M-037
Physiologically-Based Pharmacokinetics Model Development for Epacadostat
Xiaohua Gong1, Alice Ke2, Tao Ji1, Qiang Zhang1, Jason Boer1, Yan Zhang1, Sharon Diamond1, Naresh Punwani1, Xuejun Chen1, Swamy Yeleswaram1.
1Incyte Research Institute, Wilmington, DE, 2Certara, Princeton, NJ
Background: Epacadostat is being developed for the treatment of malignant diseases. The enzyme UGT1A9 was identified to be the major enzyme responsible for the metabolism of epacadostat to form the major metabolite M9. 100 mg BID has been selected as the target dose level in Phase III trials.
Methods: The base model used first-order absorption together with a minimal PBPK model that incorporates in vitro UGT1A9-mediated metabolism data and human mass balance study data. The uncertainty in fmUGT1A9 (46–64% based on human mass balance data) for epacadostat was evaluated against the observed DDI effects. The final epacadostat adult PBPK model was comprised of an ADAM absorption model with a minimal PBPK model.
Results: The application of epacadostat PBPK model assuming an fmUGT1A9 value of 46% led to predicted epacadostat geometric mean AUC(0,∞) and Cmax ratios of 1.31 and 1.22, respectively, consistent with the observed ratios of 1.34 (90%CI: 1.28–1.40) and 1.26 (90%CI: 1.12–1.42), respectively, in a clinical DDI study between epacadostat and mefenamic acid. The final epacadostat minimal PBPK with ADAM absorption recovered the observed systemic exposure following the oral dose of 300 mg and 700 mg BID epacadostat in healthy volunteers and 25 mg BID to 400 mg BID in cancer patients. The predicted AUCss values were within 0.7 to 1.1-fold of the observed data for healthy volunteers and within 1.5-fold in cancer patients. However, the final model significantly under-predicted (up to 2.9-fold) the systemic exposure following the dosing of 500–700 mg BID in cancer patients.
Conclusion: An epacadostat PBPK model was developed and verified using existing clinical pharmacokinetic and DDI data. This model can be prospectively applied for purposes such as to estimate DDI between a strong UGT1A9 inhibitor and epacadostat, or to estimate starting dose for pediatric clinical evaluations.

Fig. 1 Prediction-corrected visual predictive check for the final BUP model
M-038
Threading a Needle - Selecting Doses in Early Development of an Antituberculosis Agent - Maximizing Probability of Technical Success while Balancing Safety, Efficacy and Sample Size
David Tenero* (1) and Navin Goyal (1)
(1) GlaxoSmithKline, CPMS, PA
Objectives: GSK3036656 is under development for treatment of tuberculosis (TB) and acts by suppressing protein synthesis by selectively inhibiting Leucyl t-RNA synthetase. A dose-ranging clinical study in rifampicin-susceptible patients is planned to characterize the drug’s early bactericidal activity (EBA).
Methods: The EBA study was designed to have up to 4 sequential cohorts (n = 20/cohort) with 3:1 randomization of GSK3036656:Rifafour e-275 (standard of care for TB). Doses were to achieve an efficacy exposure target [AUC(0–24) = 1.74 μg h/mL] in most subjects based on results in a mouse model while limiting individual subject exposure below AUC(024) = 4.9 μg h/mL and Cmax = 0.443-μg/mL based on pre-clinical toxicology data. Data obtained in an FTIH study were used to develop a population pharmacokinetic (POPPK) model (NONMEM v7.2). Clinical trial simulations with parameter uncertainty (mrgsolve in R) were conducted with different doses to characterize:
-
target attainment rate (TAR) defined as the percentage of participants exceeding target exposure for efficacy
-
predicted probability of any individual within a trial exceeding exposure limits (proposed next dose was acceptable if the predicted probability was ≤ 10%)
Results: Data were adequately described by a 2-compartment model with first-order absorption. Visual and numerical predictive checks demonstrated adequate model performance (1). A TAR > 90% was achieved with doses ≥ 9 mg while doses ≤ 12 mg gave acceptable probabilities of individuals not exceeding exposure limits. The starting dose for the EBA study was selected to be 5 mg.
Conclusion: Clinical trial simulations allowed for dose selection for an EBA study, balancing restrictive exposure limits and target attainment rate with given sample size criteria. The model-based approach was critical in characterizing the probability of technical success with a given study design supporting the decision to progress with the study.
This project was funded by GSK.
Reference
-
1.
Tenero D, Goyal N. Clinical trial simulations to guide dose escalation in FTIH for a drug with absolute individual exposure limits. J Pharmacokinet Pharmacodyn 2017;44:S26–27.
M-039
Modeling Sex Differences in Anti-inflammatory Effects of Dexamethasone in Arthritic Rats
Dawei Song1, Debra C DuBois1,2, Richard R Almon1,2, William J Jusko1
1Department of Pharmaceutical Sciences, School of Pharmacy and Pharmaceutical Sciences, State University of New York at Buffalo, Buffalo, NY, 14214, USA; 2Department of Biological Sciences, State University of New York at Buffalo, Buffalo, NY, 14260, USA
Objectives: Collagen-induced arthritis (CIA) rats are used commonly for preclinical research into rheumatoid arthritis (RA). Dexamethasone (DEX), like many potent corticosteroids (CS), remains an important component in combination therapy for RA. Although human sex differences in RA and CS pharmacokinetics/pharmacodynamics (PK/PD) have been documented, there has been no such comprehensive evaluation of sex differences in CIA rats. We applied a small-scale PK/PD/DIS model to assess data from CIA animals to characterize sex differences in anti-inflammatory effects of DEX.
Methods: Paw size measurements were obtained for males and females from four groups of animals: healthy controls, non-drug treated arthritic animals, and both 0.225 and 2.25 mg/kg DEX-treated arthritic animals. A turnover model for disease progression, minimal PBPK model for drug concentrations, and inhibitory indirect response model were applied using population modeling.
Results: There were 5380 observations from 532 rats with approximately a 1:1 sex ratio that were well fitted using population modeling. The clearances of DEX were 43% greater in males, but other parameters were similar. The temporal profiles of paw swelling exhibited earlier progression, peak edema times, and disease remission in females. DEX suppressed paw edema well in both males and females with similar capacity (Imax) values (= 1.0), but DEX potency was less in females with higher IC50 values (0.101 versus 0.015 ng/mL). Figure 1 below demonstrates population prediction profiles of paw edema measurements for females and males.
Conclusions: The mathematical model well described the PK and effects of single doses of DEX at two dose levels in female and male CIA rats. This study addresses knowledge gaps about sex differences in CIA rats and can serve as a guide for more mechanistic assessment of sex, drug, and disease differences in RA.

Figure 1
M-040
A Quantitative Systems Pharmacology (QSP) Model for Bispecific Protein Degraders
Derek W. Bartlett1, Jeremy Starr2, Britton Boras1, Mary E. Spilker1, Adam Gilbert2, Tristan Maurer3
1Medicine Design, Worldwide Research and Development, Pfizer Inc., San Diego, CA 2Discovery Sciences, Worldwide Research and Development, Pfizer Inc., Groton, CT 3Medicine Design, Worldwide Research and Development, Pfizer Inc., Cambridge, MA
Objectives: Bispecific protein degraders are an emerging therapeutic modality that can engage the ubiquitin–proteasome pathway to catalytically degrade intracellular proteins through the formation of ternary complexes with the target protein and E3 ubiquitin ligases. The “event-driven” pharmacology resulting from this catalytic degradation mechanism challenges traditional drug development paradigms and requires a novel approach for exposure–response evaluation. Here, we present a QSP model of bispecific protein degraders that provides insights into their design and can support their translational development.
Methods: A QSP model using ordinary differential equations was created in MATLAB SimBiology to represent the pharmacokinetics and pharmacodynamics of bispecific protein degraders. Mass action kinetics were used to describe the reaction network governing ternary complex formation and subsequent target ubiquitination and degradation. Target protein knockdown was linked to target-specific mechanistic pathways driving pharmacological response. Initial parameter values were used to ensure an appropriate system response and to perform sensitivity analyses. Subsequently, model fitting to published data for bispecific protein degraders enabled creation of compound-specific model variants for hypothesis testing and mechanistic investigations.
Results: Model simulations illustrated how endogenous target protein turnover and ternary complex-mediated target ubiquitination can limit the maximum target knockdown for a given drug exposure. Importantly, selectivity can be driven by ternary complex stability and the efficiency of target ubiquitination rather than ligand binding affinities alone. Finally, simulations were used to identify conditions that result in target knockdown at sub-nM drug exposures and a “hook effect” at high drug exposures owing to reduced ternary complex formation.
Conclusions: Understanding the complex exposure–response relationship for bispecific protein degraders will be a critical step in their successful development and translation as human therapeutics. The QSP model described here can link drug exposure to ubiquitin-mediated target degradation and the ensuing pharmacological response, enabling a rational and systematic approach for bispecific protein degrader design.
M-041
Comparable Population Pharmacokinetics of Cefadroxil in Cystic Fibrosis Patients and Healthy Volunteers
Dhruvitkumar S. Sutaria (1), Yuanyuan Jiao (1), Xun Tao (1), Ulrich Stephan (2), Martina Kinzig (2), Fritz Sörgel (2)*, Jürgen B. Bulitta (1)*
(1) Center for Pharmacometrics and Systems Pharmacology, Department of Pharmaceutics, College of Pharmacy, University of Florida, Orlando, FL, USA. (2) Institute for Biomedical and Pharmaceutical Research – IBMP, Nürnberg, Germany
Objective: Bacterial infections are common in cystic fibrosis (CF) patients. Thus, improving the morbidity and mortality in this patient group by optimal antibiotic treatment is important. Prior studies suggested a slower absorption for several oral antibiotics. Our aim was to compare the population pharmacokinetics (PK) of oral cefadroxil between CF-patients and healthy volunteers.
Methods: We studied eight adult CF-patients (age: 19.8 ± 3.2 yrs) and six healthy volunteers who received a single oral dose of 1000 mg cefadroxil. We determined cefadroxil in plasma and urine by HPLC–UV and used the S-ADAPT software package for population PK modeling. All plasma and urine data were simultaneously modelled. We accounted for the effect of body size and body composition by linear and allometric scaling based on total body weight (WT) and lean body mass (LBM).
Results: Oral bioavailability was complete in both subject groups, since the entire dose was excreted unchanged in urine. The final absorption model used a Michaelis–Menten function with a time-dependent maximum rate of gastric emptying followed by first-order absorption from intestine. Body mass index was used as covariate to describe the slower rate and delayed gastric emptying in CF-patients compared to healthy volunteers. For an allometric model based on LBM, renal clearance was 20% larger in CF-patients and volume of distribution at steady-state was very similar (± 1%) in both subject groups.
Conclusions: Cefadroxil was reliably and completely absorbed in both subject groups. Oral absorption was considerably slower in lean CF-patients. Allometric scaling by LBM well explained the PK differences between both subject groups. Therefore, LBM can be used as a body size descriptor for dosing of CF-patients.

M-042
Modeling Pharmacodynamic Biomarkers related to CDK4/6 Inhibition and Cell Cycle Modulation in Patients with Advanced Breast Cancer
Wan Sun1, Yuan Liu1, Diane Wang1
1Clinical Pharmacology, Pfizer, San Diego, CA
Objectives: To develop pharmacokinetic (PK)/pharmacodynamic (PD) models to characterize the longitudinal alterations of PD biomarkers, i.e., phosphor-Rb (pRb) and Ki67 level in skin tissue, following the treatment with palbociclib, a cyclin-dependent kinases 4 and 6 (CDK4/6) inhibitor, in patients with advanced breast cancer (ABC).
Methods: The analyses included data in a Phase 1, single-arm study from 26 Chinese patients who received palbociclib (125 mg QD with 3 weeks on and 1 week off schedule) plus letrozole as first-line ABC treatment. A population PK model was built first and the individual PK parameters were used to predict plasma concentration of palbociclib for PK/PD modeling. For each biomarker, a precursor-dependent indirect response model was developed to describe the drug-induced decrease and rebound effect as drug washes out, and correlate palbociclib concentration to the inhibitory effect of palbociclib on the transition between the precursor compartment and a response compartment. For Ki67, an additional transit compartment was added to accommodate the observed delay in reduction and rebound of expression level for this biomarker.
Results: The final PK/PD models adequately described the longitudinal change of both PD biomarkers. The models demonstrated palbociclib caused the reduced expression of the PD biomarkers. The estimated IC50 value was ~ 45 ng/mL for both pRb and Ki67. At steady-state, the average peak and trough concentrations of palbociclib reported in this study were approximately 140 and 68 ng/mL, which were well above the estimated IC50 values for the two biomarkers.
Conclusions: The present modeling analyses demonstrated that the CDK4/6 inhibition and resulting cell cycle arrest by palbociclib, and the current dosing regimen provided sufficient inhibition on both 2 PD biomarkers.
M-043
A Mechanistic Small Systems Model to Explore the Pharmacokinetics and Pharmacodynamics of Concizumab
Dongfen Yuan1, Frederik Rode2, Yanguang Cao1,3
1Division of Pharmacotherapy and Experimental Therapeutics, UNC Eshelman School of Pharmacy, University of North Carolina at Chapel Hill, Chapel Hill, North Carolina 27599, USA; 2Novo Nordisk, Måløv, Denmark; 3Lineberger Comprehensive Cancer Center, University of North Carolina at Chapel Hill, Chapel Hill, North Carolina 27599, USA.
Objectives: Antibodies are constantly internalized into endothelial endosomes via nonspecific pinocytosis and recycled by neonatal Fc (FcRn) receptors. Once bound to membrane-bound targets, antibodies cannot be recycled by FcRn, showing target-mediated drug elimination or disposition. Recycling antibodies are engineered to release the cognate targets in the endosomes to rescue antibodies from membrane target-mediated nonlinear clearance. Concizumab is a humanized monoclonal antibody against both soluble and endothelial plasma membrane-bound tissue factor pathway inhibitor (sTFPI and mTFPI) for hemophilia treatment. A mechanistic systems model was developed to describe the mTFPI-mediated nonlinear clearance and sTFPI suppression of concizumab in humans and to assess the potential of designing recycling antibodies for concizumab.
Methods: The mechanistic model was based on a minimal physiologically-based pharmacokinetic model. The model was extended with two endothelial endosome compartments in parallel with the plasma compartment to describe the nonspecific pinocytosis and the mTFPI-mediated endocytosis of concizumab. The nonspecific pinocytosis was optimized based on the clearance of antibodies in FcRn-dysfunctional human. The recycling rate of FcRn-bound antibodies is kept consistent with endosomal transit time. The nonspecific catabolism in endosomes was fitted using pharmacokinetic data of adalimumab in humans. The turnover of sTFPI and mTFPI were optimized using a base model before adding the endosome compartments. Simulations of recycling antibodies were performed by adjusting antibody binding affinities to mTFPI and sTFPI in endosomes.
Results: The mechanistic model adequately captured the pharmacokinetics of concizumab and sTFPI profiles in humans after intravenous or subcutaneous administration at multiple doses. Simulations of recycling antibodies showed that a 100- or 1000-fold reduction in target binding affinity in endosomes can extend sTFPI suppression from 15 days to 22 or 36 days.
Conclusions: The mechanistic small systems model provides a valuable tool to understand the pharmacokinetics and pharmacodynamics of concizumab and to guide the development of anti-TFPI recycling antibodies.

M-044
Concentration-QT Analysis of Quizartinib in Patients with Relapsed/Refractory AML
Dongwoo Kang1, Kuan-ju Lin2, Elizabeth Ludwig2, Ophelia Yin1
1Daiichi Sankyo, Inc, Basking Ridge, NJ, USA; 2Cognigen Corporation, a Simulations Plus Company, Buffalo, NY, USA
Objectives: Quizartinib is a highly potent and selective FLT3 inhibitor, and has shown high clinical activity in patients with relapsed/refractory acute myeloid leukemia (AML) with FLT3-ITD mutations. In this analysis, we evaluated the relationship between pharmacokinetic exposures of quizartinib and active metabolite AC886 and QTc interval.
Methods: Data were obtained from a Phase 2 Study (2689-CL-2004; NCT #01565668) evaluating the safety and efficacy of quizartinib with planned doses of 30 mg/d and 60 mg/d in relapsed/refractory AML patients with FLT3-ITD mutations. Serial triplicate centrally reviewed electrocardiograms, together with time-matched PK samples, were collected over 24 h following a single dose on cycle 1 day1 and at steady state on cycle 1 day 15. Different base structural models, correction terms for QTc, potential hysteresis, circadian rhythm correction and model parameter distribution, were thoroughly evaluated. Covariates evaluated include baseline QTcF, patient demographics (sex, age, body weight, race), low electrolyte (Ca, K, Mg) levels, and concomitant use of QT prolonging agents.
Results: Analysis included 868 time-matched mean QTc and concentration measurements from 73 patients. QTcF increases linearly with respect to concentrations of quizartinib and AC886 (Figure 1), with 15-fold higher slope for quizartinib than AC886. Race was identified as a statistically significant covariate on baseline QTcF, with baseline QTcF being approximately 4% higher in the white race as compared to others. Model predicted mean QTcF increase from baseline was 7.36 and 19.3 ms (upper bound of two-sided 90% CI: 8.90 and 23.3 ms) respectively, for quizartinib 30 mg/d and 60 mg/d. An alternative model with quizartinib concentration alone as a predictor provided similar results.
Conclusions: Analysis suggested concentration-dependent QTc prolongation of quizartinib. Results support clinical recommendation of dose reduction in patients receiving strong CYP3A inhibitors, where quizartinib exposure is increased 2-fold in the presence of such agents.

Fig. 1 Scatterplot of observed ΔQTcF versus quizartinib and AC886 concentrations, overlaid with model predicted mean (solid line) and 90% CI (shaded area) of the mean ΔQTcF based on the respective slopes of quizartinib and AC886 in the model
M-045
Population Pharmacokinetics and Exposure–Response Analyses of an MDM2 Inhibitor Milademetan
Dongwoo Kang1, Prasanna Kumar1, Oleg Zernovak1, Saeheum Song1, Yuan Xiong2, Tim Bergsma2, Mark Lovern2, Ophelia Yin1
1Daiichi Sankyo, Inc., Basking Ridge, NJ, USA; 2Certara, Princeton, NJ, USA.
Objectives: Milademetan is a novel small-molecule inhibitor of murine double minute 2 (MDM2) that is being developed for the treatment of solid tumors and leukemia. The objectives of this analysis were to characterize milademetan population pharmacokinetics and exposure–response relationships, including safety endpoints thrombocytopenia, GI toxicity, fatigue and dysgeusia, and pharmacodynamic biomarker MIC-1.
Methods: Data from two phase I studies in patients with solid tumor (n = 87) and one phase I study in patients with leukemia (n = 37) were included. Milademetan was administered 15–240 mg once daily (QD) in 21of 28 days per cycle (QD 21/28), or 90 mg QD continuously (QD 28/28). The maximum tolerated dose of milademetan was 120 mg QD 21/28, or 90 mg QD 28/28.
Results: Plasma concentrations of milademetan were adequately described by a two-compartment model with sequential zero- and first-order absorption with lag time. A semi-mechanistic longitudinal model, incorporating a mixture of three sub-populations with different levels of feedback strength from the circulating to proliferative cells, was found to well capture the observed platelet count profiles across different doses. Simulation results suggested that less frequent and higher doses, such as 160–340 mg one week on and three weeks off, or on days 1–3 and 15–17, are associated with lower incidence of ≥ grade 3 thrombocytopenia, as compared to 120 mg QD 21/28 (Table 1). Risks of ≥ grade 2 GI toxicity and fatigue increased with the increase in milademetan average daily exposure. No significant exposure–response relationship was observed for ≥ grade 2 dysgeusia, which is likely due to the lower incidence. There is a strong correlation between milademetan exposure and MIC-1 level, confirming the target engagement.
Conclusions: Analyses suggested that alternate dosing regimens of milademetan may mitigate the risks of thrombocytopenia and GI toxicity. These new dosing regimens are currently being evaluated in milademetan clinical development program.
Table 1 Model predicted probability (%) of thrombocytopenia with various milademetan dosing regimens
Dosing Regimen | Grade ≥ 2 | Grade ≥ 3 | |
|---|---|---|---|
90 mg | 3 weeks on, 1 week off (QD 21/28) | 31.4 | 24 |
1 week on, 3 weeks off | 3.7 | 1.8 | |
Days 1–3 and 15–17 only | 1.8 | 1.8 | |
120 mg | 3 weeks on, 1 week off (QD 21/28) | 40.1 | 29.1 |
1 week on, 3 weeks off | 7.4 | 3.7 | |
Days 1–3 and 15–17 only | 4.4 | 1.8 | |
160 mg | 3 weeks on, 1 week off (QD 21/28) | 53.5 | 33.8 |
1 week on, 3 weeks off | 14.9 | 7.4 | |
Days 1 to 3 and 15 to 17 only | 8.7 | 3.7 | |
200 mg | 3 weeks on, 1 week off (QD 21/28) | 60.6 | 49.5 |
1 week on, 3 weeks off | 19.9 | 13.1 | |
Days 1–3 and 15–17 only | 15.7 | 8.7 | |
260 mg | 3 weeks on, 1 week off (QD 21/28) | 68.7 | 58.9 |
1 week on, 3 weeks off | 27.9 | 19.9 | |
Days 1–3 and 15–17 only | 24.2 | 15.3 | |
340 mg | 3 weeks on, 1 week off (QD 21/28) | 83.5 | 69.6 |
1 week on, 3 weeks off | 34.3 | 28 | |
Days 1–3 and 15–17 only | 31.4 | 26.1 |
M-046
Allometric Scaling of Time-dependent CSF Exposure for Monoclonal Antibody-based Drugs between Cynomolgus Macaques and Humans
Drew MacCannell1, Ivan Nestorov1, Kumar Kandadi Muralidharan1, Michael Monine1, Kubra Kamisoglu1
1Biogen, Cambridge, MA, USA
Objective: To improve predictions of monoclonal antibody (mAb) exposure within the central Nervous System (CNS), preclinical nonhuman primate (NHP) data was leveraged to bolster a sparse dataset of human cerebrospinal fluid (CSF) pharmacokinetics. From this combined human/NHP dataset, a model which was parameterized which accurately predicted antibody pharmacokinetics in the human CSF.
Methods: A complete time course of pharmacokinetic data was available for BIIB092 from both the CSF and serum in both humans and NHPs which provided initial data points to inform the time-dependent transit into and clearance from the CSF. From this training dataset, a collection of first-order rate constants, baseline volumes of distribution, and allometric scaling coefficients was derived, as well as interindividual variability on all parameters. This parameter set was used to derive the estimated time to equilibration between the CSF and circulation, as well as the time of maximum concentration in the CSF (tmax), and total exposure within the CSF (AUC0-∞).
Results: Scaling by body mass produced allometric exponents for the transit into and from the CSF, identifiable at −0.65 and −0.85 respectively (RSE % = 6.49 and 5.99 respectively), while clearance rate from the serum and transit into the periphery (g = −0.204 and −0.28 respectively) were both consistent with typical values of g = −0.25. All parameters were well-identified (RSE % < 20% for all fitted parameters). Simulations predict a tmax within the CSF of 160 h, and a terminal half-life in both CSF and serum of approximately 574 h. Total exposure ratios (AUC0-∞ser/AUC0-∞CSF) was estimated at 584 for all doses, assuming linear pharmacokinetics within both compartments.
Conclusions: Compartmental modeling produces a set of scaling parameters by which the human exposure can be predicted from nonhuman primate data. Future exploration will include validating these findings within other brain penetrant monoclonal antibodies for which CSF exposure data has been made available.
M-47
Development of a Preclinical Quantitative Systems Pharmacology Model for E7046, a Novel PGE2 Receptor Type 4 Antagonist for Cancer Immunotherapy
Schuck, Edgar1; Kierzek, Andrzej2; Walker, Mike2; Pichardo, Cesar2; Checkley, Steve2; Small Ben2; van der Graaf, Piet2; Benson, Neil2; Dayal, Satish3; Albu, Diana4; Jiang, Rosa4; Xu, Lucy1; Reyderman, Larisa1, and Bao, Xingfeng4
1Eisai Inc., Woodcliff Lake, NJ, USA; 2Certara UK, Sheffield, United Kingdom; 3Eisai Ltd, Hatfield, United Kingdom; 4Eisai Inc., Andover, MA, USA
Objectives: To develop an immuno-oncology QSP model for E7046, a novel prostaglandin E2 (PGE2) receptor type 4 (EP4) inhibitor, and use it to identify predictive biomarkers for tumor growth inhibition (TGI) in mice. Once developed and translated to humans, the model is expected to aid selection of efficacy biomarkers in the clinical development of E7046.
Methods: We developed a new mechanistic and quantitative model integrating new experimental data on immune system response to pre-clinical syngeneic CT26 tumors and enhancement of this response by E7046. The data used for modeling included tumor infiltration by CD8 T cells and monocytes, blood levels of CD8 T cells, Treg cells, mMDSCs, and gMDSCs, PGE2 concentrations in serum and tumor, and the pharmacokinetics of E7046 in mice. Data were integrated with an ordinary differential equation model of 56 variables describing dynamics of molecular species and cell types in 11 compartments. The 138 parameters involved in 88 rate laws were established by literature meta-analysis and fitting to experimental data.
Results: Verification of model performance showed that it adequately predicted the TGI of CT26 by E7046 in mice, as well as tumor and blood profiles of PGE2 and various cell populations. Three system parameters were identified as predictors of TGI by E7046: tumor CD8 T cell infiltration, PGE2 serum levels, and tumor growth rate. Following calibration to CT26 tumor values, these 3 markers allowed for successful prediction of TGI of 3 other syngeneic tumors in mice. The model also allowed exploration of TGI resulting from different doses of E7046 and its combination with a mouse PD-1 checkpoint inhibitor.
Conclusions: To our knowledge this is the first effort to build a systematic and quantitative system for a small molecule immunomodulator in immuno-oncology, which can be further applied to discovery and evaluation of new drug combinations for clinical development.
M-048
A Population Pharmacokinetic Model of Liposomal Bupivacaine Administered as Single-Dose Nerve Block in Patients Undergoing Various Surgical Procedures
Ekaterina Gibiansky,1 Neal M. Davies2
1QuantPharm LLC, North Potomac, MD, USA; 2Faculty of Pharmacy, University of Alberta, Edmonton, AB, Canada
Objective: Liposomal bupivacaine (LB; EXPAREL®, bupivacaine liposome injectable suspension) is a long-acting formulation of the local anesthetic bupivacaine. The objective was to develop a population pharmacokinetic (PPK) model for plasma bupivacaine from LB administered as single-dose nerve block (NB) for different surgical procedures.
Methods: Plasma bupivacaine concentrations, determined from 4020 blood samples in 464 patients enrolled in 6 clinical trials of LB as NB (dose range = 67 − 310 mg), were analyzed via mixed-effects modeling using NONMEM®. Objective function values, diagnostic plots, and visual predictive procedures were used for model selection and evaluation.
Results: A linear 2-compartment model described bupivacaine concentrations. Observed double peaks and differences between procedures in concentration–time curves were described by 2 parallel absorption processes: fast first-order absorption and slow process with time-dependent input.1 Up to 12% was predicted to be absorbed fast, with mean early peaks (Cmax,Early) < 200 ng/mL (LB 133 mg) occurring within 1 h for all procedures except intercostal NB for posterolateral thoracotomy (27% absorbed fast; Cmax,Early = 330 ng/mL). Median Cmax,Late (at 32 − 42 h) was < 200 ng/mL (LB 133 mg) for all procedures except femoral NB for total knee arthroplasty (Cmax,Late = 231 − 296 ng/mL; 68–75 h postdose). Cmax,Late was predicted to occur 5 − 6 h later for the 266-mg dose; other PK exposure parameters were approximately dose proportional. Cmax,Late was higher in older and female patients because of lower clearance. Cmax,Early increased with decreasing body weight (because of lower central volume) and body mass index (because of higher fraction and rate constant of fast absorption). Mild or moderate renal impairment, mild hepatic impairment, or African-American race did not influence PK.
Conclusions: The 2-compartment PPK model with fast first-order absorption and slow-time dependent absorption adequately describes LB administered as a single-dose NB for different surgical procedures.
Funded by Pacira Pharmaceuticals, Inc.
Reference
-
1.
Gaudreault F, et al. J Pharmacokinet Pharmacodyn. 2012;39(6):635–642.
M-049
Modeling resistance development to Bevacizumab in xenograft experiments by coupling hypoxia-mediated mechanism and a Dynamic Energy Budget (DEB) based tumor-in-host model.
Elena Maria Tosca1, Maurizio Rocchetti2, Enrico Pesenti3, Paolo Magni1
1Department of Electrical, Computer and Biomedical Engineering, University of Pavia, via Ferrata 5, Pavia, I-27100, Italy; 2Consultant, Milano, Italy; 3Accelera srl, Nerviano (MI), Italy
Objectives: Mechanisms of progressive resistance to Bevacizumab, an anti-VEGF antibody approved for cancer treatment, has been described in both preclinical and clinical settings: hypoxia, induced by prolonged anti-angiogenic treatment, could lead to VEGF-independent tumor revascularization through up-regulation of other pro-angiogenic factors [1]. Here, the tumor-in-host DEB-based TGI model [3] was used to study the resistance to Bevacizumab observed in xenograft experiments.
Methods: Bevacizumab treatments of different durations were tested on Du-145 xenograft models. Tumor and mice body weight data were analyzed through the DEB-TGI anti-angiogenic model [2,3].
Results: Experimental data showed that doubling the length of Bevacizumab treatment (from 20 mg/Kg q4dx3 to q4dx6) didn’t result into a greater tumor growth inhibition (Figure 1). DEB-TGI model [3] was simultaneously identified (in Monolix) on tumor and mice body weight data of all the experiments, considering different drug-related parameters for each administration protocol. The estimated average Bevacizumab potency decreases with the increasing of therapy duration. Therefore, the decrease of Bevacizumab efficacy, possible due to up-regulation of others pro-angiogenic factors, was modeled by introducing an inhibition of Bevacizumab maximum effect (Emax) through an indirect hypoxia-related parameter. The modified model was able to fit with the same set of parameters all the experimental data.
Conclusions: The hypoxia-mediated resistance model allowed to describe lack of efficacy of prolonged Bevacizumab treatments in xenograft model, making the DEB-TGI anti-angiogenic model [3] a useful investigation tool.

Fig. 1 Du-145 xenograft model experimental data
References
-
1.
G. Bergers et al., Modes of Resistance to Anti-Angiogenic Therapy. Nat Rev Cancer(2008).
-
2.
N. Terranova et al., Modeling tumor growth inhibition and toxicity outcome after administration of anticancer agents in xenograft mice: A Dynamic Energy Budget (DEB) approach, J Theor Biol.(2018).
-
3.
E.M. Tosca et al., A PK/PD model for tumor-in-host growth kinetics following administration of an antiangiogenic agent given alone or in combination regimens. PAGE 26(2017).
M-050
Pharmacokinetic-Pharmacodynamic (PKPD) Modeling to Identify Predictors of Response to the Effect of Progesterone on Attenuation of Drug-Induced QT Interval Lengthening
Elena T Muensterman, PharmD1, Ahmed Nader, PhD1,2, Abdullah Assiri, PharmD1, Sara Quinney, PharmD PhD3, Brian R. Overholser, PharmD1,3, Heather A. Jaynes, MSN,1 James E. Tisdale, PharmD1,3, Kevin M. Sowinski, PharmD1,3
1College of Pharmacy, Purdue University, Indianapolis, IN; 2AbbVie, Inc, North Chicago, IL; 3School of Medicine, Indiana University, Indianapolis, IN
Objective: We have previously shown that oral progesterone administration attenuates drug-induced QT interval lengthening. Our objective was to develop a PKPD model to identify predictors of response to the effects of progesterone on drug-induced QTc interval lengthening.
Methods: Healthy female volunteers (n = 15) were enrolled in a prospective, double-blind, crossover study during which they were randomized to receive progesterone 400 mg or matching placebo orally once daily for 7 days during the menses phase. On day 7, a subtherapeutic dose (0.003 mg/kg) of the QT interval lengthening drug ibutilide was infused over 10 min, after which blood samples for serum ibutilide concentrations and triplicate ECGs were collected serially for 12 h. ΔΔ-correction was applied to account for baseline and diurnal variation in QT interval. A population PKPD model was developed in NONMEM by linking calculated ΔΔ-Fridericia-corrected QT (QTcF) intervals to ibutilide serum concentrations. Linear and Emax pharmacodynamic models (with and without effect compartment) were evaluated using standard criteria (OFV, GOF plots, precision of parameter estimates). Demographic and clinical data [including progesterone/estradiol (P/E) serum concentration ratio] were evaluated as potential covariates.
Results: A 2-compartment model with elimination from the central compartment best fit the observed ibutilide serum concentration profiles. An Emax model most appropriately described the ibutilide serum concentration-ΔΔQTcF relationship. Precision of population PKPD estimates was confirmed by high level of agreement between final model parameters and median parameters estimated by 500 bootstrap replications. The only significant covariate was P/E on Emax (OFV drop = 4.78; P < 0.05) (Table 1).
Conclusion: Higher P/E serum concentration ratios following oral progesterone administration are associated with greater progesterone-mediated reduction in maximal ibutilide-induced QT interval lengthening. This model will be used to simulate which P/E values associated with greatest attenuation of drug-induced QT interval lengthening.
Table 1 Summary of primary population PKPD parameters
Parameter | Population estimate | RSE (%) |
|---|---|---|
CLs (L/hr) | 307 | 14.2 |
Vc (L) | 109 | 22.8 |
Q (L/hr) | 1040 | 21.3 |
Vd (L) | 1550 | 14.5 |
Emax (msec) | 69.2 | 12.0 |
EC50 (ng/mL) | 0.037 | 21.8 |
Progesterone/Estradiol Ratio on Emax | −0.03 | 56.2 |
IIV on Emax | 0.05 | 57.6 |
IIV on EC50 | 0.27 | 105.6 |
M-051
Assessment of Three-Drug Combination Pharmacodynamic Interactions in Pancreatic Cancer Cells
Emilie A. G. Molins1 and William J. Jusko1
1Department of Pharmaceutical Sciences, School of Pharmacy and Pharmaceutical Sciences, University at Buffalo, State University of New York, Buffalo, NY 14214, USA.
Objectives: The objective of the study is to determine if adding trifluoperazine (TFP) to the standard of care therapeutic drugs for pancreatic cancer offers any promise towards improving efficacy in an in vitro cell model. The pharmacodynamic interactions among TFP, gemcitabine (GEM) and paclitaxel (PTX) were assessed in pancreatic cancer cells (PANC-1). The phenothiazine TFP was chosen for its potential activity on cancer stem cells (CSC) (1).
Methods: Effects of each drug alone and in combinations on cell growth inhibition were studied in vitro to determine the drug-specific parameters and assess the nature of drug interactions. Joint inhibition (JI) and competitive inhibition (CI) equations were applied with a ψ interaction term (2, 3).
Results: TFP fully inhibited growth of cells (Imax = 1) with an IC 50 = 9887 nM. Near-maximum inhibition was achieved for GEM (Imax = 0.825) and PTX (Imax = 0.844) with an IC 50 = 17.4 nM for GEM and IC 50 = 7.08 nM for PTX. Estimates of ψ revealed that combination of TFP-GEM was synergistic, close to additive and TFP-PTX was antagonistic. The interaction of GEM-PTX was additive and TFP-GEM-PTX was synergistic, close to additive. The combination of \( {\text{TFP }}IC_{60 } - {\text{GEM }}IC_{60} - {\text{PTX }}IC_{60} \) seemed optimal in producing inhibition (inhibitory effect: 82.1–90.2%).
Conclusions: The CI and JI interaction equations do not always agree, but use of ψ allows assessment of further interactions for 2 or 3 drugs. These results indicate reasonable potential for therapeutic benefit for this 3-drug combination. Assessing impacts of each drug on CSC, cell cycling and the apoptosis pathway are needed to provide better understanding of mechanisms of action of this 3-drug combination.
References
-
1.
Yeh CT, et al. Am J Respir Crit Care Med. 2012;186(11):1180–8.
-
2.
Koch G, et al. J Pharmacokinet Pharmacodyn. 2016;43(5):461–79.
-
3.
Earp J, et al. J Pharmacokinet Pharmacodyn. 2004;31(5):345–80.
M-052
Population pharmacokinetics of 1.5 mg levonorgestrel in obesity: Comparison of compartmental and minimal PBPK (mPBPK) models
Emilie AG Molinsa, Toshimichi Nakamuraa,b, Melissa Natavioc, Frank Z Stanczykc, William J Juskoa
aDepartment of Pharmaceutical Sciences, State University of New York at Buffalo, Buffalo NY 14214; bDMPK Research Department, Teijin Pharma Limited, Hino, Tokyo, 191–8512, Japan; cDepartment of Obstetrics and Gynecology, Keck School of Medicine, University of Southern California, Los Angeles, CA, 90033
Objectives: The purposes of this study were to assess the pharmacokinetics (PK) of 1.5 mg levonorgestrel (LNG) in normal to extremely obese women and to compare key PK and mPBPK parameters.
Methods: Traditional and mPBPK population models with zero-order absorption (k0) and with or without covariates were implemented using NONMEM. The mPBPK model utilized literature-based estimates for cardiac output (CO), fractional blood flow to adipose, skin and muscle (fd), and plasma (Vp) and tissue (BW–Vp) spaces in connection with expected changes in obesity leaving only absorption rate (ko), CL, and the tissue/plasma partition coefficients (Kp) to be estimated from the data.
Results: Polyexponential plasma concentration versus time profiles of total LNG showed smaller maximum (Cmax) and AUC values and longer half-lives in overweight women. Both the 2CM and mPBPK models fitted the PK profiles well, although the AIC was higher with the mPBPK model. Both models yielded similar values of CL (r2 = 0.99 and 1.0 for the traditional models), ko was slightly smaller for the mPBPK (r2 = 0.89 and 0.88). The 2CM Vss corresponded well to the sum of Kpi × Volume compartments of the mPBPK model with a linear relationship. The 2CM CLD corresponded quite well to fd of adipose/skin × CO for the mPBPK model with a linear relationship. The mPBPK Kp value of 7.3 for adipose and skin was similar to measured fat/plasma concentration ratios found for LNG in women.
Conclusions: The mPBPK model provided good fittings of LNG PK in relation to obesity without the need for covariates. Key parameters for the 2CM and mPBPK models can be interrelated based on physiological PK principles. This study demonstrates the ability of mPBPK models to take into account known changes in altered physiology that occur in obesity.

Figure Relationships between traditional 2CM and mPBPK parameters
M-053
Model-Informed Design of Comparative Dose Ranging Studies Using Exposure–Response Analyses and Monte Carlo Mapped Power (MCMP)
Eric Haseltine1 and Ulf Bredberg1
1Vertex Pharmaceuticals Incorporated, Boston, MA, United States
Objectives: Consider the scenario whereby two compounds (A and B) are characterized using dose-ranging studies with the intention of advancing only the most efficacious compound further. To inform compound selection, it was desired to design these studies to adequately power for detection of a meaningful treatment difference between the compounds using exposure–response analyses.
Methods: Instead of estimating and comparing Emax-model parameters for both compounds, models were re-parameterized to estimate the effect of compound A and the treatment difference (□) between compounds A and B at the median exposures for the considered doses (see Figure). Monte Carlo mapped power (MCMP; Vong et al. AAPS J (2012) 14: 176–86) was employed to determine the sample size required to detect the desired treatment difference with 80% power when jointly estimating the exposure–response relationships for both compounds. The effect of different designs (parallel versus cross-over dosing groups) on the required sample size was investigated assuming a direct-effect exposure–response relationship.
Results: For the investigated model, designs incorporating more cross-over elements were shown to improve the ability to detect the desired treatment difference. Designs incorporating more cross-overs between different dose groups required up to ~ 2-fold smaller sample size than designs with only parallel dose groups. Designs incorporating cross-overs between compounds required up to ~ 3-fold smaller sample size than designs without these elements. All designs had improved power compared to a conventional pairwise comparison at the selected doses.
Conclusions: Design of dose–response studies for two compounds was performed to inform compound selection using exposure–response analyses. Re-parameterizing the compound Emax-model parameters permitted use of MCMP to analyze the power of different designs. Designs with more cross-over elements required smaller sample sizes to differentiate the compounds, and all designs outperformed conventional pairwise comparisons. These results highlight how integrating exposure–response analyses with MCMP can inform study design and ultimately facilitate decision making.

M-054
An alternative formulation for indirect-response modeling
Rudy Gunawan1*, Thang Ho1*, and Eric Haseltine1
1Vertex Pharmaceuticals Incorporated, Boston, MA, United States
*Contributed equally to this work.
Objectives: Indirect-response (IR) models are typically written as a differential equation describing the response R (Dayneka et al. J PKPD (1993) 21: 451–78). These models (1) conflate the steady-state and dynamic components of the response, which can make their development challenging, and (2) make assumptions that may limit their utility. A framework which splits the response into the steady-state and dynamic components offers an attractive way for addressing both of these issues.
Methods: (1) The four traditional IR models were reformulated into steady-state and dynamic components. Simulations were performed to compare the traditional IR models and the proposed framework.
(2) The steady-state relationship between the baseline response (R0) and the change from baseline response (R-R0) was determined and compared to common direct-effect models. Simulations were performed to illustrate the flexibility of the proposed framework.
Results: It is shown that traditional IR models can be expressed in the proposed framework. Simulation results demonstrate the equivalence of these two methods even when the drug concentration varies over the dosing interval. For traditional IR models, R-R0 is proportional to R0 at steady state, which is an assumption not made by other common direct-effect models (see the figure below; lines illustrate a range of possible relationships). Further simulations demonstrate how, for the proposed framework, dynamics can be added to direct-effect models with the addition of a single parameter, thereby maintaining the steady-state relationship of the direct-effect model.
Conclusions: Splitting the response into the steady-state and dynamic components offers an attractive framework for IR modeling. In this framework, the modeler can divide and conquer by fitting first the steady-state data, then the data with dynamics. Only a single parameter is needed to add dynamic components to common direct-effect models while maintaining the steady-state behavior of those models.
Sponsored by Vertex Pharmaceuticals Incorporated.

M-055
An exposure–response (ER) model relating nicotine plasma concentration to momentary craving across different nicotine replacement therapy (NRT) formulations
Eva Germovsek (1), Anna Hansson (2), Maria C Kjellsson (1), Juan Jose Perez Ruixo (3), Åke Westin (2), Paul A Soons (3), An Vermeulen (3), Mats O Karlsson (1)
(1) Department of Pharmaceutical Biosciences, Uppsala University, Uppsala, Sweden; (2) McNeil AB, Helsingborg, Sweden; (3) Janssen R&D, a division of Janssen Pharmaceutica NV, Beerse, Belgium
Objectives: Tobacco use causes > 7 million avoidable deaths yearly [1]. NRT medications can facilitate smoking cessation [2]. Our aim was to investigate and quantify the relationship between nicotine plasma concentration and momentary craving. Since craving was assessed using two different scales (i.e., a 4-category scale, and a 100 mm visual-analogue scale (VAS)), we also aimed to link the results from both scales.
Methods: Data, collected in 17 studies, included four NRT formulations: mouth spray, lozenge, gum and patch. Subjects were instructed not to smoke. Individual nicotine plasma concentrations (simulated from existing population pharmacokinetic models) were related to craving. To link observations from both craving scales, a joint model was developed based on a bounded integer model concept [3,4], where a probit-based model provides the probability of each observation for the VAS scores, and the probabilities for the 4-category scale scores were estimated as VAS cutoffs. NONMEM 7.3 with the Laplace approximation was used.
Results: The data included 1077 adult subjects smoking median (range) 20 (5–50) cigarettes/day for 12 (1–45) years. The subjects provided 40347 momentary craving observations, 25,922 measured with the VAS. The best description of the data was achieved using an Emax model with tolerance, included as a stepwise time-dependent C50 (Table 1). Furthermore, scaled predicted released amount of nicotine in the mouth, significantly improved the fit when incorporated in the ER model (Table 1).
Conclusions: An Emax ER model was developed and related nicotine plasma concentrations to momentary craving. A new methodology, the bounded integer model, was for the first time applied to link observations from two distinct pharmacodynamic scales. Future work will include testing covariates, and investigating other ways of including tolerance.
Disclosures: EG, MCK and MOK declare no conflicts of interest; AH, JJPR, ÅW, PS and AV are (former) employees of subsidiary companies of Johnson & Johnson.
Table 1 Model parameter estimates with uncertainty
Parameter estimatea | |
|---|---|
Emax | 3.32 (2%) |
C50_(0–1h) | 4.42 (8%) |
C50_(>1–2h) | 6.99 (8%) |
C50_(>2–4h) | 10.5 (9%) |
C50_(>4–8h) | 16.9 (10%) |
C50_(>8h) | 14.4 (11%) |
Effectmouth | 3.72 (5%) |
Baseline | 87 (2%) |
IIV (baseline) | 0.664 (3%) |
SD | 0.705 (1%) |
Cutoff between scores 1 and 2b | 32 (7%) |
Cutoff between scores 2 and 3b | 71 (3%) |
Cutoff between scores 3 and 4b | 94 (1%) |
References
-
1.
WHO report on the global tobacco epidemic, 2017.
-
2.
Benowitz, ClinPharmacolTher, 2008. 83(4):531–41.
-
3.
Karlsson&Wellhagen,PAGANZ2018 (https://www.paganz.org/abstracts/a-bounded-integer-model-for-rating-and-composite-scale-data/).
-
4.
Wellhagen&Karlsson, PAGE27 (2018) Abstract8743 [www.page-meeting.org/?abstract=8743].
M-056
Towards an understanding for hERG IC50s derived from patch clamp and binding protocols
Evan B. Wang1, Matthew M. Abernathy1, Derek J. Leishman1
1Eli Lilly and Company, Indianapolis, IN
Objectives: A multitude of different hERG potassium channel assays are available for early identification of cardiac repolarization risk. However, observed IC50 s derived from different assays and even different voltage protocols within the same patch-clamp assay can be dramatically different, resulting in very different interpretations of the risk for QT prolongation. The goal of this work is to better understand how protocol/assay characteristics and the intrinsic binding kinetics of the molecule contribute to the calculated IC50 s.
Methods: A simulation-based approach allows voltage protocols mirroring various experimental patch clamp and binding assays to be applied. A Markov model of drug binding to the hERG potassium channel [1] was used to represent the dynamics of the channel as a function of voltage, temperature, and drug concentration. For each set of drug association/disassociation rates and voltage protocol, simulations were run at different doses in order to calculate an IC50.
Results: Simulations show that both the assay and the binding kinetics of the molecule have a major impact on the calculated hERG IC50. In general, protocols mirroring binding assays are much more insensitive to kinetics compared to patch clamp protocols, although the variability of the IC50 from patch clamp tends to decrease with faster binding kinetics. Additionally, the simulated patch clamp protocols tend to produce a more potent measure of hERG inhibition than binding assays, although this difference is reduced with slower binding kinetics.
Conclusions: In assessing the risk for QT prolongation, a molecule’s hERG IC50 value should be interpreted in the context of its binding kinetics and the assay used to obtain that value.
Reference
Windley et al. Molecular Pharmacology, 2016, 90:1–11.
M-057
Impact of free fatty acids on prediction of unbound fraction of cefazolin and diazepam in plasma of full-term neonates
Farzaneh Salem1, Khaled Abduljalil1, Anne Smits2, Karel Allegaert3,4,5, Trevor N Johnson1
Simcyp, Sheffield, UK 2 Neonatal Intensive Care Unit, University Hospitals Leuven, Leuven, Belgium 3 Division of Neonatology, Erasmus MC-Sophia Children’s Hospital, Rotterdam, The Netherlands 4 Intensive Care and Department of Pediatric Surgery, Erasmus MC-Sophia Children’s Hospital, Rotterdam, The Netherlands 5 Department of Development and Regeneration, KU Leuven, Leuven, Belgium
Objective: To investigate the impact of age-related changes in free fatty acid (FFA) concentration on unbound fraction of cefazolin and diazepam in plasma (fu) of full-term neonates.
Methods: Values of cefazolin and diazepam fu in full-term neonates were extracted from the literature [1, 2]. An ontogeny function was developed for FFA based on reported data [2]. Albumin concentration in neonates was predicted using Simcyp Paediatric Simulator V17 as described previously [3] and divided by an empirical correction factor based on FFA ontogeny to reflect the available albumin for binding to drugs assuming one to one binding. The fu values were predicted [4] for cefazolin and diazepam and compared with reported values in vivo using t-test.
Results: The ontogeny function for FFA was 2-fold higher at birth and reduced to reach adult levels within a week. The values of fu showed a decrease with age in the first few days after birth for both drugs. The mean predicted vs. observed fu values in all neonates for cefazolin (subjects = 70) and diazepam (samples = 83) in presence of FFA effect were 0.338 vs. 0.389 and 0.043 vs. 0.037, respectively. The corresponding values without FFA effect were 0.305 and 0.031 for cefazolin and diazepam, respectively.
Conclusion: Accounting for FFA level led to improved predictions of fu. Since fu is an important parameter in physiologically based pharmacokinetic models, further investigation is required to describe the competitive non-specific binding of FFA to albumin to improve fu predictions of drugs in neonates.
References
-
1.
Smits, A., et al., Eur J Clin Microbiol Infect Dis, 2012. 31(12): p. 3359–65.
-
2.
Nau, H., et al., Pediatr Pharmacol (New York), 1983. 3(3–4): p. 219–27.
-
3.
Johnson, T.N., et al., Clin Pharmacokinet, 2006. 45(9): p. 931–56.
-
4.
McNamara, P.J. and J. Alcorn, AAPS PharmSci, 2002. 4(1): p. E4.
M-058
Quantitative Systems Pharmacology Models Predict Optimal Drug Properties and Inform Translation from Mice to Human in Retinal Degenerative Disease
Zhen Lou1, Carissa L Young2, Fei Hua2, Anneli Savinainen1, Joshua Apgar2, John Burke2, Devin Welty1,
1Shire, Lexington, MA, USA 2Applied BioMath, LLC, Concord, MA, USA
Objectives: Autosomal Dominant Retinitis Pigmentosa (adRP) is a rare genetic disorder of the eye. Progressive vision loss in adRP is due to misfolded opsin that fails to traffic to the outer segment (OS) of rod photoreceptor cells, aggregates within the cell body (CB), and leads to cell death. A promising therapeutic is a synthetic chaperone that binds mutant opsin thereby stabilizing it to decrease CB aggregate formation and improve trafficking to the OS. A quantitative systems pharmacology (QSP) model of opsin dynamics in rod cells was developed to investigate optimal drug properties of synthetic chaperone molecules and to enable mouse to human translation.
Methods: QSP models were developed for wildtype opsin and P23H mutant in mouse. The model integrated preclinical PK data and drug binding to opsin, day-night cycle synthesis of opsin, opsin trafficking from the CB to the OS, and competitive binding to 11-cis-retinal. The mouse model was then mechanistically translated to human based on species differences in eye physiology, opsin biology, drug binding Kd, and PK.
Results: The developed mouse QSP model predicted that a very high dose (up to 200 mg/kg BID) of the current drug candidate is not able to reduce opsin aggregate in mice, which is supported by the lack of observed in vivo effects. The human QSP model predicted that the same dosing regimen is more effective in human due to lower target burden and longer drug exposure. Finally, the model predicted that either increasing drug Kd or prolonging drug half-life could lead to > 100 × decrease of the dose level required to achieve 50% opsin aggregate.
Conclusions: QSP models of opsin dynamics for adRP explained the lack of in vivo efficacy observed for the current drug candidate, predicted dose difference between mouse and human, and suggested possible strategies for backup molecules.
M-059
Survival Prolongation Index as a Novel Metric to Assess Anti-Tumor Activity in Xenograft Models
Fiona Chandra, Lihi Zaks, Andy Zhu
Takeda Pharmaceuticals, Cambridge, MA, USA
Objectives: A single metric quantifying anti-tumor activity in xenograft models is useful in evaluating tumor’s drug sensitivity, dose–response relationship of an anti-tumor agent and the relative efficacy of different anti-tumor agents. Commonly used metrics, including Tumor Growth Inhibition (TGI) and Growth Rate Inhibition (GRI), are not well suited for biologics with long half-lives and delayed response. We propose a new metric, Survival Prolongation Index (SPI), as a novel metric to quantify anti-tumor activity in xenograft models.
Methods: SPI is calculated as the time for treated tumor volume to reach a certain size (600 mm3) divided by the time for control tumor to reach that size. Xenograft tumor volume after a treatment was simulated using a Simeoni model with four transit compartments. We analyzed the SPI for simulated tumor volume with linear and nonlinear growth rate as well as linear or nonlinear kill function. There were three different scenarios tested: 1) linear growth rate with linear kill function, 2) nonlinear growth rate, and 3) nonlinear kill function. We also analyzed the correlation between predicted human SPI and clinical response rates of 12 drug/target indications.
Results: For exponentially growing tumor with linear kill function, SPI is completely linear with kill rate/potency and is independent of growth rate. For other cases, SPI still provides the most dynamic range and growth-rate independent metric compared to GRI or TGI. Analysis of drugs with clinical data suggests that a predicted SPI of 2 is necessary for clinical response.
Conclusions: SPI is shown to have a large dynamic range with respect to drug potency and in certain scenarios is completely independent of tumor growth rate and response delays. This analysis suggested that SPI is a more useful and relevant metric for analyzing efficacy of biologics and immuno-oncology drugs.
M-060
Characterization of Transport Dynamics Following the Hypertonic Treatment of Cystic Fibrosis Nasal Epithelial Cell Cultures, a Quantitative Systems Pharmacology Approach
Florencio Serrano Castillo1, Timothy E. Corcoran1,2, Carol A. Bertrand3, Monica E. Shapiro1, Robert S. Parker1
1Department of Chemical and Petroleum Engineering, Swanson School of Engineering, University of Pittsburgh, Pittsburgh, PA, USA; 2Division of Pulmonary, Allergy, and Critical Care Medicine, School of Medicine, University of Pittsburgh, Pittsburgh, PA, USA; 3 Department of Pediatrics, School of Medicine, University of Pittsburgh, Pittsburgh, PA, USA.
Objectives: Cystic Fibrosis (CF) is caused by the functional loss of CFTR, an anion channel located in the apical membrane of epithelial cells. CF is characterized by defective ion and water transport leading to airway surface liquid (ASL) dehydration. Hypertonic saline (HS) is an accessible treatment for CF to rehydrate the ASL. We aim to elucidate transport mechanism physiology following HS treatment in cell cultures harvested from donors with and without CF.
Methods: We developed a QSP model that describes ion and water transport dynamics in the airway. The model was informed with data for the ASL volume and the paracellular transport rates of a surrogate tracer (DTPA) obtained from human nasal epithelial (HNE) cell cultures (n = 11 non-CF; n = 5 CF) treated with isosmotic Ringers or HS over 24 h. Parameter estimation was performed using Markov Chain Monte Carlo optimization under enforced physiological constraints.
Results: CF cultures showed higher transcellular and paracellular absorption rates than non-CF HNEs under basal conditions (p < 0.01). DTPA absorption rates are decreased immediately following HS for both groups (p < 0.05), but non-CF cultures are more sensitive than CF ones as measured by changes in apical DTPA retention (p < 0.05). Simulations suggest both CF and non-CF HNEs favor paracellular secretion at early time points (t < 12 h) following HS treatment (p < 0.05). An insignificant (p < 0.08) increase in transcellular flux, compared to baseline, was observed at later time points. This observation is supported by a predicted decreased in the ratio of convective to diffusive paracellular ion flux in CF samples treated with HS for 24 h.
Conclusions: HS treatment appears to induce a biphasic behavior in the two main pathways for transepithelial water transport, particularly in CF HNEs. Further exploration of these predicted dynamics may facilitate identification of dosing regimens optimal for hydration maintenance in the CF airways.
M-061
Robust designs accounting for model uncertainty in longitudinal studies with binary outcomes
Jérémy Seurat, Thu Thuy Nguyen and France Mentré
IAME, INSERM, UMR 1137, University Paris Diderot, Paris, France
Objectives: To optimize designs for longitudinal studies analyzed by mixed-effect models, the Fisher information matrix (FIM) can be used. A method evaluating the FIM, based on Monte-Carlo and Hamiltonian Monte-Carlo (MC/HMC), was proposed [1]. Optimal design approaches however require a priori knowledge of the model. We aimed to: i) propose a robust design approach to account for model uncertainty ii) illustrate/evaluate this method when designing a trial with binary outcomes in two treatment groups, assuming longitudinal logistic models.
Methods: First, to optimize designs given one predefined model, we used the DDSoptimality -[2] based on the FIM evaluated by MC/HMC, ensuring a compromise between the Wald test power to detect a treatment effect and the overall precision of parameter estimation. Then, to account for model uncertainty, we assumed a set of candidate models with their respective weights. We computed a robust design across these models using compound DDS-optimality [2]. Using the FIM for a given design, we also predicted the average power over these models. We finally evaluated the performance of the robust design by clinical trial simulations.
Results: The robust design was different than the one optimized for each model. Model misspecification led to designs with D-efficiencies as low as 64.6%. The robust design showed D-efficiencies always above 80% for all models. With the robust design, we predicted 274 subjects needed to achieve an average power of 90% over the candidate models vs. 358 with an equispaced (non-optimized) design. The simulation study confirmed that the robust design is more informative, performing better than other designs.
Conclusions: The proposed design strategy based on MC/HMC and compound optimality theory is a relevant approach. It can be used to efficiently design longitudinal studies, accounting for model uncertainty.
References
-
1.
Riviere et al., Biostatistics, 2016;17:737–50.
-
2.
Atkinson AC, Bogacka B, Technometrics, 1997;39:347–56.
M-062
Development and Evaluation of New Model-Based Bioequivalence Statistical Approaches for Pharmacokinetic Studies with Sparse Sampling
Florence Loingeville* (1), Kathrin Moellenhoff * (2), Thu Thuy Nguyen (1), Julie Bertrand (1), France Mentré (1), Holger Dette (2), Hyewon Kim (3), Sun Guoying (4), Zhichuan Li (3), Stella Grosser (4), Liang Zhao (3) and Lanyan (Lucy) Fang (3)
(1) INSERM, IAME, UMR 1137, F-75018 Paris, France (2) Department of Mathematics, Ruhr-Universität Bochum, Germany (3) Office of Research and Standards, Office of Generic Drugs, Center for Drug Evaluation and Research, Food and Drug Administration, 10903 New Hampshire Ave Silver Spring MD 20993, USA (4) Office of Biostatistics, Office of Translational Sciences, Center for Drug Evaluation and Research, Food and Drug Administration, 10903 New Hampshire Ave Silver Spring MD 20993, USA
*Co-first authors
Objectives: In traditional bioequivalence (BE) analysis, two one-sided tests (TOST) are conducted on AUC and Cmax generally derived from dense pharmacokinetics (PK) sampling, which is not always feasible. Our previous work [1] on model-based (MB) bioequivalence (MBBE) approaches showed that the approach can induce type I error inflation on PK studies with sparse sampling. Here we evaluate, through simulations, three alternative MBBE approaches on parallel designs.
Methods: We tested: Methods I) a MB TOST using standard errors (SE) derived from parametric bootstrap method; II) a MB TOST using a confidence interval from the posteriori distribution of the treatment effects β sampled by Hamiltonian Monte Carlo (HMC); and III) a MB parametric bootstrap test following a constrained fit of the two treatment groups separately [2]. All approaches were evaluated by clinical trial simulation in scenarios with rich/sparse designs and high/low between subject variability (BSV) using saemix R package.
Results: On low BSV (≤ 30%), all alternatives corrected the type I error inflation of the MB TOST with Fisher Information Matrix (FIM) based SE on sparse designs. On high BSV (> 30%), both MB TOST approaches (Methods I and II) and the non-compartmental analysis (NCA) TOST obtained very low type I error estimates on both rich (I = 0.004, II = 0.002, NCA TOST = 0.022 for βAUC) and sparse (I = 0.006, II = 0.002 for βAUC) designs. Only Method III had closer estimates (rich = 0.056, sparse = 0.044 for βAUC).
Conclusions: For products with high BSV (CV > 30%) on PK parameters, method III (compared to TOST-based Methods I and II) appears to have closer type I error estimates to the conventionally accepted significant level of 0.05, suggesting its potential use in situation where conventional BE analysis is not applicable.
References
-
1.
Dubois et al. (2011). Stat Med, 30, 2582–2600.
-
2.
Dette et al. (2017). JASA, in press. https://doi.org/10.1080/01621459.2017.1281813
M-063
An advanced approach to compute the optimal dosing regimen with a PKPD model using optimal control theory
Freya Bachmann1, Marc Pfister2, Johannes Schropp1
(1) Department of Mathematics and Statistics, University of Konstanz, Germany (2) Pediatric Pharmacology and Pharmacometrics, University of Basel, Children’s Hospital (UKBB), Basel, Switzerland
Objectives: First, develop a robust method to solve an optimal control problem (OCP) that provides the optimal dosing regimen based on a PKPD model. Second, verify and validate the method by applying it to substantially different PKPD models and various routes of administrations.
Methods: An objective function quantifying the difference between a desired disease state and the actual state generated by a certain treatment is minimized. The standard approach to solve OCPs is to set up the corresponding Hamiltonian function and apply Pontryagin’s maximum principle. However, drug administration at certain time points gives a finite number of discrete controls, the drug doses, determining the drug concentration and its effect on the disease state. Consequently, rewriting the objective function gives a finite-dimensional OCP depending only on the doses. With Karush–Kuhn–Tucker theory (cf. [1]) the adjoint state and the gradient of the objective are computed. This technique admits to apply sophisticated descent methods from finite-dimensional optimization theory to solve the OCP.
Results: We have designed a software code based on MATLAB that requires a PKPD model, a reference function describing the desired disease progression and the dosing time points. The code was validated for various PKPD problems: slow hormone level adjustment in hyperthyroidism, and tumor stasis or eradication in oncology. The solution provides an excellent approximation of the disease reference function. Due to application of descent methods equipped with exact computation of the gradient, the resulting code has globalized convergence properties and is numerically robust.
Conclusion: Optimal dosing regimens were successfully computed for a variety of PKPD models and different routes of administrations. The presented method has the potential to provide the basis for an OCP reference code in PKPD modeling and optimized, individualized dosing.
Reference
-
1.
Hinze M, Pinnau R, Ulbrich M, Ulbrich S (2009). Optimization with PDE Constraints. Springer.
M-064
A mechanistic PKPD model comparing the effect of anti-IL-13 mAbs to Dupilumab on clinical asthma efficacy endpoints
Georgi I Kapitanov1, Gregory L Weber1, Marion Kasaian2, Hannah M Jones1
1. Pharmacokinetics, Dynamics and Metabolism, BioMedicine Design, Pfizer Inc., Cambridge, MA, USA. 2. Inflammation and Immunology Research Unit, Pfizer Inc., Cambridge, MA, USA
Objectives: IL-13 has been a popular target in asthma and several anti-IL-13 antibodies have been tested in the clinic, yet none have been approved. On the contrary, Dupilumab, which targets the IL-4 receptor, hence inhibiting the function of both IL-4 and IL-13, has recently filed a submission for approval and has performed better than the anti-IL-13 mAbs in clinical studies. We wanted to explore how targeting the IL-4 pathway can result in improved efficacy in asthma.
Methods: A mechanistic PKPD model involving IL-4 and IL-13 binding interactions with IL4Ra and IL13R1a as well as downstream signaling was constructed comparing free target inhibition, effect on biomarkers, and effect on efficacy endpoints of several anti-IL-13 mAbs to Dupilumab.
Results: The model’s results suggest that targeting the IL-4 pathway in addition to IL-13 is responsible for Dupilumab’s superior efficacy results, since according to the model Dupilumab does not inhibit IL-13 activity more than its competitors.
Conclusion: The results imply that targeting both IL-4 and IL-13 can provide additional efficacy in asthma compared to targeting IL-13 alone.
M-065
Sargramostim modeling and simulation to support dose recommendation for hematopoietic syndrome of acute radiation syndrome (H-ARS) in pediatric patients from birth to 17 years of age
Yue Gao1*, Qingxiang Lin2*, Eileen Doyle1, Gary Emmons1, Vanaja Kanamaluru1, Qiang Lu1
1Sanofi, Bridgewater, NJ; 2University at Buffalo, Buffalo, NY.
*Co-first author.
Objectives: To utilize modeling and simulation in support of dose recommendation of Sargramostim (a recombinant human granulocyte macrophage colony-stimulating factor, Partner Therapeutics, Inc, Lexington, MA) in pediatric population with H-ARS under the Animal Rule1.
Methods: A previously developed sargramostim adult population pharmacokinetic (Pop PK) model (one-compartment model, first-order absorption with delay and linear elimination) was scaled for pediatric population using allometric principle (weight exponents of 0.75 and 1 for clearance and volume, respectively). Exposure simulatons by pediatric weight and age were provided to match the simulated adult exposure after a subcutaneous (SC) dose of 7 μg/kg equivalent to 250 μg/m2 (70 kg adult with 1.96 m2 body surface area) approved for other indications. The simulated pediatric exposures were compared to observed efficacious exposures in total body-irradiated non-human primates (NHPs), the H-ARS animal model. A sensitivity analysis using different clearance- weight exponents (CLWT) of 0.5, 0.75, and 1.0 was conducted.
Results: Simulated exposures at SC doses of 7, 10, and 12 μg/kg in pediatric patients > 40 kg, 15 to 40 kg, and 0 to < 15 kg, respectively, were similar to that in adults at a 7 μg/kg SC dose and exceeded the efficacious Cmax (96% of patients) and AUC (100% of patients) in NHPs, which can be expected to provide sufficient pharmacodynamic activity to treat children exposed to myelosuppressive doses of radiation. Sensitivity analysis showed minimal impact of CLWT on predicted pediatric exposure across the range of pediatric weights.
Conclusions: Model-based simulations supported the following sargramostim SC dose recommendation by body weight in pediatric patients with H-ARS under the Animal Rule: 7 μg/kg for > 40 kg, 10 μg/kg for 15 to 40 kg, and 12 μg/kg for < 15 kg.
Acknowledgements: This project has been funded with Federal funds from the Office of the Assistant Secretary for Preparedness and Response, Biomedical Advanced Research and Development Authority, under Contract No. HHSO100201300005I.
Disclosures: Eileen Doyle, Yue Gao, Gary Emmons, Vanaja Kanamaluru and Qiang Lu are employees of Sanofi and may hold stock and/or stock options in the company. Qingxiang Lin is a student at the University at Buffalo.
Reference
-
1.
21 CFR 601.90–601.95 (Subpart H): Approval of Biological Products when Human Efficacy Studies are Not Ethical or Feasible
M-066
Disease progression model for Alzheimer’s Mini Mental State Examination (MMSE)
Geraldine Ayral (1), Jonathan Chauvin (1), Pauline Traynard (1)
(1) Lixoft, Antony, France
Objectives: Progression models for Alzheimer’s disease (AD) allow to better understand predictors of progression and help to design informative clinical trials. Common scores used to follow AD progression include ADAS-cog, CDR-SB and MMSE. In the past years, several models have been proposed and used to assess the role of covariates of predictors [1]. To our knowledge, all published models consider the score as a continuous variable. In this poster, we propose a novel model for the MMSE score which captures the score as (bounded) count data and we assess the predictive power of covariates.
Method: MMSE scores were extracted from the ADNI study for 895 patients examined every 6 months over 2 years. Available covariates include age, weight, height, sex, BMI, race, baseline MMSE score and number of apolipoprotein E4 alleles (APOE). The proposed model describes the longitudinal MMSE data using a binomial distribution representing the number of correct answers to the 30 questions of the MMSE test. The probability of a correct answer was modeled as time-varying and linear, exponential, logit, Verhulst and Richard models were tested. Covariate search was performed using the COSSAC method.
Results: The use of a count model which can only take discrete integer values between 0 and 30 permits to properly grasp the nature of the MMSE score. A comparison of several typical models for the time evolution of the probability suggests that the logit is the most appropriate. Covariates APOE and the baseline MMSE appear as significant predictors of the initial level and rate of decline.
Conclusion: The proposed model properly captures the MMSE score of the ADNI study and confirms informative covariates. The model can be used to optimize study designs via clinical trial simulations, properly returning the MMSE score as a discrete outcome.

Table Selection of the base model structure
Reference
-
1.
Lorenzi et al. (2017) Neuroimage.
M-067
COSSAC (COnditional Sampling use for Stepwise Approach based on Correlation tests) method for covariate search
Jonathan Chauvin (1), Géraldine Ayral (1), Pauline Traynard (1)
1Lixoft, Antony, France
Objectives: Covariate search is a key element in the modeling process and automatic covariate search procedures have been developed. The most common is SCM [1]. It includes a forward selection, in which covariates are added one by one after evaluation of all possible additions, followed by a backward elimination. This method is effective but expensive in terms of number of runs. We propose an alternative method called COSSAC based on the individual parameter-covariate correlations observed in the current model. The method is available in the R package Rsmlx, to be used with MonolixSuite2018R1.
Methods: COSSAC makes use of the correlation between the random effects and the covariates of the current model to choose which parameter-covariate relationship to try next. To avoid biased correlations that may appear (for instance in case of shrinkage), samples from the a posteriori conditional distribution [2] are used as individual parameters instead of the EBEs. A p-value can be derived using the Pearson’s correlation test for continuous covariate and ANOVA for categorical covariate. Relationships with the lowest p-value are added first, run and confirmed using a likelihood ratio test.
Results: COSSAC was tested using MonolixSuite2018R1 and compared to the classical SCM on three examples: a dense PK data set, a sparse PK data set and a time-to-event data set. For all data sets, we obtain the same final model using SCM or COSSAC. However the total number of runs is 3 to 10 times lower using COSSAC.
Conclusions: The proposed covariate search procedure based on the Pearson’s correlation test between individual parameters randomly drawn from the conditional distribution and the covariates greatly shortens the total number of runs needed.

References
-
1.
Byon et al. (2013) CPT: Pharmacometrics & Systems Pharmacology.
-
2.
Lavielle & Ribba (2016) Pharmaceutical Research.
M-068
Representation of Crizotinib and Pazopanib-mediated Drug-Induced Liver Injury (DILI) Using Quantitative Systems Toxicology (QST)
Guncha Taneja1, Tamás Szalai2, Brett A. Howell1, Scott Q. Siler1, Jeffrey L. Woodhead1
1DILIsym Services Inc., Research Triangle Park, NC; 2Solvo Biotechnology USA, Boston, MA
Objective: Crizotinib and pazopanib (tyrosine kinase inhibitors) have been linked to liver enzyme elevations in the clinic. To understand the underlying mechanisms behind these liver signals, both compounds were represented in DILIsym®, a QST model of DILI.
Methods: Inhibitory effects of crizotinib and pazopanib on bile acid and bilirubin transporters were assessed using transporter-overexpressing vesicles and HEK293 cells. Oxidative stress and mitochondrial dysfunction due to the two compounds were assessed in HepG2 cells. In vitro data were used to define toxicity parameters for use in DILIsym. For both compounds, hepatic exposure was estimated by constructing a PBPK representation within DILIsym. Previously constructed human simulated populations (SimPops™) that incorporate variablity in the aforementioned toxicity mechanisms were utilized to determine the impact of inter-individual variability upon administration of crizotinib and pazopanib at 250 mg (BID) and 800 mg (QD), respectively, for 60 days.
Results: Crizotinib induces oxidative stress and behaves as a mild mitochondrial uncoupler. Crizotinib IC50 for BSEP, NTCP and MRP3 was determined to be 97.79 µM, 3277.71 µM and 145 µM respectively. Pazopanib, on the other hand, showed no mitochondrial toxicity but showed mild inhibition for BSEP and NTCP (IC50 value was 63.86 µM and 29.71 µM respectively). Based on the parameters derived from in vitro data for crizotinib, Human SimPops™ predicted 100% individuals had > 3x upper limit of normal (ULN) in serum ALT, slightly overpredicting the 60% observed in clinical trials. No significant increases were observed with pazopanib in human SimPops™, compared to 1–2% of individuals with ALT/bilirubin elevations in the clinic (Table 1).
Conclusion: DILIsym predicted the qualitative difference in the ability of crizotinib and pazopanib to produce DILI signals. DILIsym slightly overpredicted crizotinib hepatotoxicity in humans while underpredicting pazopanib hepatotoxicity. Crizotinib toxicity was shown to be due to oxidative stress produced by the parent drug.
Table 1 Comparison of observed vs simulated hepatotoxicity of crizotinib and pazopanib
Observed ALT > 3X ULN | Simulated ALT > 3X ULN | |
|---|---|---|
Crizotinib | 57% | 100% (285/285) |
Pazopanib | 1–2% | 0% |
M-069
Exposure–Response (E-R) Analysis to Support Benefit-Risk Assessment of Ipilimumab 3 vs 10 mg/kg in Patients with Advanced Melanoma
Heather E. Vezina, Shelly Wang, Paul Statkevich, Akintunde Bello, and Amit Roy
Bristol-Myers Squibb, Princeton, NJ, USA
Objectives: Treatment with ipilimumab 10 mg/kg every 3 weeks (Q3W) for 4 doses resulted in significantly longer overall survival (OS) than 3 mg/kg Q3W for 4 doses in a post-marketing study, although with an increased rate of treatment-related adverse events (AEs).1 E-R analyses were conducted to compare the benefit-risk of these doses.
Methods: In the phase 3 study, E-R of efficacy (OS) and safety (first occurrence of Grade 2 + immune-related AEs (Gr 2 + irAE) and AEs leading to discontinuation or death (AE-DC/D)) was characterized for subjects with available ipilimumab concentrations (N = 694). Time-averaged ipilimumab concentration after the first dose (Cavg1) was determined for each subject by applying a previously developed population PK model to the covariate values of each subject. Cox proportional hazard models described the relationship between Cavg1 and OS, time to first Gr 2 + irAE and time to AE-DC/D while simultaneously estimating effects of the following baseline covariates: body weight, LDH, clearance, age, sex, metastatic stage, prior anti-cancer therapy, and ECOG performance score.
Results: Cavg1 was not a significant predictor of OS and hazard of death was higher with older age, ECOG score of 1 versus 0, advanced metastatic stage, and faster ipilimumab baseline clearance. Hazard of Gr 2 + irAE was higher with Cavg1 and older age, and lower in males versus females. Hazard of AE-DC/D was higher with Cavg1. No covariate associated with both lower hazard of death and lower hazard of AEs was identified. There were no significant interactions between Cavg1 and identified significant covariates.
Conclusions: Significant covariate effects were identified in E-R analyses of OS and Gr 2 + irAE; however, none of these differentiated patients with longer survival and a low risk of AEs on ipilimumab 10 mg/kg Q3W for 4 doses.
Reference
Ascierto et al. Lancet Oncol 2017;18:611–22.
M-070
Paclitaxel Exposure-Neuropathy Relationship in Patients with Breast Cancer
Hechuan Wang1, Daniel L Hertz2, Kiran Vangipuram2, N. Lynn Henry3, Jogarao Gobburu1, Vijay Ivaturi1
1Center for Translational Medicine, School of Pharmacy, University of Maryland, Baltimore, MD, USA 2Department of Clinical Pharmacy, College of Pharmacy, University of Michigan, Ann Arbor, MI, USA 3Huntsman Cancer Institute, University of Utah School of Medicine, Salt Lake City, UT
Objectives: Chemotherapy-induced peripheral neuropathy (CIPN) from paclitaxel severely affects patients’ quality of life. Currently, the only effective strategy to relieve CIPN symptoms is to either reduce the dose or discontinue chemotherapy. The objective of this work was to develop an exposure-CIPN model in patients treated with paclitaxel for breast cancer.
Methods: Sixty breast cancer patients were administered 80 mg/m2 paclitaxel weekly (qw) for twelve weeks or until treatment discontinuation in a prospective, single-arm, observational study. Two plasma samples for each patient were collected after the first dose, one at the end of infusion (Cmax) and the next between 16 -26 h. CIPN20 scores were collected at baseline and the end of each week. The model was based on the assumption that for adverse events with continuous scores, patients who exhibit meaningful increase in CIPN scores contribute to exposure-driven neuropathy. Hence, we chose patients (n = 15) who had obvious CIPN worsening for this analysis as a method of conditionally assessing the exposure-CIPN relationship.
Results: A Cmax-driven indirect response model (IDR1) well described the longitudinal CIPN data in these 15 patients. For a unit change of Cmax in the population, the estimated slope of the drug effect at Cmax results in 1.49 × 10⁻⁴ and 9.56 × 10⁻⁵ units increase per day in CIPN total score and sensory score, respectively. The slopes of drug effect in remaining patients were close to zero. In addition, time above the plasma concentration (> 0.05 µmol/L) shows high correlation with final total scores (P = 0.008, N = 60). Vitamin D (< 20 ng/ml) was found to be risk factor of CIPN development.
Conclusions: In our study, for the first time, we are establishing the paclitaxel exposure-neuropathy relationship in 80 mg/m2 weekly dosing regimen. The established conditional exposure-neuropathy model could adequately describe longitudinal CIPN data.
M-071
Simulation with PBPK model-guided controller for improved therapeutic exposure of doxorubicin
Hillary R. Husband and Eric Sherer
Louisiana Tech University, Ruston, LA 71270
Objectives: To develop an adaptive model-predictive controller which, directed by a semi-PBPK model, reduces the cardiotoxic effect of doxorubicinol (DOXol), the primary metabolite of doxorubicin (DOX), while maintaining the effectiveness of DOX.
Methods: A PBPK model of DOX [1] was expanded to include multiple species and a heart compartment that captures the known myocardial toxicity of DOXol. Model parameters were fit using allometric scaling of subclinical DOX/DOXol tissue data combined with human clinical tissue data. For the adaptive model-predictive control, the DOX and DOXol concentrations in the blood are measured in real-time using a photoplysmograph [2]; the PBPK model predicts the DOXol heart concentration and DOX AUC; and the controller gathers heart concentration predictions and adjusts the infusion based on the continuous measurements model predictions to stay within a target AUC range without exceeding a maximum heart concentration. A simulated study was conducted with a control group and an intervention group that implemented the model-guided controller.
Results: The intervention group showed a 46.9% improvement in maintaining therapeutic AUC levels (control 29.0%, intervention 75.9%). The intervention group also never exceeded the preset maximum heart concentration, indicating the simulation did not allow for the concentration to reach a toxic point. The control group exceeded maximum concentration in 19.8% of simulation iterations.
Conclusions: A PBPK model coupled with the controller code has shown promise in reducing the occurrence of over-prescribing DOX. Simultaneously controlling these values through infusion manipulation will help achieve optimal therapeutic dose with minimal side effects. Tunable user-inputs and physical parameters make this system potentially versatile for broader application.
References
-
1.
Dubbelboer, et al. (2017). Mol.Pharmaceutics, 14(3):686–698.
-
2.
Michalak, et al. (2010). Optics Express, 18(25):26535–26549.
M-072
Mechanistic systems pharmacology model of adaptive immune system activation in response to anti-CD20-interferon-β fusion protein in B cell Lymphoma
Hojjat Bazzazi, Cindy Xia, and Andy Zhu
Translational Modeling and Simulation, Drug Metabolism and Pharmacokinetics, Takeda Pharmaceutical International, Cambridge, MA, USA.
Objectives: Antibodies targeting CD20 are used for the treatment of B cell lymphomas. The anti-tumor activity of anti-CD20 antibody is mediated by the innate immune system. Some patients develop resistance to anti-CD20 therapy over time. An approach to overcome resistance is to fuse anti-CD20 antibodies with interferon-α (IFNα) (anti-CD20-IFNα) as proposed by recent literature. This could bridge the innate and adaptive immune responses and result in durable response. The objective of this study was to construct a mechanistic model to describe the innate and adaptive immune system activation triggered by anti-CD20-IFNα.
Methods: The model is consisted of 1) a model for the binding of anti-CD20-IFNα to CD20 and subsequent heterodimerization of interferon receptors 1 and 2 that results in the activation of interferon-α pathway, 2) molecular kinetics of the upregulation of MHC class I and other activation molecules on tumor and dendritic cells in the tumor microenvironment, and 3) cellular kinetics of T cell priming, activation, and exhaustion.
Results: Sensitivity analyses were conducted to understand the optimal antibody affinity for maximum activation of the adaptive immune response against tumors expressing different levels of CD20 and interferon receptors. Model simulations showed that the upregulation of CD20 expression by IFNα contributed to the enhancement of T cell response in refractory low CD20 expressing tumors. The model also demonstrated the nonlinear dose response of T cell activation which may have implications of for the optimal design of dosing levels and schedule. Finally, global sensitivity analysis of the model parameters identified the most significant cell population and biological elements that may inform combinations with various checkpoint inhibitors.
Conclusions: Overall, the modeling platform developed here is capable of capturing the essential features of the adaptive immune activation and could be used to guide the design of dosing schedule and clinical strategy for targeted CD20 immune activating modalities.
M-073
Pharmacokinetic and Pharmacodynamic Model of Inhibitory Effect of LJPC-401 on Serum Iron and Liver Iron Load in Rats
Hong Jin1, Wojciech Krzyzanski2, Sima Petal1, Robin Marsden1, James Rolke1, and Andrew Seacat1
1La Jolla Pharmaceutical Company, 2University at Buffalo.
Objective: LJPC-401 is a synthetic human hepcidin drug product intended for the treatment of iron overload. A PKPD model was developed to explain the LJPC-401 mediated iron reduction in serum and liver in rats following subcutaneous (SC) injections twice weekly for three months.
Methods: A PK model for LJPC-401 consisted of one compartment with first-order absorption. The PD model comprised iron pools in serum (FeS), liver (FeL), macrophages (FeM), bone marrow (BM) hemoglobin (FeHbBM), and blood hemoglobin (FeHbB). LJPC-401 inhibited ferroportin (Fpn)-mediated iron transport from liver and macrophages. The PKPD model was calibrated using data from a three month twice weekly SC dosing rat study. The resulting model parameters were used to simulate iron content in model organs assuming unsaturated iron uptake (normal rat) or saturated iron uptake (iron overload rat) by BM. Simulations were performed by Phoenix NLME 7.0.
Results: LJPC-401 has linear PK and partially blocks the iron transport from liver and macrophages. Upon first-order uptake of iron by BM, 20 mg/kg SC dosing twice weekly for three months resulted in a decrease of iron in serum, BM, and blood, and an increase in macrophages and liver. For saturated iron uptake by BM, the same dosing regimen reduced the iron load in liver (Fig. 1). Doses at 1, 3, and 10 mg/kg showed similar PD responses with a magnitude correlated with dose.
Conclusions: LJPC-401 partially blocks transport of iron from liver and macrophages leading to the decrease in the serum iron. For unsaturated uptake of iron by BM, SC injections twice weekly for three months increase iron load in rat liver. For saturated uptake of iron by BM, this dosing regimen reduces iron load in rat liver. The PKPD model implies potential therapeutic effect of LJPC-401 on liver iron overload in subjects with impaired iron uptake by BM.

Fig. 1 Diagram representing PKPD model of LJCP-401 effect on iron turnover in serum, blood, BM, macrophages, and liver. The plots represent iron amounts in these organs predicted by the PKPD model following 20 mg/kg SC dosing twice weekly for three months with saturable bone marrow iron uptake. Horizontal lines indicate iron levels at baseline conditions.
M-074
Population Pharmacokinetic (PK) and Pharmacokinetic/Pharmacodynamic (PK/PD) Analyses to Support Olaparib Tablet Approval in Ovarian Cancer
Hongmei Xu1, Diansong Zhou1, Jianguo Li1, Alienor Berges2, Khanh Bui1, Tsveta Milenkova3, Helen Tomkinson2, Nidal Al-Huniti1, Maria Learoyd2
1Quantitative Clinical Pharmacology, Early Clinical Development, iMED Biotech Unit, AstraZeneca, Boston, MA; 2Quantitative Clinical Pharmacology, Early Clinical Development, iMED Biotech Unit, AstraZeneca, Cambridge, UK 3Global Medicine Development, AstraZeneca, Cambridge, UK
Objectives: Olaparib is a PARP inhibitor that induces synthetic lethality in tumors with deficient homologous recombination repair. The objectives of this study were 1) to develop a population PK model to determine relative bioavailability of capsule and tablet formulations for bridging Phase II all-comer capsule and Phase III gBRCAm tablet studies; 2) to perform exposure–response analyses justifying the tablet therapeutic dose.
Methods: The pooled PK dataset included 659 patients from 11 phase I/II/III clinical studies. Correlations between exposure and clinical outcomes were investigated using empirical Bayes estimates generated from the final, covariate-containing PK model. Progression free survival (PFS) and association with exposure was assessed using a Cox proportional hazard model. Logistic regression was applied for exposure–response assessments of anaemia, neutropenia, decreased appetite, headache, dysgeusia, nausea, vomiting, fatigue/asthenia and diarrhoea. An indirect response model was used to describe the relationship between exposure and haemoglobin reduction.
Results: A two-compartment model with sequential zero-first order absorption and first-order elimination adequately described olaparib PK. Multiple-dose clearance was reduced by about 15% relative to first dose (auto-inhibition). The olaparib steady-state geometric mean AUC following 300 mg tablet twice-daily was 49.0 μg*h/mL. The relative exposure (AUC) of the 300 mg tablet formulation was 13% higher than the 400 mg capsule formulation. Covariate analysis suggested a disease severity (ECOG score) association with olaparib clearance and formulation/tablet strength association with absorption rate. Exposure-PFS modelling indicated that 300 mg bd tablet was statistically superior to the 200 mg bd tablet dose, although the effect size was small. Exposure-safety models predicted a negligible difference in probabilities of different adverse event grades and haemoglobin concentrations between 200 and 300 mg bd doses.
Conclusions: The analyses provided key assessments for bridging formulations to support the approval of olaparib 300 mg tablet formulation in patients with ovarian cancer, regardless BRCA mutation status.
M-075
Personalized Medicine. Estimating the Impact of Genotypes on Antipsychotic Efficacy Using Quantitative Systems Pharmacology
Athan Spiros1, Hugo Geerts1
In Silico Biosciences, Berwyn, PA, USA
Objectives: CNS disorders are lagging behind other indications such as oncology in implementing genotype-dependent treatment algorithms for personalized medicine. This is due to the limited knowledge about the interaction of the relevant biology and the drug’s pharmacology
Methods: We applied a mechanism-based computer model of a cortico-striatal-thalamocortical loop of the dorsal motor circuit that has been calibrated with clinical data on antipsychotic treatment in schizophrenia patients (Spiros, Roberts et al. 2017). This Quantitative Systems Pharmacology (QSP) model is based on the anatomically informed connections between basal ganglia regions and consists of 220 neurons (8 different cell types), 3500 synapses and implementations of 32 CNS active targets, based on their unique cellular locations and coupling with their individual intracellular pathways. COMTVal156Met, 5-HTTLPR rs 23351 s/L and D2DRTaq1A1 genotypes are implemented using human imaging data in non-medicated human volunteers.
Results: The antipsychotic effect for risperidone, aripiprazole and paliperidone is sensitive to the D2DRTaq1A1/A1 and COMTMM genotype having the greatest improvement with the wild-type. Variability for the same drug-dose combination is of the order of 4–6 points on PANSS Total clinical scale. Olanzapine, quetiapine, clozapine and haloperidol are much less affected. The 5-HTLLPR genotype has a smaller effect for all antipsychotics. Conversely, when considering the best antipsychotic for each of the 27 individual genotype combinations, aripiprazole comes out on top (7 cases), followed by quetiapine (6 cases) and clozapine (5 cases). These effects are anticipated to be detectable in clinical settings.
Discussion: The QSP platform predicts strong and complex genotype-dependent interactions with aripiprazole, risperidone, and paliperidone and to a much smaller degree with olanzapine, quetiapine, haloperidol and clozapine. These predictions could in principle be verified in clinical setting and could lead to rational personalized treatment guidance.
M-076
Model-Based Network Meta-Analysis for Time-Course Relationships: A Union of Two Methodologies
Pedder H.1, Dias S.1, Bennetts M.2, Boucher M.2, Welton N.J.1
Population Health Sciences, University of Bristol 2. Pfizer Ltd.
Objectives: To develop a model-based meta-analysis (MBNMA) framework that allows for non-linear modelling of multi-parameter time-course functions for comparative effectiveness, which can account for residual correlation between observations using a multivariate likelihood.
Methods: In Pharmacometrics, model-based meta-analysis is used to model treatment, dose–response and time-course characteristics, synthesising results from multiple trials to inform quantitative drug development. Network meta-analysis is used in Health Technology Appraisals and by reimbursement agencies to simultaneous compare effects of multiple treatments in multiple trials. Our proposed MBNMA framework combines the strengths of both these techniques, enabling modelling of multi-parameter time-course functions whilst aggregating within-study relative effects. This preserves study randomisation and allows testing for inconsistency between direct and indirect evidence. We demonstrate our modelling framework using an illustrative dataset of 24 trials investigating treatments for pain in osteoarthritis.
Results: Of the time-course functions that we explored in our dataset, an Emax function allowed for the greatest degree of flexibility, both in the time-course shape and in the specification of time-course parameters. It also has strong biological plausibility. Our final model was a good fit to the data with different pain treatments giving varied maximum efficacy (Emax). Some simplifying assumptions were needed to identify a shared ET50 parameter (the point at which 50% maximum efficacy is achieved), as studies contained few observations at earlier follow-up times. Treatment estimates were robust to the choice of likelihood (univariate/multivariate), suggesting that accounting for residual correlation between time points may not always be essential.
Conclusions: Time-course MBNMA provides a statistically robust framework for synthesising evidence on multiple treatments at multiple time points whilst preserving randomisation and allowing for testing of inconsistency. The methods can inform drug-development decisions, and provide the rigour needed in the reimbursement decision-making process, thereby acting as a bridge between early phase clinical research and Health Technology Appraisal.
M-077
A Time to Event Analysis of the Exposure–Response Relationship for Bezlotoxumab Concentrations and CDI Recurrence
Ka Lai Yee1, Huub Jan Kleijn2, Stefan Zajic1,3, Mary Beth Dorr1, Rebecca Wrishko1
1Merck & Co., Inc, Kenilworth, NJ, USA; 2Certara Strategic Consulting, Oss, the Netherlands; 3Current Affiliation: Coriell Institute for Medical Research, Camden, NJ, USA
Objectives: Bezlotoxumab is a mAb approved for the prevention of recurrence of Clostridium difficile infection (rCDI). In a previous exposure–response (E-R) assessment for bezlotoxumab exposure and rCDI, rCDI was treated as a binary endpoint and discontinued subjects were imputed as not having rCDI. However, rCDI may occur at any time over the study period and correlations between discontinuation, patient health, and rCDI and between patient health and exposure were observed to influence the E-R relationship. A time-to-event (TTE) analysis was applied to investigate the E-R relationship, accounting for the time to rCDI occurrence and patient discontinuation.
Methods: A TTE model, applying a time-dependent hazard function and right-censoring of data based on rCDI, discontinuation, or study end was developed based on 2 Phase 3 trials with PK and rCDI data from 2559 patients administered placebo or 10 mg/kg bezlotoxumab. Exponential, Weibull, Gompertz and log-logistic functions were evaluated for the placebo hazard. Exposure effects and covariates effects (by SCM) were evaluated as predictors affecting the hazard.
Results: The TTE model consisted of a Gompertz model with age, endogenous IgG to C. difficile toxin-B, history of CDI, hospitalization, gender, Charlson comorbidity index and non-standard-of-care antibiotics affecting the hazard. Exposure effects were characterized with an Emax E-R relationship on the baseline hazard, where bezlotoxumab exposures achieved at the 10 mg/kg dose are on the plateau of the E-R curve. Endogenous IgG-B significantly impacted the Emax, indicating that low titer patients derive a greater benefit from bezlotoxumab treatment compared to high titer patients.
Conclusions: The TTE analysis accounted for time of rCDI and discontinuation without the need for imputation of the endpoint. The results support the conclusions of the previous E-R analysis, where exposures achieved at the 10 mg/kg dose are on the plateau of the E-R curve, with a similarly high response rate.
M-078
Developing a Pharmacokinetic and Pharmacodynamic Preclinical Model for SERDs and Its Translation to Predict Clinical Outcome
Vidhi Mody1, Robert Blake1, Jae Chang1, Tom DeBruyn1, Ellen Ingalla1, Ciara Metcalfe1, Xiaojing Wang1, Edward Pyszczynski2, Donald Mager2, Edna Choo1
1Genentech, Inc., South San Francisco, CA, USA; 2Enhanced Pharmacodynamics, LLC, Buffalo, NY, USA’
Objectives: Selective Estrogen Receptor Degraders (SERDs) are used for the treatment of ER + breast cancer. They inhibit tumor proliferation by antagonizing and degrading ERα. The objective is to develop a pharmacokinetic-pharmacodynamic (PKPD) model for fulvestrant (control) and three new chemical entities SERDs- A, B and C, using tumor volume from mouse xenografts, and translate the model to predict clinical outcome.
Methods: Mouse PK data of the three SERDs and fulvestrant was fitted to a one-compartment model. A cell kill model was developed using the tumor volume data from mice, bearing human HCI-013 ESR1 mutant patient-derived breast cancer xenografts. This PKPD model, along with literature reported growth rate [1] and scaling factor, was used to simulate progression free survival (PFS) curves for each compound.
Results: The one-compartment model characterized the PK of SERDs and fulvestrant. In the cell kill model, a killing constant was estimated for each compound A, B, C and fulvestrant as 1.74 uM−1day−1, 0.00168 uM−1day−1, 0.104 uM−1day−1, and 0.526 uM−1day−1, respectively. The PFS curves simulated for fulvestrant followed the trend from a reported clinical trial [2]. Rank ordering of SERDs based on the PFS curves is consistent with the invitro potency of each compound (A > C > B).
Conclusions: Fulvestrant PFS was scaled from preclinical experiments to predict clinical outcome. This provided confidence in the predictions of the three SERDs. This model could be used to predict the survival rate of SERDs at different dosing regimen and aid in trial design.
References
-
1.
Ryu et al. Tumour volume doubling time of molecular breast cancer subtypes assessed by serial breast ultrasound. Eur Radiol. 2014 Sep;24(9):2227–35.
-
2.
Di Leo et.al; Results of the CONFIRM phase III trial comparing fulvestrant 250 mg with fulvestrant 500 mg in postmenopausal women with estrogen receptor-positive advanced breast cancer. J Clin Oncol. 2010 Oct20;28(30):4594–600.
M-079
ModViz Pop: R-Shiny Based PK/PD Interface for Empowering Teams to Perform Real-Time Simulations
Pavan Vaddady1, Bhargava Kandala1
Merck &Co. Inc., Kenilworth, NJ, USA
Objectives: Demonstrate an interactive and dynamic visualization tool, ModViz POP, for simulating ordinary differential equations-based PK/PD models with variability.
Methods: ModViz POP has an in built PKPD ODE library of models based on the compartmental nomenclature for simulating standard IV bolus, infusion and first order absorption scenarios. It also gives the user the ability to plug in a model from local directory to quickly simulate a model of interest. Users can also simulate from a project library which serves as a repository of final PK/PD models developed by individual project teams. Beyond the PK/PD models, it can handle complex QSP models and PBPK models equally well. Enhanced R packages, HTML/CSS, LATEX in combination with Shiny were used and provided an elegant and powerful programming framework for turning models into a web application with dynamic visualization and automated report writing. The user interface consists of several key inputs for performing the simulations. A tabbed navigation allows the user to visualize the plots, input parameters, derived values and equations. It provides the ability to download the underlying model, plots, simulated data or a comprehensive report consisting of all the key inputs and outputs of the simulations. The Help button provides a link to documentation with detailed instructions on different components of the interface. The interface also includes advanced features where users can overlay external data on over simulated data, set a certain simulation scenario as a reference or carry out sensitivity analysis-based simulations.
Conclusions: This easy to use interface can serve as a valuable tool for teams to explore and evaluate potential scenarios and thus facilitate collaborative decision making in the drug discovery and development paradigm.

Reference
1. Kyle T. Baron et al. mrgsolve: Simulate from ODE-Based Population PK/PD and Systems Pharmacology Models. 2017.
M-080
Interactive Dose Proportionality Analysis Using R Shiny
Qi Liu1, Joseph Ware2, Thomas Scott Pivirotto1, Jin Yan Jin1
1Genentech, Inc., South San Francisco, CA, USA 2Acerta Pharma B.V., South San Francisco, CA, USA
Objectives: Evaluation of pharmacokinetic dose proportionality is a fundamental premise of clinical pharmacology. To test for dose proportionality, an interactive web based Shiny application was developed using R. This application allows users to efficiently perform both power model and linear regression approaches.
Methods: Several R packages including ‘shinydashboard’, ‘DT’, ‘ggplot2’, ‘tidyverse’, ‘ggpmisc’ and ‘rmarkdown’ were adopted to improve interactive functionality of the R-Shiny application. Power and dose normalized linear regression models were implemented in this application. Visualizations for data inspection such as power plot and dose normalized plot can be generated in the application as well. An analysis report with user inputs, resulting figures and tables within the R shiny interface can be downloaded to users’ local file folder in HTML, Word and PDF format.
Results: R shiny interface snapshots are shown in Figure 1. Upon loading the dataset and selecting the corresponding variables, a power plot and dose normalized plot will be generated. User can compare models in different categories. Additionally, 90, 95 and 99% confidence intervals for model slopes will be calculated under each category. User will be able to decide whether to accept dose proportionality assumption. User also has the flexibility to download any resulting tables, figures and R outputs from the R-shiny interface. A report will be automatically generated within Rmarkdown containing model results and user inputs.
Conclusions: This R Shiny interface with automatic report generation provides a user-friendly platform to efficiently perform dose proportionality analysis and dynamic report generation. This also provides a visual-friendly and interactive communication tool for effective team discussions of the analysis.

Fig. 1 Snapshots of the R shiny user interface for dose proportionality analysis
M-081
PKPDSimulator.jl: A simulation engine for drug development and clinical therapeutics in Julia
Christopher Rackauckas1, Joakim Nyberg2 and Vijay Ivaturi1
1Center for Translational Medicine, University of Maryland Baltimore 2Pharmacometrics Research Group, Dept of Pharmaceutical Biosciences, Uppsala University
Objectives: To develop a fast, scalable and modern simulation engine from hierarchical, ordinary differential equation (ODE) based models commonly used in drug development and clinical therapeutics.
Methods: The rich and popular differential equation ecosystem in Julia language, DifferentialEquations.jl1 was used to develop a fast and modern simulation engine. A domain specific language (DSL) was developed to abstract solver setup, data sets and records and PK dosing events. The modeler has the ability to create a separate model file or can develop the model in native Julia code. Input data are passed in and simulated data are returned as Julia objects.
Results: The following software requirements comparable to other simulation engines were met:
-
NMTRAN-like input datasets
-
Multiple modality of drug input into the system with the ability to reset dosing
-
Dose and frequency modifiers such as Bioavailability, ADDL, II, ALAG, SS
-
In-built parallelization of simulation routines
-
Multiple output formats
-
Extremely scalable and capable of running on multi-node clusters in cloud archictecture
Twenty PK and ten PD models with different administration modalities and modifiers were tested and compared to popular tools such as NONMEM, mrgsolve and Phoenix. Simulation results matched up to 1e−12 precision.
Conclusion: PKPDsimulator.jl is an easy to use and extensible tool for efficient and fast simulations commonly used in drug development and clinical therapeutics. The entire code base is written in the Julia language, allowing for inter-procedural optimizations.
Reference
-
1.
1. DifferentialEquations.jl – A Performant and Feature-Rich Ecosystem for Solving Differential Equations in Julia. Christopher Rackauckas, Qing Nie. Journal of Open Research Software.
M-082
GPU-based Parallel Computation of Pharmacometric Models in Stan Software for Bayesian Inference
Erik Štrumbelj1, Rok Češnovar1, Davor Sluga1, Jackson Burton2
1University of Ljubljana, Slovenia; 2Critical Path Institute, Tuscon, AZ, USA.
Objectives: Stan software for Bayesian statistics (http://mc-stan.org/) is gaining wide acceptance in the pharmacometrics community. While Stan is robust and flexible, Bayesian inference can be computationally intensive when using a traditional computer CPU. Our objective is to speed-up parameter estimation in Stan using Graphical Processing Units (GPUs). A case study is presented using a disease progression model for mild-to-moderate Alzheimer’s Disease previously developed by the Critical Path for Alzheimer’s Disease (CPAD) (1).
Methods: The computationally-intensive parts of the estimation were moved to the GPU. This required: manual gradient derivation instead of Stan’s built-in auto-differentiation, implementation on the GPU (using OpenCL) and further optimization techniques. The use of GPU code within Stan was facilitated by our previous work on integrating GPU capabilities into Stan (https://github.com/stan-dev/math/pull/861). We evaluated and validated our approach by comparing CPU estimates and times to GPU. The CPAD dataset for mild-to-moderate Alzheimer’s disease comprised of 15 studies, 4485 patients, and 24945 observations.
Results: Estimation with 1000 warmup and 1000 sampling iterations took 53.1 h on an Intel Core i7-4790. We ran the same estimation on two GPUs: NVIDIA TITAN Xp and AMD Radeon R9 Fury. The runtimes were 0.81 h (65-times speedup) and 0.63 h (85-times speedup), respectively. The estimates obtained on the GPUs matched the CPU estimates.
Conclusions: Our approach leads to significant speedups and it can be applied to other specific models. This approach offers practical solutions to pharmacometricians developing quantitative tools for drug development by removing the time restrictive bottlenecks in the model development process. Future work is aimed at generalizing the approach to any model written in Stan.
Reference
-
1.
Romero K, Ito K, Rogers J, Polhamus D, Qiu R, Stephenson D, et al. The future is now: Model-based clinical trial design for Alzheimer’s disease. Clin Pharmacol Ther. 2015 Mar 1;97(3):210–4.
M-083
ggPMX: a toolbox to easily generate a comprehensive set of model diagnostic plots for population models
C. Bartels (1), B. Bieth (1), T. Dumortier (1), I. Baltcheva (1), S. Bhattacharya (2), I. Ludwig (1), I. Demin (1), A. Gassem (3), D. Renard (1)
(1) Pharmacometrics, Novartis, Basel, Switzerland (2) Pharmacometrics, Novartis Inst of Biomedical Research Inc, Cambridge, USA (3) AG-Sudy, 18 rue Philibert Lucot, 75013 Paris, France
Objectives: A comprehensive and concise set of informative model diagnostic plots is primordial for the development of population PK and PKPD models. Even though the generation of any specific model diagnostic plot is fairly straightforward, generating a comprehensive set of plots adapted to a particular project takes time, tends to be reprogrammed for each new modeling activity, and tends to be done somewhat differently by different pharmacometricians.
Methods: At Novartis, we aimed at standardizing the set of diagnostic plots used for modeling activities in order to reduce the overall effort required for generating such plots. For this, we developed a guidance that proposes an adequate set of diagnostics and a toolbox, called ggPMX and presented hereafter, that allows generating such diagnostics at a quality sufficient for publication and submissions.
Results: ggPMX is an R package and builds upon the package ggplot2, which are familiar to many pharmacometricians. The package is planned to be made available to the user community on CRAN. In a few lines of codes, ggPMX generates an output file (PDF, Word or HTML) with diagnostic plots for any model. By default, the file contains model diagnostics proposed in our guidance; however, the default can be adapted to produce different sets of diagnostics as desired, and any of the plots may be customized individually. Available customizations include modifications of the graphical parameters and stratification.
Conclusion: The first release of ggPMX will work with Monolix outputs. Current plans are to enhance ggPMX to support also NONMEM and nlmixr outputs.
M-084
Cloud-Based Computation Platform for Pharmacometrics – Challenges in Developing and Implementing an Integrated Solution
Navin Goyal1, Des Burke2, Lorenzo Ridolfi3 and Stefano Zamuner3
1CPMS, GlaxoSmithKline USA, 2CMR, Tech Analytics, GlaxoSmithKline UK, 3CPMS, GlaxoSmithKline UK
Objective: Availability of a high-performance computation platform comprising of variety of data analysis software tools with a range of capabilities and ability to execute diverse methods and applications has become a necessity to implement a cutting-edge, time-critical and computationally intensive pharmacometric strategy routinely in drug development. Nevertheless, most organizations usually exhibit some heterogeneity in preference for such software tools. Other considerations include adequate qualification to ensure system integrity, audit trail, version control and regulatory compliance. There is currently no single off-the-shelf solution that satisfies these requirements. Sharing the challenges and learnings in developing such a system can be helpful to the wider pharmacometric community.
Methods: Screening, active discussions and/or due-diligences, hands-on proof-of-concept (PoC) testing were conducted for Platform solutions from multiple vendors with respect to features, system scalability, current capabilities, future expansion potential, ease of deployment, integration with other systems and cost.
Results: The implemented solution is a customized enterprise platform hosted in the Amazon Web Services. The platform integrates several open source and proprietary software tools such as PsN®, R, RStudio®, NONMEM®, Pirana® and PHOENIX® (additional tools planned) in a validated and encrypted environment. The system architecture (Figure 1) allows flexibility to adjust capacity. The underlying SONIC® platform provides efficient modeling and simulation project management, version control repository, collaboration and audit trail. The current system consists of an interactive Linux headnode with additional grid nodes in a Linux environment allowing ample compute resource for the pharmacometric activities. The system also includes Windows servers dedicated for PHOENIX®.
Conclusions: Setting up a custom cloud-hosted platform that integrates multiple tools commonly used by pharmacometricians is challenging with additional considerations when integrating with in-house systems. Pharmacometrics community can collectively benefit by sharing learnings in implementing such a comprehensive, high computing capacity and cost-effective platform solution, removing most infrastructure hurdles in industrializing an efficient model-based drug development approach.

Fig. 1 Pharmacometrics infrastructure schematic
M-085
Web App for Creating Pharmacometric Analysis Dataset Specification Form
Neelima Thanneer1, Lu Chen1, Baylea Boyle1, Chengke Tang1, Erin Dombrowsky1
1Data Science, Clinical Pharmacology and Pharmacometrics, Bristol Myers Squibb, NJ
Objectives: To standardize and pre-populate the specification in order to minimize the number of iterations between programmers and pharmacometricians to create the specification form for pharmacometric analysis datasets. In addition, to enable automation of information extraction from the specification and programming the dataset.
Methods: This tool is designed to pre-populate the data structure, variable names, labels, units, derivations etc. based on the template the user selects. Templates for Population PK (PPK) and Exposure–Response (E-R) datasets are built into the web app. PHP was used to develop this tool and MariaDB is used as the backend database for storing the specs and version controlling.
Described below is the functionality of the web app:
-
User log-into the web app interface with credentials
-
Create a new spec, modify the existing spec, review and/or approve the spec
-
Select the template e.g., POPPK, E-R to pre-populate the standard variables
-
Select built in optional variables and/or add new variables
-
Built in checks to enforce standards
-
Export the specification in.pdf format to the working directory structure on the Linux server
-
Create and export the data definition specification for electronic submission
Results: The tool enforced the data standards on dataset structure, variable names, labels, derivations, imputation rules and exclusion flags. It also reduced the variability in the specifications across projects and minimized the back and forth communication between programmer and pharmacometrician. It has the flexibility to select built in optional variables and add new variables, derivations, flags and imputations conforming to the conventions.
Conclusion: This web app has brought in a lot of efficiency in specification creation, making it simple to create and submit a spec. The built-in templates eliminate the burden on pharmacometricians to manually populate all the standard variables and attributes. It enforced standardization of specification across the projects.
M-086
Optimization of Sampling Times for Drugs with Highly Variable Pharmacokinetic Profile
Amy Meng,*, Mun Sang Yue, Cara Nelson, Anita Mathias, Shringi Sharma
Gilead Sciences, Inc., Foster City, CA
Objectives: Selection of sparse sampling time points (or windows) can be challenging for drugs with variable PK profile (i.e. with poorly correlated Cmin and Cmax). Modeling and simulation (M&S) was used to optimize sampling times for an investigational agent (administered once daily) being developed for the treatment of metabolic disorders, including nonalcoholic steatohepatitis.
Methods: A PopPK model was developed based on intensively sampled PK, collected in a Phase I study (N = 50). The model parameters were used to generate estimates of ‘optimal’ sparse sampling time points using the Bayesian Fisher Information Matrix implemented with PFIM® v4.01 program. Mulitple scenarios involving different combinations of sampling times (e.g. pre-dose, 1.5, 2, 2.5, 3, 6 h post-dose), windows (e.g. ± 0.5 h, ± 1 h, ± 1.5 h), and distribution (normal versus log-normal) of actual sampling times were evaluated using simulations. M&S was conducted with NONMEM® v7.3 and R v3.3.2 was used for post-processing.
Results: A 2-compartment model with first-order absorption and lag time best described the plasma concentration versus time profile. The estimated typical values were 330 L/hr for CL/F, 135L for Vc/F, 257 L/hr for Q/F, 1140 L for Vp/F, 0.968/hr for Ka, and 0.468 h for lag time. Inter-individual variability (IIV) was 53.5% on CL/F, 103.4% on Vc/F, 87% on Q/F, and 61.9% on Vp/F. Steady state exposures (AUC and Cmax) were compared between simulated scenarios and intensive data (iPK) to inform sampling time selection (Figure 1). A sampling scheme involving a pre-dose sample, and a post-dose sample at 2.5 ± 2 h was recommended taking into account simulation results and clinical feasibility.
Conclusions: M&S was used to provide informative sparse PK sampling times for a Phase 2 study. The presented methodology can help improve the precision of PK parameter, IIV and covariate effect estimates using sparse samples.

Fig. 1 M&S-based comparison for different sampling scenarios
Reference
-
1.
Mentré F et al., PFIM 4.0. PAGE 2014 Abstract 3032.
M-087
Interpretation of Dose-Dependent Pharmacokinetics of Ruzasvir Using Both Physiological-based Pharmacokinetic (PBPK) and Population Pharmacokinetic (PopPK) Modeling Approaches
Binfeng Xia1, Arne van Schanke2, Gerly van der Vleuten2, Phil Sabato3, Wei Gao3
1Pharmaceutical Sciences, Merck & Co., Inc; 2Certara Strategic Consulting; 3Pharmacodynamics, Pharmacokinetics and Drug metabolism, Merck & Co., Inc
Objectives: Ruzasvir (MK-8408) is a potent HCV NS5A complex inhibitor that was clinically studied from 4 to 600 mg as single and multiple doses. Non-compartmental analysis showed that MK-8408 exhibits approximate dose proportional pharmacokinetics (PK) over the range of 60 to 140 mg, behaves supraproportional from 4 to 60 mg and subproportional from 140 to 600 mg. Dose-dependent PK of MK-8408 was characterized and interpreted using PBPK and PopPK approaches.
Methods: MK-8408 is a P-gp substrate and demonstrates a steep pH-dependent aqueous solubility within the range in gastrointestinal (GI) environment. We hypothesized that the unique dose-exposure relationship of MK-8408 was due to the interplay of P-gp saturation and solubility limited absorption. PBPK (Gastroplus) and popPK (NONMEM) models were developed the two aforementioned factors impacting the absorption were estimated.
Results: MK-8408 concentration profiles and dose-exposure relationship were reasonably described by both PBPK and popPK models. The average prediction errors of AUC and Cmax (vs. observed values) by the PBPK model were less than 30% and 25%, respectively. In the popPK model, dose-dependent PK was handled by varying bioavailability: a rational function to characterize the increasing bioavailability over 10–140 mg and a Weibull model to characterize the decreasing bioavailability over 180–600 mg dose. Relevant covariates were also included in the popPK model.
Conclusions: The modeling exploration suggested that the dose-dependent PK of MK-8408 could be potentially explained by our hypothesis: the greater-than-dose proportionality at lower doses related to effect of efflux transporter in GI tract, the dose proportional PK at the middle range due to saturation of efflux transporter, whereas less than dose proportionality at high doses probably attributed to combined effect of saturated efflux process and solubility limited absorption.
M-088
A Model Based Meta-Analysis of second generation antipsychotics for the treatment of Schizophrenia
Chao Xu (1), Maria Luisa Sardu (2), Anne Chain (1), Huub Jan Kleijn (2), Li Qin (2), Ferdous Gheyas (1), Eugene Cox (2) and Sreeraj Macha (1)
(1) Merck & Co., Inc., 126 E. Lincoln Avenue, Rahway, NJ 07065, (2) Certara
Objectives: This analysis aimed to develop a Model Based Meta-Analysis (MBMA) comparator model to provide a quantitative framework for the comparison of second generation antipsychotics (SGA) used for the treatment of schizophrenia, using change from baseline of the total positive- and negative symptom score (PANSS).
Methods: A systematic literature review was conducted to construct a schizophrenia database that consists of publicly available summary level safety and efficacy data from 267 randomized controlled trials investigating antipsychotics. Based on predefined selection criteria with a primary focus on trials for acute schizophrenia with forced- or no dose titration, the analysis dataset contained monotherapy data from 33 trials of 10 SGAs and haloperidol. Model development, evaluation and simulations were performed using R 3.4.2. The models were developed using the generalized nonlinear least squares (gnls) function in R. Placebo response was described using a non-parametric method to adjust for trial-to-trial variability. Drug effect was estimated using a parametric method and dose–response was assessed where possible using an Emax model. Model appropriateness was assessed using diagnostic plots and covariates were graphically explored. Treatment effect estimates with associated 95% confidence intervals for each drug were derived from 10000 simulations with parameter values sampled from the multivariate normal variance–covariance matrix of the estimates.
Results: The model was able to capture the data well and treatment effect was identified for each drug. Furthermore, dose–response relationship was obtained for lurasidone, risperidone and paliperidone. Figure 1 shows the estimated treatment effects for 10 SGAs and haloperidol. Clinically relevant covariates are being evaluated to identify relevant patient and trial characteristics.
Conclusions: A MBMA model of PANSS score of SGAs and haloperidol was successfully developed. Model estimated treatment effects provide a quantitative framework for benchmarking new investigational compounds in schizophrenia.

M-089
A Physiologically Based Pharmacokinetic (PBPK) Model to Predict Disease-Mediated Therapeutic Protein–Drug Interactions Between an Anti-Interleukin-6 (IL-6) Monoclonal Antibody (Sarilumab) and Multiple Cytochrome P450 (CYP) Substrates in Patients with Rheumatoid Arthritis (RA)
Christine R. Xu1, Anne Paccaly2, Vanaja Kanamaluru1
1Sanofi Genzyme, Bridgewater, NJ, USA; 2Regeneron Pharmaceuticals, Inc, Tarrytown, NY, USA.
Objectives: Elevated IL-6 concentrations in patients with RA down-regulate CYP enzyme activity and thus increase exposure to drugs metabolized by CYP isozymes. PBPK modeling and simulation were conducted to predict the impact of elevated IL-6 on the activity of multiple CYP enzymes in patients with RA and to assess the treatment effect of sarilumab.
Methods: The PBPK model was developed using SimCYP, based on IL-6 effects on hepatic and intestinal expression of CYP enzyme activity and in vitro CYP suppression data in hepatocytes. The model was verified by predicting the effects of sarilumab on a CYP3A4 substrate, simvastatin, in patients with RA and comparing with observed results from a clinical trial [1]. The PBPK model was further utilized to predict the disease–drug interactions that had not been assessed clinically in patients with RA for sarilumab with substrates of CYP2C9 (warfarin) and CYP2C19 (omeprazole).
Results: In virtual patients with RA treated with sarilumab, the PBPK model predicted changes in systemic exposure of simvastatin (38% reduction) that were consistent with clinical observations (45% reduction). The magnitude of the effect predicted by the model is sensitive to baseline IL-6 level, inhibition EC50, and gut:liver CYP enzyme suppression ratio by IL-6. The PBPK model predicted a reduction in exposure of warfarin (19%) and omeprazole (28%) in RA patients receiving sarilumab.
Conclusions: PBPK modeling and simulation appeared to predict an effect of sarilumab on simvastatin exposure consistent with clinical observations in patients with RA. The predicted effect on CYP2C9 (warfarin) and CYP2C19 (omeprazole) activity was less than the observed effect on CYP3A4 (simvastatin) activity. These analyses demonstrate the utility of the PBPK modeling approach for predicting disease-mediated interactions between anti-IL6 agents and CYP substrates.
SANOFI/REGENERON provided study funding and medical writing support (Zach Dixon, Adelphi).
Reference
-
1.
Lee EB et al. Clin Pharmacokinet 2017;56:607–615.
M-090
Modeling of Neutropenia in the Setting of Autologous Stem Cell Transplant with Single, High Dose Chemotherapy and G-CSF
Donald J. Irby1, Yu Kyoung Cho1, Mohamed Badawi1, Anees Dauki1, Craig C. Hofmeister2, Diane R. Mould2, Mitch A. Phelps1
1Division of Pharmaceutics and Pharmaceutical Chemistry, College of Pharmacy, The Ohio State University, Columbus, OH; 2Department of Hematology and Medical Oncology, Emory University School of Medicine, Atlanta, GA; 3Projections Research Inc., Phoenixville, PA
Objectives: Numerous models describing neutrophil dynamics following chemotherapy treatment have been presented in the literature. However, few studies have presented models combining single, high dose chemotherapy and G-CSF in the transplant setting. Herein, we present data with unique features that require incorporation of both feedback from G-CSF on progenitor cell proliferation along with rapid influx of marginated neutrophils to describe the unique features of the data in this transplant setting with single, high dose chemotherapy.
Methods: PK (melphalan plasma concentrations) and PD data (absolute neutrophil count) were available from 118 myeloma patients receiving autologous stem cell transplant. Patients received melphalan two days prior to transplant and daily G-CSF beginning either day +1 or day +7 after transplant. PK/PD data fitting and covariate analysis was completed in Nonmem 7.3.
Results: A 2-compartment PK model combined with a semi-mechanistic PD model describing neutrophil dynamics was developed. One unique feature of the data included a spike in ANC following G-CSF given on day + 1 but not on day + 7. Despite attempts to capture this spike in ANC using only feedback from G-CSF, these attempts were unsuccessful. Ultimately, we incorporated both G-CSF feedback and rapid influx of marginated neutrophils into systemic circulation in order to accurately describe the observed data for both the G-CSF day + 1 and day + 7 regimens. The resulting model accounted for various contributions to observed ANC levels induced by exogenous G-CSF, including the induction of neutrophil proliferation, and influx of marginated neutrophils.
Conclusions: Our semi-mechanistic model highlights the important, but complex, role that marginated neutrophils play in different G-CSF regimens for patients undergoing HDM-ASCT. This model is now being explored as a dosing algorithm for individualized dose selection in a prospective clinical trial of myeloma patients undergoing high-dose melphalan with autologous stem cell transplant.
M-091
A physiologically-based pharmacokinetic model adequately predicted the human pharmacokinetic profiles of YH4808, a novel potassium-competitive acid blocker to treat gastric acid related diseases
Hyun A Lee1,2, Kyeong-Ryoon Lee3, Seong-Bok Jang4, Soo Young Chung5, Kyung-Sang Yu1, Howard Lee1,2
1Department of Clinical Pharmacology and Therapeutics, Seoul National University College of Medicine and Hospital, Seoul, Korea; 2Department of Transdisciplinary Studies, Graduate School of Convergence Science and Technology, Seoul National University, Suwon, Korea; 3Laboratory Animal Resource Center, Korea Research Institute of Bioscience and Biotechnology, Ochang, Chungbuk, Korea; 4Clinical Development Team, Yuhan Research & Development Institute, Yuhan Corporation, Seoul, Korea; 5Drug Metabolism & Pharmacokinetics Team, Yuhan Research & Development Institute, Yuhan Corporation, Seoul, Korea
Objectives: YH4808 is a highly potent, selective and reversible potassium-competitive acid blocker (P-CAB) on H +/K + -ATPase under development for the treatment of gastric acid related diseases. The objectives of this study were 1) to develop an animal physiologically-based pharmacokinetic (PBPK) model of YH4808 using its physicochemical properties and in vitro and in vivo nonclinical data, 2) to expand the model to humans to predict the pharmacokinetic(PK) profiles of YH4808 in various clinical settings for further clinical development, 3) to investigate the mechanistic basis of the decreased exposure to YH4808 after repeated oral administration at higher doses on the human PBPK model.
Methods: A PBPK model was developed using the physicochemical data, in vitro nonclinical and clinical data of YH4808, which was further refined using human plasma concentrations obtained from a single-dose ascending phase I clinical trial of YH4808 with the SimCYP® (Certara USA, Inc., Princeton, USA).
Results: The pharmacokinetic profiles of YH4808 after multiple oral administrations were predicted using a refined PBPK model. However, the model failed to predict a decreased exposure after multiple oral administrations particularly at higher doses of 200 and 400 mg. The reduced solubility of YH4808 at higher pH was hypothesized as the main cause of the reduction in exposure such that absorption was decreased as pH was increased. This hypothesis was confirmed by PBPK modeling and simulation, where intragastric pH was increased by YH4808.
Conclusions: A human PBPK model adequately predicted the concentrations of YH4808 observed in a clinical study. Furthermore, a simulation experiment based on the human PBPK model indicated that the pH-dependent solubility of YH4808 could have resulted in the reduced exposure after multiple administration. PBPK modeling and simulation is a useful tool to investigate the impact of the biopharmaceutical properties of a compound on its PK profiles during clinical development.

Fig. Observed (●, ○, ▲, Δ, ▼, ▽ ■, □, ◆, ◇) and model-predicted (━)mean plasma concentration–time profiles of YH4808 in humans after repeated oral administration at 100, 200 and 400 mg once a day
M-092
Apply machine learning methods to predict bilirubin progression and need for phototherapy in neonates
Julia Vogt (1), Imant Daunhawer (1), Gilbert Koch (2), Severin Kasser (3), Sven Wellmann (3), Marc Pfister (2)
(1) Department of Mathematics and Computer Science, University of Basel, Basel, Switzerland (2) Pediatric Pharmacology and Pharmacometrics, University of Basel Children’s Hospital, Basel, Switzerland, (3) Department of Neonatology, University of Basel Children’s Hospital, Basel, Switzerland
Objectives: Jaundice due to hyperbilirubinemia is the most prevalent medical condition in neonates. Goal was to apply innovative machine learning (ML) to identify predictive factors for bilirubin progression and need for phototherapy to treat jaundice.
Methods: ML was applied to longitudinal data from neonates. A random forest classifier was trained (1) by applying an ML classification method based on an ensemble of decision trees. A tree was iteratively built by selecting variables according to their relevance for discriminating between the classes, where relevance was measured in terms of information gain. Neonates were randomly divided in a training set (“bag”) and a test set (“out-of-bag”) using resampling techniques with the average error on the “out-of-bag” sets serving as an estimate for the predictive error on new patients. Predictive performance expressed as Area Under the ROC Curve (AUC) of the classifier was assessed at 3 time points: before birth, up to 24 and 48 h after birth, respectively.
Results: We analyzed 34 variables from 400 preterm and term neonates of which 125 neonates received phototherapy. Neonates had a median gestational age (GA) and birth weight (BW) of 36.5 weeks and 2.7 kg, respectively. Neonates had at least 1 bilirubin measurement up to 48 h after birth with a median of 2 measurements. With data before birth, AUC was 0.7 with GA and maternal age being the most predictive variables. With data up to 24 h prediction accuracy increased to an AUC of 0.8 with bilirubin level, BW and GA being the most important variables. Prediction performance did not further increase when utilizing data up to 48 h after birth.
Conclusions: This is the first application of ML to predict bilirubin progression and need for phototherapy. Prospective studies are warranted to investigate whether ML can support clinicians to better manage jaundice in neonates.
Reference
-
1.
Breiman L. Random Forests. Machine Learning, 2001; 45:5–32.
M-093
A quantitative systems pharmacology model of Jak signaling pathways in asthma
Justin Feigelman1, Siddarth Sukumaran1, Fang Cai1, Tracy Staton1, Hart Rardin1, Matthew Durk1, Jane Kenny1, Saroja Ramanujan1, Kapil Gadkar1
1Genentech, Inc. South San Francisco, CA
Objectives: We aim to develop a systems model of asthma disease physiology and the predicted impact of inhibition of Jak-mediated cytokine signaling.
Methods: We used a large collection of published and in-house data, both clinical and preclinical, to derive a quantitative systems model of asthma pathophysiology. We calibrated the strength of model effects using a combination of in vitro estimates for rate constants and empirical factors that capture the observed clinical response of measurable clinical endpoints pertaining to lung function (forced expiratory volume in 1 s; FEV1), fraction exhaled nitric oxide (FeNO), as well as impact on leukocytes (dynamic changes to eosinophils, ILC2 s, mast, B, Th2 cells, etc.). Clinical data encompass therapies targeting IL-5, IL-13, IL-4 as well as glucocorticoids which exhibit systemic anti-inflammatory properties and bronchodilators (β2-agonists and muscarinic receptor antagonists). Jak inhibition is represented by targeted reduction in the transduced effects of cell-type specific signals mediated by Jak isoforms (IL-4/13 for Jak1, IL-5/TSLP for Jak2).
Results: Using our quantitative systems pharmacology (QSP) modeling approach we make predictions for the hypothesized benefit to individuals with various degrees of asthma severity upon treatment with Jak inhibitor. We make predictions for varying selectivities and potencies for Jak isoform inhibition and stratify by patient phenotype (high or low for type 2 inflammation characterized by tissue eosinophils and high/low FeNO production) to identify the molecular properties of Jak inhibition predicted to yield the most impact on clinically relevant biomarkers associated with asthma severity.
Conclusions: Our newly developed QSP model provides insight into the quantitative contributions of Jak-mediated inflammatory pathways on asthma severity as characterized by clinical biomarkers that would be difficult to obtain without a large investigational study. These will be useful for rational development of molecules targeting Jak pathways as well as aiding in clinical trial design.
M-094
Population Pharmacokinetics of Bivalirudin in Healthy Chinese Male Subjects and a Comparison of FOCE and EM Estimation Methods
Kai Wang1, Wenfang Liu2, Gordon Amidon1, Meihua Rose Feng1
1College of Pharmacy, University of Michigan, Ann Arbor, MI, USA; 2Beijing Anzhen Hospital, Beijing, China
Objectives: To characterize the population pharmacokinetics (PK) of Bivalirudin in healthy Chinese male subjects and compare the FOCE and the EM estimation methods.
Methods: Twenty healthy male Chinese subjects were enrolled and randomly assigned to two groups. Individuals in the group 1 received a bolus intravenous (IV) dose of 0.75 mg/kg bivalirudin, and in the group 2 received the same bolus IV dose of 0.75 mg/kg followed by a one-hour IV infusion of 1.75 mg/kg/hr of bivalirudin. Population PK models of bivalirudin using NONMEM FOCE (first-order conditional estimation) or EM (expectation maximization) methods were developed and compared.
Results: Bivalirudin PK profiles were best described by a two-compartment PK model using either FOCE or EM methods. No significant differences in bivalirudin PK parameters assessment were observed with model estimated values of systemic plasma clearance (CL ± SE), volume of distribution in the central (V1 ± SE) and peripheral compartments (V2 ± SE) as 0.280 ± 0.0202 and 0.281 ± 0.0230 L/min, 3.79 ± 0.334 and 3.78 ± 0.442 L, and 2.12 ± 0.166 and 2.15 ± 0.278 L for the FOCE and EM methods, respectively.
Conclusions: The population PK models developed from our study using the FOCE and EM methods successfully characterized the distribution and elimination of bivalirudin in healthy Chinese male subjects with similar estimation results.
M-095
Individual Optimal Dosing of Osimertinib and Selumetinib in EGFRm NSCLC Patients
Kamrine Poels, Shaon Chakrabarti, Franziska Michor
Harvard T.H. Chan School of Public Health, Dana Farber Cancer Institute
Objectives: Establishing an optimal drug administration schedule is a critical procedure in the treatment of cancer, but it has become a strenuous task in cancer research. Furthermore, combination therapy is routinely used due to the emergence of multiple resistant mechanisms in tumor cells, and this increases the number of possible drug dosing schedules. Hence, in silico clinical trials are an inexpensive method for researchers to find an optimal drug regimen. Here, we incorporate data on drug kinetics in serum (pharmacokinetics or PK) with an evolutionary dynamics model based on multi-type branching processes, to predict cancer growth or abatement under specific dosing regimens in order to select the most favorable dosing schedule.
Methods: We expanded PK models to include effects explained by the patients’ clinical characteristics and inter-individual variability (IIV) using a non-linear mixed effects framework. Next, we applied our approach to a phase-1b clinical trial (TATTON) administering osimertinib and selumetinib to EGFR-mutant lung cancer patients. We analyzed tumor growth of simulated patients under the three trial arms used in TATTON and under other proposed dosing schedules and compared these newly proposed schedules to the original schedules from TATTON.
Results: We observed a wide-ranging distribution of relative improvements, with very few subjects (whose PK predictors were evaluated at the median population values) performing worse under the recommended schedules. Most subjects older than the median population age and heavier than the median population weight had remarkable relative improvements under the proposed schedules, demonstrating the importance of adjusting for patient PK predictors for optimal dosing.
Conclusions: We propose that researchers can optimize dosing schedules at the individual level by obtaining the clinical data and PK parameters of each patient after a short time period under a traditional dosing schedule, and then change administration of the drug by selecting the most promising dosing schedule based on our model’s predictions.
PW-1
The effect of monoclonal antibodies pharmacokinetics on the tumor cells dynamics: A bifurcation analysis
Amirhossein Hajihosseini, Farzaneh Maleki, Yi Ting (Kayla) Lien, Valvanera Vozmediano, Stephan Schmidt
Center for Pharmacometrics and Systems Pharmacology, University of Florida, Orlando, FL, USA
Objectives: Tumor dynamics play a critical role in optimal dose selection during the development of monoclonal antibodies (mAbs). However, the dynamic interplay between mAb target site exposure and tumor pharmacodynamics (PD) is often not well understood. Therefore, we set out to characterize the target site exposure–response relationship of the HER2 mAb trastuzumab using a bifurcation analysis3.
Methods: We extended the physiologically-based pharmacokinetic (PBPK) model by Li et al.2 to a PBPK/PD model by accounting for tumor growth and kill. Data from untreated breast cancer women1 were used to inform respective PD model parameters, i.e., the logistic tumor growth rate constant and its carrying capacity4. A bifurcation analysis was performed to determine exposure breakpoints for tumor growth and kill using tumor volume as the PD endpoint.
Results: A transcritical bifurcation point3,4 was characterized in the parameter space of the model that was associated with the minimum plasma transtuzumab concentration necessary to efficiently suppress tumor growth. Additionally, the level of bound target receptors was shown to play an important role in the emergence of a stable tumor-free state.
Conclusions: A bifurcation analysis on a PBPK/PD tumor growth model was successfully conducted to identify the minimum plasma transtuzumab concentration needed to achieve a stable tumor-free state, and investigate the effect of model parameters, such as receptor occupancy, on tumor volume.
References
-
1.
Cairns, R. A., et al. Tumor growth, microenvironment, and metabolism. The basic science of oncology. 5th ed. New York, 2014, 271–94.
-
2.
Li, L., et al. Incorporating target shedding into a minimal PBPK-TMDD model for monoclonal antibodies. CPT Pharmacometrics & Systems Pharmacology 3 (2014) 1–13.
-
3.
Kuznetsov, Y. A. Elements of Applied Bifurcation Theory. Springer, 1998.
-
4.
Murray, J. D. Mathematical Biology: I. An Introduction. Springer, 2002.
PW-2
A Machine Learning, Genetic Algorithm Based Approach to Model Selection for Tumor Growth
Sihang Liu1, Mohamed Ismail1*, Nikhil Sasidharan Pillai2, Beth Pflug3, Mark Sale4, Robert Bies1
1Department of Pharmaceutical Sciences, School of Pharmacy and Pharmaceutical Sciences, University at Buffalo, Buffalo, NY, USA; 2Computational and Data Enabled Sciences, University at Buffalo, Buffalo, NY, USA; 3Roswell Park Cancer Institute, Buffalo, NY, USA; 4Nuventra Pharma Sciences, Durham, North Carolina, USA
*Co-first author
Objectives: The current step-wise approach to developing a population PK/PD model is inherently flawed as it fails to account for interactions between structural, covariate, and statistical parameters. Further, the current approach requires significant manual and redundant model modifications. The objective of this work was to evaluate a variety of model structures to describe tumor growth trajectories in animal xenograft tumor models using an evolutionary algorithm/machine learning approach.
Methods: Using an R-based implementation of a Genetic Algorithm (GA) approach with NONMEM, tumor growth trajectories of 22 LNCAP xenograft tumors were modeled. Six commonly used growth models were tested and compared using a “fitness” function comprising the OFV (-2LL) and penalties for numbers of parameters, failed convergence step, and failed covariance step. In each growth model, selected combinations of four IIV model structures (None, Additive, Proportional, Exponential) and three residual error structures (Additive, Proportional, Additive + Proportional) were tested. The fitness scores of the top 5 performed models in each model category were plotted together.
Results: As shown in Figure 1, the Simeoni growth model performed best for the test dataset. The model with the best fitness had the following IIV characteristics: a proportional IIV model on λ0; exponential IIV model on λ1; exponential IIV model on baseline; and no IIV model on ψ. The residual error model selected was additive plus proportional. The fitness function of the GA selected model is 2602, while the typical approach to model building conducted by a “blinded” colleague resulted in a fitness of 2748.
Conclusion: The genetic algorithm implemented here not only identified a mixed effect model for tumor trajectories that had substantially better OFV (and converted fitness) compared with the standard model search strategy, but also increased the efficiency of model development by automating control stream text editing for new combinations of model structure.

Fig. 1 The plot of the top five fitness function for six commonly used growth model categories (Simeoni, power, Gompertz, logistic, Koch, and exponential).
PW-3
Determining the structure of a quantitative systems pharmacology (QSP) model for azathioprine metabolism
Vijay K. Siripuram1,*, Daniel F.B. Wright1, Murray L. Barclay2, Stephen B. Duffull1
1Otago Pharmacometrics Group, School of Pharmacy, University of Otago, New Zealand; 2 Departments of Gastroenterology and Clinical Pharmacology, Christchurch Hospital, New Zealand
Objective: We developed a 30-state QSP model for azathioprine metabolism (see fig-1a). The model included metabolites associated with clinical response and adverse effects. This model was developed based on a meta-analysis of the literature, knowledge of azathioprine biochemistry and expert opinion. An evaluation of the model structure indicated that it was not capable of replicating both the normal and atypical metabolic data, suggesting that our current knowledge of the system is incomplete. The aim of this work was to develop a search method to identify the most parsimonious structure required to adequately reflect the clinical data.
Methods: The model was defined by nodes and edges that represent model states (e.g. the concentrations) and fluxes, respectively. The model was simplified to an equilibrium solution and solved using eigenvalue decomposition. An algorithm was created to search across both flux (J ∈ ℝ+) and logic (S∈{0,1}) matrices, while ensuring some fluxes were either always-on (e.g. flux from the dose depot to the body) or always-off (flux from the body back to the depot). The search methodology was implemented using simulated annealing and tested using a simplified 5-state model (fig-1b). The method was developed in MATLAB® (R2017a).
Results: The implemented method determined the optimal structure for 5-state model in two stages. The first stage optimised the logic matrix to create a structure that has steady state concentrations for all nodes. The second stage involved optimising the K matrix parameters. This process minimised successfully and achieved concentrations that matched the (arbitrarily chosen) test target values.
Conclusions: We are unaware of any formal methods for evaluating possible revisions to model structures for QSP models. We anticipate that this new search methodology will help us to understand potential missing structural elements of the azathioprine metabolic pathways and may have relevance to other QSP models.

T-001
Optimization of dosing schedules with evolutionary cancer modeling
Itziar Irurzun-Arana1,2, Thomas O. McDonald2,3, Iñaki F. Trocóniz1 and Franziska Michor2,3
1Pharmacometrics & Systems Pharmacology Research Unit, Department of Pharmacy and Pharmaceutical Technology, School of Pharmacy and Nutrition, University of Navarra, Pamplona, 31008, Spain. 2Department of Biostatistics and Computational Biology, Center for Cancer Evolution, Dana-Farber Cancer Institute, Boston, MA 02115, USA. 3Department of Biostatistics, Harvard School of Public Health, Boston, MA 02115, USA.
Objectives: The identification of drug administration schedules to avoid the emergence of resistance is a major challenge in cancer research. Here we propose a computational strategy to explore the effects of pharmacokinetics and drug interactions in evolutionary models of cancer progression, with the ultimate goal of identifying optimum dosing strategies.
Methods: Our approach combines stochastic evolutionary models of heterogeneous tumor cell populations with pharmacokinetics and drug–drug interaction models. This approach is made up of a cell-level description of the changes in sensitive and resistant cells over time and in response to treatment in the form of a stochastic model known as “multi-type branching process”1. In this model, sensitive cells accumulate mutations at a given rate per cell division, generating new clones harboring specific drug-resistance mechanisms. The birth and death rates of each cell type are concentration-dependent; therefore we included pharmacokinetic models using mrgsolve R package to form a multiscale description of drug metabolism and cancer evolution2. To assess drug interaction effects, we used the Loewe Additivity Model assumptions3.
Results: The resulting model is a multi-scale description of how a heterogeneous cell population changes over time depending on the drug administration schedule. This tool can then be used to search through different possible drug administration strategies to identify the one that is predicted to be best, for instance because it minimizes the risk of resistance or the expected number of cancer cells over time.
Conclusions: We present an accessible tool called ACESO (A Cancer Evolution Simulation Optimizer) to rationally identify optimum treatment administration strategies for oncogene-driven cancers. This work represents a crucial step towards making clinically relevant predictions since it incorporates the most important aspects governing treatment response and cancer evolution.
References
-
1.
Foo and Michor, J. Theor. Biol. 2010.
-
2.
Chakrabarti and Michor, Cancer Research. 2017.
-
3.
Greco et. al. Pharmacol Rev. 1995.
T-002
Optimization of drug delivery in the treatment of prostate cancer using optimal control methods
Itziar Irurzun-Arana1,2, Alvaro Janda3, Sergio Ardanza-Trevijano3 and Iñaki F. Trocóniz1,2
1Pharmacometrics & Systems Pharmacology Research Unit, Department of Pharmacy and Pharmaceutical Technology, School of Pharmacy and Nutrition, University of Navarra, Pamplona, Spain. 2IdiSNA, Navarra Institute for Health Research, Pamplona, Navarra, Spain. 3Department of Physics and Applied Mathematics, University of Navarra, Pamplona, Navarra, Spain.
Objectives: We aimed to optimize the release profile of sustained-release formulations of triptorelin (TRP), a gonadotropin-releasing hormone analog used to achieve chemical castration in prostate cancer patients, using optimal control (OC) techniques.
Methods: OC is a dynamic optimization problem in which the state of a system is linked to the application of a control function, which drives the system towards a desirable outcome by minimizing/maximizing a cost function subject to operating constraints. Here, we applied OC to a previously developed PKPD model for the testosterone (TST) effects of TRP in prostate cancer patients1 with the goal of improving drug-release characteristics. The following therapeutic objectives were simultaneously achieved: minimize both the initial flare up of TST levels and the time to reach TST values below castration limit (tcast), while maximizing the castration period of the patients. The problem was divided into two phases each represented by a different cost function and constraints and defined between: (i) [0,tcast] and (ii) [tcast,280 + tcast] days, respectively. Once the optimal TST profiles were obtained, we directly approximate them with the PKPD model from [1] and estimate the most adequate absorption parameters using non-linear mixed-effects methods.
Results: The final model adequately described the optimal TST profiles resulting from the OC technique. These results showed a big improvement compared to those from the formulations reported in [1]: minimal tcast had a median value of 19.5 days, the initial peak in the TST levels was 55% increase with respect to baseline and the median long-term castration was of 351 days2.
Conclusions: The information summarized in this work could be very useful for the development of new formulations, since it provides insight into the desired absorption characteristics that could improve patient coverage.
References
-
1.
Romero et. al. J. Pharmacol. Exp. Ther. 2012.
-
2.
Irurzun-Arana, et. al. PLoS Comput. Biol. 2018.
T-003
Solutions for End-User Accessibility of Regulatory-Endorsed Quantitative Drug Development Tools
Jackson Burton1, Daniela J. Conrado1, Timothy Nicholas2, Danny Chen2, Julie Stone3, Vikram Sinha3, Brian Willis4, Neva Coello5, Wenping Wang5, Volker D. Kern1, Stephen P. Arnerić1, Klaus Romero1; on behalf of the Critical Path for Alzheimer’s Disease (CPAD) Consortium
1Critical Path Institute, Tucson, AZ; 2Pfizer, Groton, CT, USA; 3Merck & Co. Inc., North Wales, PA, USA; 4Eli Lilly and Company, Indianapolis, IN, USA; 5Novartis Pharmaceutical Corporation, Cambridge, MA, USA
Objectives: The Critical Path Institute (C-Path) has developed open-access, regulatory-endorsed, quantitative drug development tools (DDT), based on large databases of integrated standardized clinical studies, to inform several aspects of clinical trial design [1, 2]. While these tools are powerful and robust, their adoption by drug developers is limited by accessibility to non-technical audiences and computationally intense requirements for clinical trial simulation. We present solutions to the above issues using an updated version of the previously-developed mild-to-moderate Alzheimer disease (AD) clinical trial simulation tool as a case study [3]. The tool is based on a model fit to longitudinal change on the ADAS-Cog assessment scale for AD based on the CPAD database.
Methods: A graphical user interface (GUI) using the open-source Shiny package in R is proposed to provide access to the full functionality of the tool. Cloud computing solutions are proposed for computationally efficient simulations.
Results: A GUI was developed (Figure 1) that allows users to generate virtual patient populations enriched for baseline severity, sex, age, genetic risk factors, or stable medication use. Clinical trial scenarios for parallel and delayed start designs can be simulated to calculate samples sizes for a specified statistical power. The Shiny server platform is in development to host the GUI allowing users broad access without having to run individual instances of R. The Amazon Web Server is being utilized to reduce computational time by parallelizing trial simulations.
Conclusions: Regulatory-endorsed quantitative DDTs provide robust data-driven approaches to support drug development, but additional efforts must be taken to make these tools usable by drug developers. The solutions presented here are applicable to any quantitative DDT and can support important decision making in drug development.

Figure 1 User interface tab for trial simulation and visualization within the AD clinical trial simulation tool
References
-
1.
Romero K, et al. The future is now: Model-based clinical trial design for Alzheimer’s disease. Clin Pharmacol Ther. 2015 Mar 1;97(3):210–4.
-
2.
Conrado DJ, et al. Dopamine Transporter Neuroimaging as an Enrichment Biomarker in Early Parkinson’s Disease Clinical Trials: A Disease Progression Modeling Analysis. Clin Transl Sci. 2018;11(1):63–70.
-
3.
Burton J, et al. Update of a Regulatory-Endorsed Clinical Trial Simulator for AD: New Data Incorporation, Statistical Modifications, and User-Friendly Graphical User Interface Development. In: Arizona Alzheimer’s Consortium Scientific Conference. 2018.
T-004
Patient specific Vancomycin Dose Recommendation with Baseline Information at the Time of the First Dose
Jaehee Shim1*, Zhaonan Sun, PhD2*, Amos Cahan, MD2,3*
1Department of Pharmacological Sciences, Icahn School of Medicine at Mount Sinai, New York, NY, USA; 2IBM T.J. Watson Research Center, Yorktown Heights, NY, USA;3Department of Medical Informatics, Maccabi Healthcare Services, Tel-Aviv, Israel
*The authors contributed equally to the work.
Objectives: Vancomycin is a broad-spectrum antibiotic used in the treatment of severe infections. While optimal dosing is crucial for effective treatment, due to the lack of better metrics for determining the right dosage, vancomycin is often empirically prescribed. In this study, we present a random forest based dose recommendation model using electronic medical records. Specifically, we demonstrate how patient-specific optimal dosage can be successfully derived based on the information gathered at the time of the first dose using a random forest model.
Methods: The patient data used in this study is extracted from the Medical Information Mart for Intensive Care (MIMIC-III). From a total of 41,060 cases with intravenous vancomycin administration, we extract a final study cohort of 1867 cases with 4258 covariates. Univariate test is performed to narrow down the important covariates to 83. The model development is conducted using log-transformed serum vancomycin level as the output. A bootstrap method with stratified sampling over 100 iterations is applied. A back-calculation, based on base-line information, is performed using the model with the lowest root mean square error (RMSE) score.
Results: The ranked value of average %IncMSE over 100 iterations identify features related to vancomycin elimination process as highly important. The top-most important covariate is ‘creatinine clearance (Cockcroft & Gault)’, which is a clinical metric physicians use to determine vancomycin dosage. To perform back-calculation, the best performing model with RMSE value of 0.273432 is selected. The visualization of back-calculation results show that (1) some predictions demonstrate a gradual stepwise response to the increasing level of vancomycin while (2) some jumps from high to low at a particular dose.
Conclusions: While there still exists room to improve the back-calculation performance, we believe the work presented here contributes to building the clinical knowledge that will improve the current dosing practice.
T-005
Mechanistic systems modeling to improve understanding and prediction of cardiotoxicity caused by targeted cancer therapeutics
Jaehee V. Shim,1 Bryan Chun,2 Jeffrey J. Saucerman,2 Eric A. Sobie1
1Department of Pharmacological Sciences, Icahn School of Medicine at Mount Sinai, New York, NY, USA. 2Department of Biomedical Engineering, University of Virginia, Charlottesville, VA, USA
Objectives: Tyrosine kinase inhibitors (TKIs) are a class of cancer therapeutics that have been linked with serious cardiotoxicity including left ventricular dysfunction, heart failure, and QT prolongation, although underlying toxicity mechanisms remain unclear. We sought to integrate transcriptomic data with quantitative systems pharmacology (QSP) modeling to examine how TKI-induced changes in gene expression might combine with physiological stimuli to produce toxicity.
Methods: Changes in gene expression in cardiac myocytes induced by 26 TKIs were quantified using mRNAseq. These data were then integrated into mechanistic mathematical models that described cardiac hypertrophy and electrical and contractile dysfunction. Drug-induced changes in gene expression were used to scale relevant model parameters, and simulations predicted how drug-treated cells may exhibit deleterious responses when challenged by physiological stimuli.
Results: Simulations were performed to predict the physiological consequences of treatment with 26 FDA approved TKIs and 16 non-TKIs. We evaluated how drug-induced changes in gene expression could increase or decrease the risk of toxicity due to cardiac hypertrophy, arrhythmia, or reduced contractility. Results support the paradigm of a “two hit” hypothesis in which TKIs do not immediately induce toxicity but may increase the susceptibility of cardiac myocytes to particular stimuli. For instance, nilotinib-induced changes in gene expression are predicted to lead to a pronounced increase in the hypertrophy biomarker BNP when beta-adrenergic receptors in cells are stimulated. Similarly, electrophysiology simulations predict that trastuzumab increases the arrhythmia susceptibility of cells under hypokalemia conditions whereas bevacizumab increases susceptibility of cells to block of potassium channels. Additionally, the simulation results indicate the toxicity predictions do not necessarily correlate with the degree of global differential gene expression (DEGs).
Conclusions: Our approach reveals two important insight into cardiotoxicity development: 1) physiological environment orchestrates adverse events together with TKIs; and 2) DEG numbers are not always indicative of susceptibility to adverse events.
T-006
Utilizing receptor occupancy and tumor penetration for the phase 2 dose selection of monoclonal antibodies targeting solid tumors
Jaeyeon Kim1, Fariba Khanshan1, Yu-Yun Ho2, Andrew Stein1
1Novartis Institutes for Biomedical Research, Cambridge, MA, USA. 2Novartis Pharmaceuticals Corp., East Hanover, NJ, USA
Objectives: As more targeted therapies with better safety profiles are developed in oncology, the determination of recommended phase 2 dosing (RP2D) often requires a different strategy beyond the conventional approach using maximum tolerated dose (MTD). While efficacy and/or biomarker data can in principle be useful for guiding dose selection, the heterogeneous population and lack of clear biomarker for clinical outcome in many early oncology studies seldom yield sufficient data to guide dose selection. For monoclonal antibody (mAb) drugs which have the above limitations, receptor occupancy (RO) and tumor penetration can be utilized to inform decision making regarding the RP2D.
Methods: The molecular properties (e.g., antigen expression level, binding affinity) and patient exposures (e.g., average and trough concentrations) for approved mAbs targeting solid tumors were collected from the literature. The interstitial levels of mAb in tumor were derived as a function of serum concentration based on the total tumor deposition data from the preclinical xenografts assuming the equilibrium relationship with its target. RO was computed based on the interstitial drug concentration in tumor and the antigen expression level. The tumor penetration was calculated based on the Thiele modulus which is a dimensionless ratio between time scales for target saturation and endocytic clearance in tumor.
Results: Most mAbs showed significant estimated ROs (> 90%) and sufficient tumor penetration (Thiele modulus < 1) when administered with the approved dose regimens. However, trastuzumab and pertuzumab targeting Her2 highly expressed in tumor (> 106 molecules/cell) showed poor estimated RO (< 40% at the trough concentration) and lower tumor penetration (Thiele modulus > 1). Ipilimumab dosed at its MTD exhibited relatively lower estimated RO (< 50%) indicating safety limited complete inhibition of its target.
Conclusions: Assuring RO > 90% and tumor penetration (Thiele modulus < 1) could provide additional RP2D guidance for mAbs targeting solid tumor especially when dose is not limited by safety concerns.
T-007
Development of a New Serum ALT Profile Parameter to Predict Hepatocyte Loss in Drug Induced Liver Injury using Systems Pharmaco-Toxicology Approach
Jae-Yong Chung1, Diane Longo2, Paul Watkins3
1Seoul National University College of Medicine and Bundang Hospital, Seongnam, Republic of Korea.; 2DILIsym Services, Inc., NC, USA.; 3University of North Carolina at Chapel Hill, NC, USA.
Objectives: Longitudinal time course of serum alanine aminotransferase (ALT) is correlated to severity of drug induced liver injury (DILI). We aimed to develop a general relationship between the extent of hepatocyte loss (HL) in mild to severe DILI and the systemic exposure parameters of ALT by using systems toxicology based simulation approach.
Methods: We developed a mechanistic model using DILIsym® with a hypothetical drug having direct necrosis DILI mechanism to simulate both HL and ALT profiles. Population variability was simulated by Human ALT SimPops™. We generated 4 simulation scenarios and 19 different dosing schemes in each scenario to cover 1% ~ 85% of HL in various cases of ALT elevation profiles observable in the clinic. We did 76 SimPops™ simulations generating total 6498,000 ALT values from 22,800 individuals. AUCs and Peak levels of ALT in every case were calculated. Using these large data, we developed a model to explain the HL from mild to severe DILI.
Results: A new ALT profile parameter PALT = AUC*Peak0.18/105 ((IU/L)2*h) was well correlated to the HL regardless of injury severity and scenario types. We evaluated the variabilities and confidence intervals of these relationships to be robust by validating with several clinical cases. We also proposed potential approaches how we can apply PALT to assess seriousness of DILI events observed during drug development or clinical practice. Our results suggest that PALT < 5 is clinically insignificant, > 15 is potentially serious, and > 30 can lead to death.
Conclusions: The PALT may be a useful parameter to rapidly quantify and predict hepatocyte loss and support decision-making in clinical settings.
T-008
PBPK Based Drug–Drug Interaction Risk Assessment of GSK2798745 with Simvastatin
Jafar Sadik B. Shaik1, Dung Nguyen2, Dennis Sprecher3, Rajendra Singh1, Navin Goyal1
1Clinical Pharmacology Modeling Simulation, GlaxoSmithKline, King of Prussia, PA USA; 2Mechanistic Safety and Disposition, In vitro In vivo Translation, GlaxoSmithKline, King of Prussia, PA USA; 3Exploratory Discovery, GlaxoSmithKline, King of Prussia, PA USA
Objective: A potent inhibitor of the human transient receptor potential vanilloid 4 (TRPV4) channel [GSK2798745] is being developed to influence fluid exchange and inflammation. We evaluated the potential CYP3A4 based drug–drug interaction (DDI) risk and derive dosing recommendations for GSK2798745 when co-administered with statins, a likely co-medication in the heart failure indication.
Methods: The development of a full Physiologically based Pharmacokinetic (PBPK) model for GSK2798745 followed best practice guidance including model refinement. The model was qualified using observed data from single (2.4, 5, and 12.5 mg) and repeat dose (5 mg, 14 days) PK studies. The effect of multiple doses of the strong, moderate, and weak CYP3A4 inhibitors (Itraconazole, Fluconazole, Cimetidine) on GSK2798745 exposure (3.0 mg oral) was simulated. In addition, Midazolam exposure was predicted in the presence of 10 mg GSK2798745 as CYP3A4 perpetrator. Further, DDI between Simvastatin and GSK2798745 was predicted. PBPK simulations were performed with SimCYP (CERTARA®). All simulations were done in 200 subjects receiving a single dose of CYP3A4 substrate on Day 1 and Day 8 and CYP3A4 inhibitor on Day 2 through Day 8.
Results: Simulated GSK2798745 exposure (AUC and Cmax) increased by 4.7 and 1.6-fold respectively, in the presence of a strong CYP3A4 inhibitor Itraconazole (200 mg BID); 2.5 and 1.3-fold respectively, in the presence of moderate CYP3A4 inhibitor Fluconazole (200 mg) and no increase in the presence of weak CYP3A4 inhibitor, Cimetidine (400 mg TID). GSK2798745 as a perpetrator of CYP3A4 increased the exposure (AUC) of Midazolam (3 mg) and Simvastatin (80 mg) by 1.1 and 1.2-folds respectively.
Conclusions: Simulations demonstrated no change in Simvastatin exposure with 10 mg QD GSK2798745 doses. No dose adjustments are necessary for GSK2798745 or Simvastatin on co-administration at the current dosage regimen as there is negligible risk of DDI. The analysis allowed recruitment of subjects on Simvastatin in the heart failure indication trial.
Funding: Study funded by GSK
T-009
Developing Machine Learning Algorithms using CATIE Schizophrenia Clinical Trial Data to Predict Reduction in Total PANSS Score and Identify Important Patient Outcome Predictors
Jagdeep T. Podichetty PhDa, Violeta Rodriguez-Romero PhDa, Richard F. Bergstrom PhDa, Robert Stratford PhDa, Majid Vakilynejad PhDb, Robert R. Bies PharmD PhDc
aDepartment of Clinical Pharmacology, Indiana University School of Medicine, Indianapolis, IN 46202; bTakeda Pharmaceuticals U.S.A., Inc, Cambridge, MA; cDepartment of Pharmaceutical Sciences, University at Buffalo, State University of New York, Buffalo, NY
Objectives: Over 2.4 million people suffer from schizophrenia in the USA. The traditional discovery pathway has not produced drugs that satisfactorily address the cognitive impairments or negative symptom pathology. We developed machine learning algorithms using CATIE clinical trial data to identify patient attributes that may be predictive of the improvement in schizophrenia symptoms and pathology.
Methods: We implemented machine learning based classification algorithms to predict 20% or more reduction in Total PANSS between baseline and 6 months using the first 3 months of patient data. We also identified patients’ attributes that most contribute to the outcome. The study was conducted using the existing clinical trial data obtained from the NIMH. The CATIE study included 1600 patients with over 400 patients’ attributes. The first phase in the analysis involved assembling the data, splitting the data into training and testing sets, and balancing the training set. The second phase involved applying machine learning algorithms to the balanced training set for the analysis of their predictive performance. Finally, the ML algorithms were validated using the testing set data; and entropy calculations were performed to determine the information gained from each of the patients’ attributes contributing to the predicted outcome.
Results: The random subspace algorithm classified 71.6% of the outcomes correctly with a sensitivity of 0.729. Patients’ attributes with the highest information gain included (A) maintaining intimate relationship with household members, (B) capacity for engagement and interaction and (C) time utilization with 0.363bits, 0.355bits and 0.354 bits respectively. The two highest information gain scores were associated with social interactions and communication.
Conclusions: We developed a machine learning algorithm using the random subspace classifier that predicts the clinical outcome of a 20% reduction in total PANSS score and created a list of important patients’ attributes that are associated with improvement in schizophrenia symptoms and pathology.
T-010
Population Pharmacokinetics of Enasidenib
Jamie Connarn1, Yue Gao1, Yan Li1, Simon Zhou1, and Maria Palmisano1
1Celgene Corp. 556 Morris Ave Building Summit, NJ 07901
Objectives: Enasidenib selectively inhibits the neomorphic activity of mutant isocitrate dehydrogenase-2 (IDH2) variants expressed in a subset of acute myeloid leukemia (AML) patients. The purpose of this study was to develop a population model to describe the pharmacokinetics (PK) of enasidenib, to characterize inter-individual variability in subjects, and to describe the exposure- response in patients with hematologic malignancies.
Methods: Using NONMEM® software, a one compartment model best described the concentration versus time profile with a first- order condition estimation (FOCE) with INTERACTION option. Goodness of fit plots, visual predictive checks, and bootstrap resampling approaches were used to validate the model. Enasidenib exposures (AUC0-24 at steady state) were calculated based on individual estimates of apparent clearance from the final population PK model and used as predictor variables in the exploratory exposure- response (efficacy/safety).
Results: The population PK model included 428 evaluable subjects who received daily doses (50 to 650 mg) orally in single and multiple dose regimes. The exposure response analysis included 315 subjects who had evaluable PK and reported efficacy data.
Conclusions: In patients with advanced hematologic malignancies, the average apparent clearance and terminal half-life after multiple doses were estimated to be 0.70 L/hr and 190 h, respectively. No statistically significant covariates affected Enasidenib exposure. At doses between 50 mg and 650 mg, there appears to be no incremental gain in efficacy compared to Enasidenib steady state exposure.
T-011
A Latent Variable Disease Progression Model for Duchenne Muscular Dystrophy
Janelle L. Hajjar1,2, John T. Mondick1, Marc R. Gastonguay1,2
1Metrum Research Group, LLC, Tariffville, CT, USA. 2University of Connecticut, Storrs, CT, USA.
Objectives: To quantify the disease progression (DP) time course and associated magnitudes and sources of variability in DP for Duchenne muscular dystrophy (DMD), a pediatric rare disease, as measured by the 6-minute walk test (6MWT), a highly variable primary clinical endpoint in DMD efficacy trials.
Methods: A literature search following PRISMA standards yielded digitized individual 6MWT data from one interventional clinical trial [1] and four natural history trials in boys with DMD [2, 3, 4, 5]. A three compartment latent variable DP model was fit to the data set of 219 boys. The three model compartments represented 1) physiological maturation of processes contributing to walking, 2) latent variable/disease process, and 3) 6MWT. The nonlinear mixed-effects model was fit using NONMEM® v7.3 and evaluated with simulation-based diagnostics. Covariates investigated were steroid use and interventional trial effect. Four classes of DP were defined based on prior work [5]. Simulations were performed to assess the proportion of subjects in each class.
Results: Diagnostics indicated a reasonable model fit. The maximum population predicted typical 6MWT was 394 meters (at 8.26 years old). The estimated baseline at 4.34 years old was 299 [9.31] (typical value, [standard error]) meters. The fraction of individuals in each DP class agreed with published results [5]. The latent variable dissipation rate constant (0.168 [0.0562] year−1) was the primary driver of variability in the phenotypic expression of DP across the four classes.
Conclusions: This novel latent variable DP model accurately described the central tendency and population variability of the DMD 6MWT data. Reliable inferences about covariate effects were not supported given the current data.

Figure Population model prediction (solid line) and individual model predictions (dashed lines) with observed data above the limit of quantification (open circles) and below the limit of quantification (open squares), fit with the M3 method.
References
-
1.
McDonald et al. Muscle Nerve. 2013.
-
2.
McDonald et al. Muscle Nerve. 2010.
-
3.
Goemans et al. Neuromuscul Disord. 2013.
-
4.
Brehm et al. PLoS One. 2014.
-
5.
Mercuri et al. Neuromuscul Disord. 2016.
T-012
A mechanistic PKPD model of mouse defecation for translation of water secretion and colonic motility
Jangir Selimkhanov1, Luana Griffin2, Yasuo Itomi2, Antonio Guy2, Jun Matsukawa2, Jill Wykosky2, Erica L. Bradshaw1, Ryan P. Nolan1
1Translational Research Group, DMPK, Takeda Pharmaceuticals, San Diego, CA, USA; 2Gastroenterology Drug Discovery Unit, Takeda Pharmaceuticals, San Diego, CA, USA.
Introduction/Objective: Pre-clinical animal models for gastrointestinal (GI) motility diseases (e.g. constipation, diarrhea) play an important role in drug discovery but are challenging to interpret and translate. Rodent models are commonly used, as they provide a system where fecal production and consistency can be measured. Measurements of fecal pellet output (FPO) and water content are frequently assumed to be correlated with colonic motility and water secretion, respectively. Physiologically, however, colonic motility and water secretion effects on FPO are not independent, which can lead to incorrect interpretation drug’s mechanism of action based on FPO study data. Whole GI transit time data along with water secretion measurements from a colonic loop study provide additional information that can explain drug’s mechanism of action. However, it is not always clear how endpoints from different studies fit together. A mathematical model provides a quantitative framework to evaluate multiple measurements comprehensively and to effectively assess drug’s mechanism of action.
Methods and Results: Here, we derive a pharmacokinetic/pharmacodynamic (PKPD) model of rodent FPO that integrates the mechanisms of water secretion and colonic motility. Parameter sensitivity analysis suggests that both water secretion and colonic motility influence fecal output and consistency, which makes FPO study endpoints problematic for identification of mechanism of action. We further show that rodent colon size can confound assessment of drug’s effect on colonic motility and suggest an update to the study design that, in concert with the PKPD model, can eliminate this mischaracterization. Finally, we validate the model by fitting it to colonic loop and FPO data for a known clinical compound, recapitulating the compound’s effects on GI transit time.
Conclusions: These analyses illustrate that a mechanistically-derived PKPD model is essential to properly characterize GI physiology and pharmacology, as well as a drug’s mechanism of action, for ultimate translation of pre-clinical rodent data to human.

Figure
T-013
Using Mechanistic Modeling to quantify ADC-anti-VEGF combination antitumor response: Impact of tumor vasculature changes on ADC tumor targeting
Jared Weddell, Manoj Chiney, Mohamad Shebley, John P. Gibbs
Clinical Pharmacology and Pharmacometrics, AbbVie Inc., North Chicago, IL, USA
Objectives: Antibody drug conjugates (ADCs) promise selective tumor targeting of potent small molecule agents. Anti-VEGF combination therapy has potential to improve drug tumor penetration and antitumor response1. The objective was to use a mechanistic modeling based approach to quantify effect of anti-VEGF therapy on ADC tumor biodistribution and tumor volume reduction (TVR) using T-DM1-bevacizumab combination as a case study.
Methods: A mechanistic model platform comprising (1) minimal PBPK model, (2) Krogh cylinder model, and (3) mechanistic TVR model was verified using clinical data for T-DM1, at the approved dose of 3.6 mg/kg Q3W, in metastatic breast cancer patients using MATLAB®. The biological effect of bevacizumab, at a clinical dose of 15 mg/kg Q3W, on tumor vasculature was captured using the Krogh cylinder model through changes in parameters pertaining to capillary density, interstitial fluid pressure, permeability, and tumor perfusion. The model did not incorporate independent bevacizumab effects on TVR.
Results: The ADC model met performance criteria in capturing T-DM1 monotherapy pharmacokinetics and objective response rate. For T-DM1-bevacizumab combination therapy, the model predicted that there is 14% greater TVR at 6 months than T-DM1 monotherapy. While combination and T-DM1 monotherapy equally killed tumor cells near the capillary, the combination therapy increased spatial T-DM1 tumor distribution, which resulted in 38% increased cell death farthest from the capillary. For hypothetical scenarios evaluated, there was significant impact of the choice of bevacizumab and T-DM1 dose on the predicted TVR for the combination.
Conclusions: Simulations based on a mechanistic ADC modeling platform predicted improved ADC tumor biodistribution with anti-VEGF combination therapy, relative to ADC monotherapy. Application of such mechanistic modeling approaches, by exploring hypothetical scenarios, can provide valuable insights into drug development strategies for combination therapies.
Funding: AbbVie provided financial support for the studies and participated in the design, study conduct, analysis, and interpretation of data as well as the writing, review, and approval of abstract.
Conflict of Interest: All authors are employees of AbbVie, Inc. and may hold stock or stock options.
Reference
-
1.
Cesca (2015) Mol Cancer Ther 15:125.
T-014
Development of a model to predict lean liver volume (LLV) for use in scaling drug clearance
Jaydeep Sinha 1, Stephen Duffull1, Bruce Green2, T. Ponnuswamy3, B. Devanand3, M. Ramanathan4, S. Ramalingam3, Hesham Al-Sallami1
1Otago Pharmacometrics Group, School of Pharmacy, University of Otago, Dunedin, New Zealand; 2Model Answers R&D Pty Ltd, Brisbane, Australia; 3PSG Institute of Medical Sciences and Research, Coimbatore, India; 4PSG College of Pharmacy, Coimbatore, India
Objectives: For hepatically-cleared drugs, clearance (CL) is known to correlate with liver size [1]. Theoretically, the lean portion of the liver (lean liver volume, LLV) is the metabolically active part of the liver and may be a better scaler of CL than total liver volume. The aim of this work was to develop a model for LLV from readily-measurable patient variables.
Methods: LLV data (single measurement) were derived by subtracting the liver fat from the total liver volume, measured by computed tomography in 100 adult Indian participants [2]. A model for LLV was developed using NONMEM v7.3 and the following covariates: weight (WT), fat-free mass (FFM), SEX, clinical chemistry, and liver and kidney function markers. Model selection was performed using the likelihood ratio test. Initially, allometric scaling of body size and composition covariates (WT and FFM) was done by estimating the population LLV (θ LLV) and exponent (θ COV) with and without the addition of SEX, then other variables were tested using stepwise covariate modelling (SCM). The final model was evaluated using visual predictive checks and non-parametric bootstrap analysis.
Results: The only significant covariates were WT, FFM and SEX. WT was statistically preferred to FFM but was indistinguishable from the combination of FFM and SEX. However, a subgroup analysis of the overweight and obese patients indicated a preference for FFM and SEX. The θ LLV estimates were 1440 (95% CI: 1381–1499) and 1280 (95% CI: 1187–1373) mL for male and female participants respectively, The θ COV estimate of FFM was 1.01 (95% CI: 0.80 to 1.20).
Conclusions: A model to predict LLV from SEX and FFM was developed and evaluated. The model could be considered as a potential scaler of individual drug dosage.
Encore: The results in this abstract have been previously presented in part at [PAGANZ 2018, Melbourne, Australia 6–7th Feb, 2018] and published in the conference proceedings as abstract.
References
-
1.
Murry et al. Drug metabolism and disposition. 1995;23(10).
-
2.
McLeay et al. Open Obesity Journal. 2014;6(1).
T-015
A Quantitative Systems Pharmacology Model of Glucose-Insulin Regulation to Guide the Design and Evaluation of Novel Basal Insulins with Optimal Risk–Benefit Profile
Jeanne Geiser, Parag Garhyan, Jenny Chien
Eli Lilly and Company, Indianapolis, IN, USA
Objectives: To evaluate the effects of differential hepatic to peripheral tissue distributions of basal insulins using a Quantitative Systems Pharmacology (QSP) model with glucose-insulin regulation and metabolism (endogenous glucose production [EGP], glucose disposal rate [GDR]), hypoglycemic risk and subsequent glycemic control in patients with type 1 diabetes (T1DM) and type 2 diabetes (T2DM).
Methods: A QSP model of glucose regulation was developed previously1. Basal insulins with similar pharmacokinetic profiles but different tissue distribution properties were evaluated in the model, ranging from balanced hepatic to peripheral activity ratio, to primarily hepatic acting or primarily peripherally acting. Two 26 week parallel-arm studies in T1DM and T2DM (insulin-naïve or on basal insulin) populations were simulated to compare these basal insulins in terms of glucose, HbA1c, and hypoglycemic rates. Insulin dose titration followed the modified Riddle algorithm 2 with compliance ranging from 70 to 90%.
Results: Simulations show an expected difference in EGP and GDR based on tissue distributions. Trial simulations show that, following treatment to basal insulins with different tissue distributions, different ratio of hepatic to peripheral activity led to different HbA1c reduction and hypoglycemia rates. The basal insulin with greater peripheral action achieved less HbA1c reduction, but with higher incidence of hypoglycemia, compared to a hepatically active and peripherally restricted basal insulin in both T1DM and T2DM.
Conclusions: A QSP model with physiological parameters is a valuable research tool to aid in the understanding of the mechanisms of action and alternative dosing strategy for a novel insulin. A basal insulin with attenuated peripheral activity relative to liver may provide optimal risk–benefit profile over existing basal insulins.
References
-
1.
Kumar R, et al., J Pharmacokinet Pharmacodyn (2014) 41(suppl 1): M-028.
-
2.
Riddle MC, et al., Diabetes Care (2003) 26: 3080–3086.
T-016
Integration of Population Exposure–Response and Physiological Based Pharmacokinetics Modeling Approaches to Evaluate Gastric-Emptying Induced Drug Interaction Risks for Dulaglutide
Lai-San Tham1, Karen B Schneck2, Jeanne S Geiser2, Maria Posada2 and Gemma Dickinson2
1Lilly Centre for Clinical Pharmacology, Singapore; 2Eli Lilly and Company, Indianapolis
Objectives: Use an integrated population exposure–response (ER) and physiologic-based pharmacokinetics (PBPK) modeling approach to assess the impact of delayed gastric emptying (GE) from a single 4.5 mg subcutaneous (SC) dose of dulaglutide on the systemic exposures of coadministered oral medications (acetaminophen, digoxin, lisinopril, metformin and s-warfarin).
Methods: Acetaminophen and dulaglutide PK data were fitted using nonlinear mixed effects modeling (NONMEM version 7.3.0). The effect of dulaglutide was introduced as a delay on acetaminophen’s GE rate constant from the stomach to small intestine. A ratio of the time for 50% of acetaminophen to remain in the stomach with and without dulaglutide coadministration (RT50) was derived. Separate dose–response curves for RT50 were constructed over the weekly SC dulaglutide dose ranges 0.05 mg to 8 mg in type 2 diabetics and 1 to 3 mg in healthy subjects. Model predictions of dulaglutide and acetaminophen PK were then qualified against historical data. Next, PBPK models for acetaminophen, digoxin, lisinopril, metformin and s-warfarin from the Simcyp software (version 16) were implemented to derive their respective maximum exposures (Cmax) and area under concentration–time curve (AUC) with and without 1.5 mg dulaglutide. Each PK model was qualified with observed Cmax and AUC values from historical drug–drug interaction studies. Finally, the RT50 for a 4.5 mg dulaglutide dose was introduced to the mean GE time of each qualified model to predict the Cmax and AUC of these medications when coadministered with 4.5 mg dulaglutide.
Results: The integrated ER/PBPK approach simulated dulaglutide 4.5 mg lowered Cmax for some coadministered oral agents with geometric mean ratios between 0.53 to 0.96; AUC ratios were between 0.76 to 1.00 (Table 1). These ratios were within the PK parameter variabilities of the coadministered medications.
Conclusion: AUC (0–24) ratios with and without 4.5 mg dulaglutide approximated 1 (90% confidence intervals between 0.8–1.25) for all medications. Dose adjustment may be unnecessary for coadministration with dulaglutide.
Table 1 Summary of AUC and Cmax Ratios for Coadministered Drugs with and without 4.5 mg of Dulaglutide
Geometric mean Cmax ratio (90% CI) | Geometric mean AUC ratio (90% CI) | |
|---|---|---|
Acetaminophen (0–24) | 0.53 (0.50, 0.57) | 0.93 (0.86, 1.00) |
Acetaminophen (0–12) | 0.53 (0.50, 0.57) | 0.76 (0.71, 0.81) |
Digoxin (0–24) | 0.66 (0.64, 0.69) | 0.98 (0.93, 1.03) |
Lisinopril (0–24) | 0.96 (0.90, 1.03) | 0.99 (0.92, 1.06) |
Metformin (0–24) | 0.88 (0.683, 0.93) | 1.00 (0.94, 1.07) |
S-Warfarin (0–inf) | 0.78 (0.74,0.82) | 0.99 (0.86,1.15) |
T-017
Visualization of Complex Trial Data in Non-Linear Mixed-Effect Analyses with Covariates
Jos Lommerse1*, Michelle Green1, Antonios Aliprantis2, Lynn Finelli2, Amy Espeseth2, Jeffrey R. Sachs2*
1Certara Strategic Consulting, Princeton, NJ, USA, 2Merck Research Laboratories, Kenilworth, NJ, USA.
*Equal Contributors
Objectives: When models/data are trellised by covariate value, apparent sparsity of data raises, for those less familiar with modeling, concerns about model quality. To provide a more intuitive presentation of the model, we needed a novel approach to visualizing model-based analyses with multiple covariates. This would allow the team to provide critical input to the model, and to use it for decision-support.
Methods: Published trial data were collected and a sigmoidal relationship between a pharmacodynamic biomarker and disease incidence rate was established in a model accounting for covariates including population, mechanism, disease severity, adjuvant, and between-trial variability. To allow the model and data to be consistently and intuitively presented in a single plot required normalization and scaling for covariate effects (Figure) by (1) correcting for between-trial variability, (2) shifting the raw data and predicted curves to the curve for a common population, and (3) scaling for different maximum incidence rates across populations and levels of disease severity. This method presents residuals in a manner visually consistent with residuals in plots trellised by covariate levels and is related to the prediction/correction method [1].
Results: Summary level trial data were modelled using non-linear mixed-effects, revealing decreasing disease incidence rates with increasing biomarker values. Starting discussions with the single plot described above (Figure) enabled the team to understand how data were integrated into a coherent model. The plot could then be trellised by covariates to discuss covariate effects and use of the model.
Conclusions: The method facilitated consistent visualization of a multi-covariate model and complex data set in a single, intuitive plot. This enabled the team to understand and provide input to the model and to use it to inform decisions.

Reference
-
1.
Bergstrand, M. et al., Prediction-corrected visual predictive checks for diagnosing nonlinear mixed-effects models. AAPS J. 2011 Jun;13(2):143–51.
T-018
Potential Pharmacodynamic Drug Interaction Between Lanadelumab and Drugs Commonly used in Patients with Hereditary Angioedema
Claudia Jomphe1, Nathalie Gosselin1, JF Marier1, Patrick Martin2, Yi Wang2
1Certara Strategic Consulting, Montreal, QC, Canada; 2Shire, Lexington, MA, USA
Objectives: Lanadelumab, a fully human monoclonal antibody of plasma kallikrein (pKal), is being developed for prophylactic treatment against angioedema attacks in patients with hereditary angioedema (HAE). A marked suppression of levels of cleaved high-molecular weight kininogen (cHMWK), a product of active pKal, was reported following lanadelumab treatment in patients with HAE. We assessed potential pharmacodynamic drug interactions (impact on cHMWK levels) between lanadelumab and drugs commonly used to treat breakthrough attacks or symptoms commonly experienced in patients with HAE.
Methods: The effect of concomitant medications for treating breakthrough HAE attacks (i.e., C1 esterase inhibitor, ecallantide and icatibant) or symptoms of HAE (i.e., analgesic, antibacterial, antihistamine, anti-inflammatory and antirheumatic drugs) on cHMWK levels was evaluated. The minimum response (Rmin) of cHMWK (as defined by resultant cHMWK levels) when steady state concentrations of lanadelumab greatly exceeded IC50 were derived.
Results: Concomitant use of C1 esterase inhibitor, an endogenous inhibitor of pKal, had a slight additive effect on lanadelumab (Rmin values with and without C1 esterase inhibitor were 13.4% and 15.0%, respectively). Concomitant use of ecallantide, a polypeptide pKal inhibitor, also had an additive effect on lanadelumab (Rmin values with and without ecallantide were 10.9% and 15.1%, respectively) due to the high affinity of ecallantide for pKal and the expected inhibition of cHMWK formation. Consistent with the mechanism of action of icatibant (bradykinin receptor antagonist, which impacts downstream of cHMWK production), concomitant use of icatibant did not affect cHMWK levels. Drugs used for treatment of symptoms of HAE did not affect cHMWK levels.
Conclusions: These results suggest that drugs which modulate/inhibit pKal that are commonly used to treat breakthrough attacks (i.e., C1 esterase inhibitor or ecallantide) are expected to provide an additive effect in reducing cHMWK levels while drugs commonly used to treat symptoms of HAE have no effect.
T-019
Pharmacokinetic/Pharmacodynamic Analysis of Lanadelumab in Patients with Hereditary Angioedema (HAE)
Colin Chang1, Elliot Offman1, JF Marier1, Patrick Martin2, Yi Wang2
1Certara Strategic Consulting, Montreal, QC, Canada; 2Shire, Lexington, MA, USA
Objectives: Lanadelumab, a fully human monoclonal antibody of plasma kallikrein (pKal), is being developed for prophylactic treatment against angioedema attacks in patients with hereditary angioedema (HAE). Dysregulation of the contact system and excess pKal-mediated bradykinin generation is associated with edematous attacks. Cleaved high-molecular weight kininogen (cHMWK), a product of active pKal, has been evaluated as a potential biomarker for the treatment effect of lanadelumab in patients with HAE. The PK/PD relationship between lanadelumab concentrations and cHMWK levels following subcutaneous lanadelumab injections in HAE patients and healthy subjects was assessed.
Methods: Population PK/PD analysis was performed in 207 subjects using nonlinear mixed effect modeling and sources of variability (race, health status, HAE attack within 12 h) were explored via a stepwise covariate analysis.
Results: An indirect-response model was used for the PK/PD modeling of cHMWK. Typical Kin and Kout (representing the formation and degradation rates of cHMWK) were 11.8%/h and 0.367 h−1, respectively. Typical Imax was 53.7%, indicating that lanadelumab is expected to suppress cHMWK levels through a 53.7% inhibition of Kin. Inhibition of pKal by lanadelumab was reversible as shown by the slow return of cHMWK levels to baseline. Healthy subjects had a significantly lower rate of cHMWK formation. Cmin,ss associated with the lanadelumab 150 mg Q4W and 300 mg Q4W dosing regimens (4810 and 8770 ng/mL, respectively) were close to the IC50 of cHMWK (5705 ng/mL). In contrast, Cmin,ss associated with the 300 mg Q2W dosing regimen (25400 ng/mL) was approximately 4.5-fold higher. 85% of patients treated with lanadelumab 300 mg Q2W presented average concentrations greater than the IC90 (18777 ng/mL) of cHMWK.
Conclusions: Maximum suppression of cHMWK was observed for the 300 mg Q2W dosing regimen. Suppression of cHMWK levels (via inhibition of pKal) is expected to reduce bradykinin formation, and ultimately prevent the events leading to attacks.
T-020
Quantitative Systems Pharmacology (QSP) Model of Bispecific T-Cell Engaging Antibody Constructs for Acute Myeloid Leukemia Treatment
Oleg Demin Jr1, Svetlana Rubina1, Theresa Yuraszeck2, Khamir Mehta2, Vaishali Chudasama2, Matthias Klinger3, Cedric Dos Santos2, Oleg Demin1, Sergey Ermakov2
1InSysBio, Moscow, Russia; 2Amgen, CA, USA; 3Amgen Research (Munich), Germany
Objectives: Antibody-based bispecific molecules are a novel class of immunotherapies including blinatumomab, a CD19/CD3 bispecific T-cell engager (BiTE®) approved for relapsed/refractory (R/R) acute lymphoblastic leukemia. By using available knowledge on blinatumomab we have developed a QSP model describing interactions of cellular and molecular pathways in hematologic malignancies including acute myeloid leukemia (AML). We investigated factors affecting outcomes of a CD33/CD3 BiTE® administration in AML.
Methods: Our model describing interactions between normal hematopoietic and cancer cells along with relevant molecular and cytokine pathways was developed by using the Immune Response Template (IRT) software [1]. The model describes the hematopoiesis of normal myeloid cells (neutrophils, platelets, etc.), leukemic blasts, leukemic stem cells, CD4+ and CD8+ T-cell subsets, and cytokines (IL-6, IL-10, IFN-γ, etc.) in bone marrow and plasma. Blinatumomab PK/PD data were used for model development and calibration followed by appropriate, target-specific modifications to predict treatment outcomes in AML.
Results: Our model simulates clinically relevant BiTE® hallmark data including T-cell subset dynamics and cytokine release post infusion. The model successfully describes the clinically observed phenomenon on progressive cytokine release attenuation with subsequent treatment cycles. It confirmed the dose step strategy for decreasing initial cytokine release. The model facilitated the creation of virtual patients that can simulate the disease and the efficacy in patients with newly diagnosed or relapsed/refractory AML treated with CD33/CD3 BiTE®. Local and global sensitivity analysis showed that treatment outcome is very sensitive to target expression, immune cells, immune checkpoint molecules and disease progression.
Conclusions: We developed a model to quantify treatment effects of BiTE® in hematologic malignancies, particularly AML. Future preclinical and clinical data involving bispecifics will further refine the model to enable quicker testing and optimization of treatment regimens for BiTE® therapies, as mono and in combination with other immunotherapies.
Reference
-
1.
A. Nikitich, O. Demin Jr, O. Demin. ASCPT 2016.
T-021
Development of a Physiologically Based Pharmacokinetic Model for Losartan and Its Active Metabolite E3174 - Ethnic Differences in Pharmacokinetics between Caucasian and Asian Populations
Jin Dong, Grazyna Fraczkiewicz, Viera Lukacova, Michael B. Bolger
Simulations Plus, Inc., 42505 10th Street West, Lancaster, California 93534, USA
Objectives: Losartan is a selective, competitive angiotensin II receptor type 1 (AT1) antagonist for hypertension treatment. Although losartan itself is pharmacologically active, its primary metabolite, E3174, produced by CYP2C9 and CYP3A4 enzymes, has higher potency and a longer half-life. Ethnic differences in E3174 exposure have been observed between Caucasian and Asian subjects, which cannot be explained by genetic polymorphism of CYP2C9 alone. A validated losartan and E3174 model was developed to investigate the sources of ethnic differences in E3174 pharmacokinetics.
Methods: A physiologically-based pharmacokinetic (PBPK) model for losartan and E3174 was previously developed by another group based on the in vitro data [1]. In this study, the published model [1] was extended by adding kidney transporter, gut P-glycoprotein and optimizing liver transport kinetics in GastroPlus™ 9.5. The extended final model was validated using plasma and urinary excretion data after IV and PO administration from several studies in Caucasian subjects. The model for Asian population with adjusted transporter kinetics was developed under the assumption that the ethnic differences in E3174 pharmacokinetics are caused by different expression levels of transporters responsible for the distribution and elimination of E3174.
Results: The developed baseline PBPK model accurately captured both parent and metabolite plasma profiles and renal excretion data in Caucasian subjects. A single PBPK model with adjusted expression levels of OATP and MRP transporters in liver was able to reproduce the plasma concentration–time profiles for different doses after single and multiple oral administrations in the Japanese population (Figure 1).
Conclusions: The ethnic differences in the pharmacokinetics of E3174 could be driven by differences in transporter kinetics, and not metabolism, between these two populations.

References
-
1.
Nguyen HQ, et al. (2017). Journal of Pharmaceutical Sciences. 106.9 (2017): 2758–2770.
T-022
Integrated analysis of paclitaxel-birinapant pharmacodynamic interactions in pancreatic cancer cells
Jin Niu1, Xue Wang2,3, Jun Qu1,2, Robert M Straubinger1,2,3, Donald E Mager1
1Department of Pharmaceutical Sciences, 2Center of Excellence in Bioinformatics and Life Sciences, University at Buffalo, SUNY, 3Department of Cell Stress Biology, Roswell Park Comprehensive Cancer Center.
Objective: Birinapant, a bivalent mimetic of Second Mitochondrial Activator of Caspases (SMAC), synergizes with paclitaxel to inhibit Panc-1 cell viability [1]. This study investigated the mechanisms underlying the observed synergy.
Methods: The effects of combined birinapant-paclitaxel on the kinetics of Panc-1 cell growth, cell cycle distribution and apoptosis were quantified, as was the expression of key proteins involved in these processes. A mechanism-based, multi-scale mathematical model was developed to integrate these data quantitatively and to recapitulate the synergistic inhibition of cell growth.
Results: Dose-dependent G2/M phase arrest and cell polyploidy were observed in response to paclitaxel alone. Birinapant (150 nM) decreased the number of cells arrested in G2/M by 34% after exposure of paclitaxel (15 nM) for 17 h and potentiated paclitaxel-induced apoptosis by 22% at 72 h. These cellular changes were mediated by paclitaxel-induced spindle assembly checkpoint proteins such as ELYS and SKAP, and birinapant-induced c-IAP1 degradation and NF-kB signaling. Only the drugs in combination increased the pro-apoptotic protein pJNK and reduced the anti-apoptotic protein Bcl2. Consequently, the Bcl2/BAX ratio decreased to 0.33 fold in combination. The apparent synergy observed in reduction of cell number could be attributed to changes in proteins and signaling regulating cell death and the cell cycle.
Conclusion: This integrated analysis demonstrated that the synergy between birinapant and paclitaxel is likely mediated by birinapant-induced apoptosis of mitotically-arrested cells, possibly due to reduction of the Bcl2/BAX ratio.

Reference
-
1.
Wang, X., Niu, J., Li, J., Shen, X., Shen, S., Straubinger, R. M., & Qu, J. (2018). Temporal Effects of Combined Birinapant and Paclitaxel on Pancreatic Cancer Cells Investigated via Large-Scale, Ion-Current-Based Quantitative Proteomics (IonStar). Molecular & Cellular Proteomics, 17:655–671.
T-023
“External Validation” of Extrapolation of Efficacy from Adult to Pediatric Patients ≥ 4 Years of Age with Partial Onset Seizures (POS): Pregabalin Example
Jing Liu1, Phylinda LS Chan2, Scott Marshall2, Lynn McFadyen2, Verne Pitman1, Lloyd Knapp1
1Pfizer, Inc., Groton, CT, USA; 2Pfizer, Limited, Sandwich, United Kingdom.
Objectives: The recently completed Lyrica® (pregabalin) pediatric efficacy study in POS (A0081041) was initiated before acceptance by FDA of efficacy extrapolation from adult to pediatric patients ≥ 4 years old with POS [1]. Population pharmacokinetics (PK) and exposure–response (E-R) analyses were performed to compare pregabalin exposure and E-R relationships in pediatric and adult patients, and to support dosing recommendations for pediatric patients ≥ 4 years old with POS.
Methods: Pregabalin PK from pediatric and adult studies were jointly analyzed using a 1-compartment model with first-order elimination and absorption with a lag time. The relationships of pregabalin apparent clearance and volume of distribution with body size across pediatric and adult subjects with normal renal function were accounted for by allometric relationships with weight. The relationship between pregabalin average concentration and log-transformed 28-day seizure rate in pediatric and adult patients with POS was described with an Emax model with a common Emax as the sum of population specific placebo effect and maximum drug effect, a common EC50, and separate baseline and placebo effects for the 2 populations.
Results: In pediatric patients ≥ 4 years old, pregabalin 2.5 to 10 mg/kg/day for weight ≥ 30 kg or 3.5 to 14 mg/kg/day for weight < 30 kg achieved similar pregabalin exposure to that of adult patients receiving approved doses of 150 to 600 mg/day, respectively. The E-R relationship of pregabalin was similar across pediatric ≥ 4 years old and adult patients with POS after accounting for differences in baseline seizure rate and placebo effect.
Conclusions: The results are consistent with the exposure and E-R similarity in the 2 populations previously established with other anti-epileptic drugs to support efficacy extrapolation from adults to pediatrics ≥ 4 years old [1], and supported the approved FDA label for Lyrica® in pediatric patients ≥ 4 years old with POS.
Reference
-
1.
J Pediatr Pharmacol Ther 2016;21:98.
T-024
Mechanistic QSP models combined with machine learning can accurately translate cardiac myocyte drug responses to multiple populations
Jingqi Q.X. Gong, Eric A. Sobie
Department of Pharmacological Sciences, Icahn School of Medicine at Mount Sinai, New York, NY, 10029 USA
Objectives: Cardiac myocytes derived from human induced-pluripotent stem cell (hiPSC-CMs) hold great potential as a platform to screen drugs for beneficial or deleterious cardiac effects. A major limitation of hiPSC-CMs, however, is that the cells exhibit immature physiology compared to adult ventricular myocytes. We sought to translate drug responses from hiPSC-CMs to healthy and diseased adult cardiac myocytes through a combination of mechanistic and statistical mathematical modeling.
Methods: Mechanistic simulations, using Quantitative Systems Pharmacology (QSP) models, were performed in heterogeneous model populations of hiPSC-CM and adult ventricular myocytes. Physiological metrics were quantified from both populations, and multivariable linear regression was used to develop a predictive model translating drug responses from hiPSC-CM to adult myocyte. Prediction accuracy was validated with simulated effects of selective and non-selective ion channel blockers.
Results: The cross-cell type regression model predicted human myocyte action potential and calcium transient metrics (duration, amplitude, etc.) from hiPSC-CM responses with quantitative accuracy (R2 = 0.93). When tested with selective or non-selective ion channel blockers, the model predictions outperformed direct approximation from hiPSC-CMs responses. For instance, to predict APD90 alteration in response to drugs, error for Amiodarone was reduced by 92.5%, error for Quinidine was reduced by 61.3%. Overall, across 30 drugs, the median prediction error was reduced by 81.48%. In addition, this approach could simultaneously translate drug responses from hiPSC-CMs to failing adult myocytes and successfully predict differential responses between the healthy and diseased populations.
Conclusions: Quantitative accurate predictions of human adult myocyte drug responses can be derived from hiPSC-CMs using cross-cell type regression modeling, which complements the efforts to optimizing and maturating hiPSC-CMs platform and improves its utility. The approach can accurately predict how drugs induced different effects in healthy versus diseased patient populations.
T-025
Implicit and efficient handling of missing covariate information using full random effects modelling
Joakim Nyberg1, Mats O. Karlsson1,2 and Niclas E. Jonsson1
1Pharmetheus, 2Department of Pharmaceutical Biosciences, Uppsala University
Objectives: Investigate missing covariate data properties with the full random effects modelling (FREM) approach [1].
Methods: A model developed (bi-exponential model with drifting baseline, parameterized with 6 parameters; BASE, BASESL, BP, HLKOFF, HLKON and PLMAX with SEX, birth length (BL) and birth weight (BW) as covariates on all parameters, to describe the height-for-age Z-score in children (0–15 years) in low and middle income countries was used to investigate estimation properties with different missing covariate patterns. Observed covariates and realized design (~ 8 samples/per child) from an Indian cohort (n = 6626) was used to sample individuals with complete covariate information. The full fixed effects model (FFEM) model was used to simulate 1000 datasets with 1000 children in each dataset with different levels of missing covariate information at random; 0, 10, 30, 70 and 90%. A FREM model and a FFEM were used to re-estimate the model given the simulated datasets, and bias and precision were visualized. Missing covariates were imputed using the median value in the FFEM models. With FREM, missing covariates were treated as missing.
Results: Overall, the estimates of the covariate coefficients were not biased using the FREM, even with 90% missing covariate information, while median imputation using FFEM biased the coefficients (fig 1). In general the magnitude of the bias in FFEM were related to the percent missing. Precision was affected (decreasing precision with increasing percentage missing) both for FFEM and FREM but more pronounced with the FFEM approach.

Fig. 1 Standard deviation (SD) normalized difference between true and estimated (n = 1000) covariate coefficients, stratified by level of missingness and estimation model.
Conclusions: FREM improves the estimation properties when handling missing data compared to median imputation with FFEM.
Reference
-
1.
M. O. Karlsson A full model approach based on the covariance matrix of parameters and covariates. PAGE 21 (2012) Abstr 2455 [www.page-meeting.org/?abstract=2455].
T-026
Population Pharmacokinetic/Pharmacodynamic Evaluation of the Effect of Glasdegib on QT Interval in Healthy Adult Subjects
Joanna C. Masters and Naveed Shaik
Pfizer Global Product Development, San Diego, CA, USA
Objectives: Glasdegib (G), a selective inhibitor of Smoothened (SMO), is being developed for acute myeloid leukemia (AML)/high-risk myelodysplastic syndrome (MDS) indications. Based on QT signals in early clinical studies, a thorough QT (TQT) study was conducted in healthy subjects. The objective of this population pharmacokinetic-pharmacodynamic (PK-PD) analysis was to characterize the exposure–response (E-R) relationship between QTc and G plasma concentrations based on TQT study data.
Methods: Characterization of the QTc-concentration relationship included (a) evaluating effect of G on RR interval, (b) estimating study-specific heart rate correction factor for QT (QTcS), (c) assessing appropriateness of correction factors, (d) characterizing E-R relationship between baseline-adjusted QTc (∆QTc) and G concentration, and (e) estimating model-derived baseline and placebo-adjusted QTc (∆∆QTc).
Results: PK and ECG data were available from 35 male Caucasian subjects from 3 treatment periods: placebo, G 150 mg PO single dose (SD) (representing 100 mg daily [QD] therapeutic dose), and G 300 mg PO SD (representing 200 mg QD supratherapeutic dose). Fixed correction factors adequately eliminated the effect of heart rate on QTc. The estimated exponent to calculate QTcS was 0.25; QTcF was the primary endpoint. A pre-specified linear mixed effects model characterized the ∆QTcF-concentration relationship under both placebo and G treatment periods, with a positive mean slope estimate of 0.005 ms/ng/mL. No covariates were included in the analysis due to the homogeneous study population. The mean (90% CI) of the model-derived ∆∆QTcF at the clinical Cmax values corresponding to therapeutic (100 mg QD) and supratherapeutic (200 mg QD) doses were 7.3 ms (6.5 to 8.2) and 13.7 ms (12.0 to 15.5), respectively.
Conclusions: Glasdegib treatment is not expected to have a large effect (≥ 20 ms) on QTcF at clinical exposures.
T-027
Pharmacodynamics of rituximab on B cells in paediatric patients with immune disorders
Shan Pan (1), Huixin Yu (1, 2), Ayesha Surti (3), Iek Cheng (4) Depina Eleftheriou (1), Joseph F Standing (1, 4)
(1) UCL Great Ormond Street Institute of Child Health, London, United Kingdom, (2) Novartis Pharma AG, Basel, Switzerland, (3) UCL School of Pharmacy, London, United Kingdom, (4) Department of Pharmacy, Great Ormond Street Hospital for Children, London, United Kingdom
Objectives: Rituximab is a chimeric IgG-1 monoclonal antibody that depletes B cells, aiding in the treatment of several conditions including autoimmune and immunodeficiency diseases. It is not licensed for use in children but administered off-label. The current study aimed to identify the pharmacodynamics of rituximab in children with immune disorders in order to optimise the dosing regimen.
Methods: Electronic data of children prescribed with rituximab at Great Ormond Street Hospital, London, United Kingdom were collected from a retrospective and anonymised study. Two intravenous infusions of rituximab, each at a dose of 750 mg/m2 with maximum dose of 1000 mg, were given at day 1 and 15 within 6 months. Plasma concentrations of rituximab were not available. CD19+ B cell counts were measured before and after rituximab treatment. A turnover model was constructed in NONMEM® (version 7.3) to describe the life cycle of CD19+ B cells considering the effect of rituximab on increasing the death rate of CD19+ B cells. Rituximab was assumed to be eliminated by first-order kinetics.
Results: 296 measurements of CD19+ B cell counts were collected from 46 children with 13 different immune diseases. The 2-compartment model well described the time course of CD19+ B cells following rituximab administration. The elimination half-life of rituximab and CD19+ B cells were estimated to be 18 and 40 days, respectively; these findings were consistent with that reported from the literature [1,2]. Methotrexate and cyclophosphamide were found to increase the killing effect by 62% and 33%, respectively. Other covariates such as age and gender were not found significant.
Conclusions: The findings from the current study will be used to establish dosing regimens of rituximab for treating children with immune diseases.
References
-
1.
Ng et al. J Clin Pharmacol. 2005;45(7):792–801.
-
2.
Fulcher and Basten. Immunol Cell Biol. 1997;75(5):446–55.
T-028
Clinical Pharmacokinetic (PK) Analysis of SJ733, an Oral Inhibitor of P. falciparum ATP4 (PfATP4), Combined with the PK Enhancer (CYP3A Inhibitor) Cobicistat
John C. Panetta1, Burgess B. Freeman III1, R. Kip Guy2, Tracy B. Stewart1, Ronald Dallas1, Kristen C. Branum1, Li Tang1, Shelley Ost3, Nehali D. Patel1, Ryan N. Heine1, Elizabeth John4, Stephan Chalon5, Julie L. Richardson1, Robbin Christensen1, Andrew Slade5, Patricia M. Flynn1, Fabian Gusovsky6, Aditya H. Gaur1
1St. Jude Children’s Research Hospital, Memphis, TN, USA; 2University of Kentucky College of Pharmacy, Lexington, KY, USA; 3University of Tennessee, Memphis, TN, USA; 4EJOHN Consulting, Richland, WA, USA; 5Medicines for Malaria Venture, Geneva, Switzerland; 6Eisai Inc., Andover, MA, USA
Objectives: Phase 1 studies suggested that single oral doses of the novel PfATP4 inhibitor SJ733 will provide insufficient exposures to drive complete parasite clearance. SJ733 is highly metabolized to SJ7506 (inactive N-oxide metabolite) by CYP3A. In an effort to increase single dose exposure of SJ733, we evaluated SJ733 PK with concomitant dosing of the oral CYP3A inhibitor cobicistat in healthy subjects.
Methods: Pharmacokinetics were conducted as part of a Phase 1a adult healthy volunteer study (ClinicalTrials.gov: NCT02661373). A total of 9 fasted cohorts (54 studies) were treated with either single dose SJ733 (75–1200 mg) alone or concomitantly with single dose cobicistat (150 mg; FDA-approved pharmacoenhancing dose for HIV). A two-compartment model with sequential zero- first-order absorption described SJ733 and SJ7506, while a one-compartment model with first-order absorption described cobicistat. The inhibitory effects of cobicistat on SJ733 and SJ7506 PK were linked using a nonlinear relationship. Pharmacokinetic parameters were estimated using NLMEM (Monolix 2018R1). Individual post hoc estimates were used to calculate AUCs and time above a plasma efficacy threshold concentration (150 ng/mL).
Results: The apparent clearances (CL/F) of SJ733 and SJ7506 in cohorts without cobicistat were constant through 600 mg, but were increased at higher doses (p < 10−6). This translated to a less-than-proportional increase in exposure for doses above 600 mg secondary to suspected saturable absorption. In addition, SJ733 was highly metabolized to SJ7506 with a median MR of 1.7. Cobicistat elicited an increase and decrease in SJ733 and SJ7506 exposure respectively, significantly decreasing the MR by 78% (1.7 to 0.37, p < 10−9). This translated to a median 28% increase in time above 150 ng/mL in the cobicistat cohorts.
Conclusions: This novel approach of using a pharmacoenhancer with short term antimalarial therapies was the first to show that they can favorably alter the exposure of developmental candidates highly metabolized by CYP3A.
T-029
Population Modeling of Exposure–Response (E-R) for Select Safety Endpoints in Non-Small Cell Lung Cancer Patients Receiving Lorlatinib
Joseph Chen, Ana Ruiz, Lee James, Holger Thurm, Gerson Peltz, Yazdi K. Pithavala
Pfizer Inc.
Objectives: Lorlatinib is a small molecule inhibitor of the ALK and ROS1 receptor tyrosine kinases. The objectives of this analysis were to assess the relationship between lorlatinib pharmacokinetic (PK) exposure and safety endpoints of interest and to evaluate the effect of covariates in the exposure–response (E-R) relationships using data from patients with advanced ALK-positive or ROS1-positive NSCLC.
Methods: The data in this analysis was from an ongoing lorlatinib clinical study (NCT01970865) in patients with advanced ALK-positive or ROS1-positive NSCLC (n = 328). Plasma exposure parameters were estimated using a lorlatinib population PK model from pooled healthy volunteers and cancer patient data. The E-R analyses were performed using generalized binomial logistic regression, using R version 3.2.2. The base model included relevant baseline laboratory parameters and the time to event (DAY1). The lorlatinib exposure parameter was then selected by a univariate screen, based on significance of the coefficient (p < 0.05) and the largest change in model deviance. If no parameter coefficient was significant, the modeling analysis was carried forward without an exposure parameter. The full model was then subjected to a backward elimination algorithm for retention of covariates in the final model, using a criterion of change in deviance ≥ 6.63 (p ≤ 0.01). Final model adequacy and predictive performance were assessed.
Results: Table 1 presents the final model results from the E-R analysis.
Table 1 Exposure response final model results
Endpoint | n/N | Variables | Odds Ratio | Estimate | 95% CI | p > |z| | ΔD |
|---|---|---|---|---|---|---|---|
Hypercholesterolemia Grade ≥ 3* | 298/328 | Intercept | 7E-09 | − 18.829 | (− 30.4373, − 8.1449) | < 0.01 | 53.361 |
BCHOL | 1.029 | 0.029 | (0.0199, 0.0386) | < 0.01 | |||
DAY1 | 1.004 | 0.004 | (0.0001, 0.0069) | 0.04 | |||
ln(Cmaxevent) | 5.256 | 1.659 | (0.0762, 3.3330) | 0.05 | |||
Weight Gain Grade ≥ 2 | 328/328 | Intercept | 0.009 | − 4.757 | (− 6.3244, − 3.3327) | < 0.01 | 22.529 |
BWT | 1.030 | 0.029 | (0.0108, 0.0482) | < 0.01 | |||
DAY1 | 1.003 | 0.003 | (0.0013, 0.0050) | < 0.01 | |||
Hypertriglyceridemia Grade ≥ 3 | 298/328 | Intercept | 0.006 | − 5.113 | (− 6.4219, − 3.9792) | < 0.01 | 62.215 |
ASN1 | 2.749 | 1.011 | (0.2592, 1.7841) | < 0.01 | |||
DAY1 | 1.003 | 0.003 | (0.0004, 0.0055) | 0.02 | |||
BTG | 1.018 | 0.018 | (0.0130, 0.0243) | < 0.01 | |||
TEAE Grade ≥ 3 | 289/328 | Intercept | 3E-04 | -7.995 | (− 12.2153, − 4.0263) | < 0.01 | 55.680 |
BCHOL | 1.012 | 0.012 | (0.0058, 0.0191) | < 0.01 | |||
DAY1 | 1.012 | 0.012 | (0.0078, 0.0177) | < 0.01 | |||
ln(Ctrough ss) | 3.214 | 1.167 | (0.4012, 1.9725) | < 0.01 |
Conclusions: Lorlatinib plasma exposure was a statistically significant predictor for hypercholesterolemia Grade ≥ 3 and treatment emergent adverse event (TEAE) Grade ≥ 3.
T-030
Mechanistic model of the myeloablative effects of treosulfan and busulfan in pediatric patients undergoing bone marrow transplant
Belén P. Solans1,2, Robert Chiesa3, Iñaki F. Trocóniz1,2, Joseph F Standing4,5,6
1Pharmacometrics and Systems Pharmacology, Department of Pharmacy and Pharmaceutical Technology, School of Pharmacy, University of Navarra, Pamplona, Spain; 2IdiSNA; Navarra Institute for Health Research, Pamplona, Spain; 3Bone Marrow Transplantation Team, Great Ormond Street Hospital for Children, London, UK; 4Infection, Immunity, Inflammation Programme, UCL Great Ormond Street Institute of Child Health, London, UK; 5Department of Pharmacy, Great Ormond Street Hospital for Children, London, UK; 6Paediatric Infectious Diseases Group, St George’s, University of London, UK
Objectives: There is a debate surrounding the relative merits of busulfan (Bu) and treosulfan (Treo), which are used to deplete myeloid cells prior to hematopoietic stem cell transplantation (HSCT). The objectives of the study were to build a joint mechanistic PKPD model of neutrophil count over time and establish a relationship with Bu and Treo plasma concentrations, compare the myeloablative effects of both drugs in the shape of the PD effect curve and identify patient characteristics associated with the inter-individual variability in neutrophil dynamics.
Methods: Busulfan blood concentrations were available from samples acquired for routine drug therapeutic monitoring, and the Treo PK model was available from a previous study. Daily neutrophil count data until 3 months post-transplant was available. In total 11,555 observations from 152 pediatric patients (85-Bu, 67-Treo) were included. A PK/PD model was built simultaneously for both drugs integrating all the available data in NONMEM 7.3.
Results: a joint mechanistic PKPD model was successfully developed. The concentration vs time profiles of Bu and Treo were described by a two-compartment model for both drugs. The drug effects were modelled using an EMAX model for both of the drugs. System parameters (steady-state neutrophil count after transplant (CIRC0), mean transit time (MTT) and feedback parameter (GAMMA)) were consistent across drugs, being the estimates 1.29·109 neutrophils/L, 5.76 days and 0.089. The main difference between patients receiving different drugs was the baseline neutrophil value (4.09 for Bu vs 0.944 for Treo), different from CIRC0. The administration of steroids prior transplant, the administration of CGSF and the type of cells transfused were found to be significant covariates.
Conclusions: A joint mechanistic PKPD model linking drug exposure to Treo and Bu to the neutrophil reconstitution dynamics was successfully built. Further work is seeking to link early neutrophil dynamics to long-term outcomes such as transplant rejection.
T-031
Bridging from Intravenous to Subcutaneous Formulation of Tocilizumab for Optimal Dose Regimens in Systemic Juvenile Idiopathic Arthritis (sJIA)
Leonid Gibiansky1, Ekaterina Gibiansky1, Nicolas Frey2, Navita L. Mallalieu3, Claire Petry2, Jean-Eric Charoin2, Min Bao4, Christopher Mela5, Wendy Douglass5, Joy C. Hsu3
1QuantPharm LLC, North Potomac, MD, USA, 2Roche Pharma Research and Early Development, Roche Innovation Center, Basel, Switzerland, 3Roche Innovation Center, New York, NY, USA, 4Genentech, South San Francisco, CA, USA, 5Roche Products Limited, Welwyn Garden City, UK
Objectives: Confirm tocilizumab subcutaneous (TCZ-SC) dose regimens proposed for sJIA using a pharmacometrics approach.
Methods: TCZ is an anti–interleukin-6 receptor (IL-6R) monoclonal antibody. Intravenous TCZ (TCZ-IV) was approved for sJIA in 2011 based on the phase 3 TENDER study (randomized, double-blind study in sJIA patients aged 2–17 years; < 30 kg, 12 mg/kg [n = 46]; ≥ 30 kg, 8 mg/kg [n = 43] every-two-weeks [Q2W]). Exposure–response relationships between steady-state Ctrough (Ctrough,ss) and pharmacodynamic/efficacy parameters are well established for TCZ-IV in sJIA; therefore, bridging from IV to SC was based on Ctrough,ss. TCZ-SC-162 mg every-10-days (Q10D, < 30 kg) and weekly (QW, ≥ 30 kg) were recommended for JIGSAW-118, a phase 1b, open-label study investigating PK, PD, and safety following TCZ-SC in sJIA patients aged 1–17 years. At interim analysis (n = 28), bioavailability (94%) was estimated higher than in adult RA patients (80%). Based on simulations, the TCZ-SC regimen for patients < 30 kg was changed to Q2W. Upon study completion, TCZ serum concentration data (< 30 kg Q10D [n = 8], Q2W [n = 17]; ≥ 30 kg QW [n = 26]) were pooled with TENDER TCZ-IV data. Quantifiable serum samples (n = 1710) from 140 sJIA patients were analyzed using a two-compartment model with parallel linear and Michaelis–Menten elimination. Covariate analysis investigated factors that may influence TCZ disposition. Graphical analyses assessed effects of TCZ-SC exposure on pharmacodynamic biomarkers, key safety parameters, and exploratory efficacy measures.
Results: More than 95% of patients in JIGSAW-118 achieved Ctrough,ss higher than the 5th-percentile achieved with TCZ-IV. sIL-6R, C-reactive protein, and erythrocyte sedimentation rate responses were similar between TCZ-SC and TCZ-IV regimens. There was no apparent association between TCZ exposure and occurrence of serious adverse events (AEs), infection and infestation AEs, or neutropenia AEs. Variability in TCZ exposure was not associated with variability in Juvenile Arthritis Disease Activity Score-71 and Childhood Health Assessment Questionnaire-Disability Index.
Conclusions: Analyses confirmed tocilizumab 162 mg SC Q2W (< 30 kg) and QW (≥ 30 kg) are adequate for treatment of sJIA.
T-032
Usefulness of Population Pharmacokinetic Modeling and Simulations in Predicting Bioequivalence: BHV-0223, a Case Example
Julie Desrochers1, Olivier Barrière1, Sylvie Boudreault1, Pierre-Olivier Tremblay1, Irfan Qureshi2, Robert M. Berman2
1Syneos Health, Québec, QC, Canada; 2Biohaven Pharmaceuticals, Inc., New Haven, CT, USA.
Objectives: BHV-0223 is a sublingual formulation of riluzole designed to optimize pre-gastric absorption as compared to Rilutek tablet. The objective was to determine the optimal dose of BHV-0223 and sample size for achieving bioequivalence (BE) with Rilutek 50 mg using population pharmacokinetic (PK) and simulations.
Methods: Data from 10 healthy subjects of Phase I study were used to develop a basic population PK model of riluzole. The validated population PK model was then used to simulate 50 BE studies with different doses of BHV-0223 and sample sizes. Predicted and observed area under the curve (AUC) and maximum concentration (Cmax) were calculated using a non-compartmental method. Ratio and 90% confidence interval (CI) were calculated on ln-transformed AUCs and Cmax. The success rate was computed as the percentage of simulated 90% CI within 80–125%. The results from these simulations were used to design a BE study (BHV0223-102).
Results: A two-compartment model with first order absorption, lag time, and linear elimination provided the best fit for riluzole PK. The model parameters were estimated separately for BHV-0223 and Rilutek. Based on the simulations performed using this model, the best overall success rate (84%) was achieved with a dose of 40 mg and sample size of 140 subjects (Figure 1). While BHV-0223 tends to have lower AUCs but a greater Cmax than Rilutek, it was possible to optimally balance the two goals with this dose. The BE criteria were actually met in study BHV0223-102 as the 90% geometric CI of ln-transformed AUCs, and Cmax were respectively 87% to 92% and 106% to 120%, with 132 subjects included in the analysis, fully in line with the predictions
Conclusions: The population PK model adequately predicted that the BHV-0223 40 mg sublingual formulation is bioequivalent to Rilutek 50 mg tablet.

T-033
Model-Based Characterization of Ipilimumab PK in Pediatric Patients, and Extrapolation of Efficacy to Adolescent Melanoma Patients
Jun Shen*, Yan Feng*, Paul Statkevich*, Akintunde Bello*, and Amit Roy*
*Bristol-Myers Squibb, Princeton, NJ, USA
Objective: Extrapolate efficacy of ipilimumab in adult melanoma patients to adolescent (12–18 yrs) melanoma patients by characterizing the pharmacokinetics (PK) of ipilimumab in pediatric patients and proposing a dosing regimen for adolescent melanoma patients that matches adult exposures.
Methods: A population PK (PPK) model was developed by pooling PK data from 4 Phase 2 clinical studies in adult melanoma subjects (N = 544, 23–87 yrs) and two pediatric studies (N = 44, 2–22 yrs). The PPK model was based on the previously determined adult model, which is a two-compartment model including the covariate effects of baseline body weight (BW) and lactate dehydrogenase (LDH) on systemic clearance (CL), and BW on central volume of distribution (VC). Additionally, the effect of age on CL was assessed. The model was applied to simulate exposures in each pediatric age group, based upon age and weight data sampled from the NHANES database, and to select a dosing regimen for adolescents that achieved exposures similar to that of adults treated with the approved regimen of ipilimumab 3 mg/kg Q3W.
Results: The PPK model provided an adequate description of the PK data for both adults and pediatric subjects. BW and LDH were the significant covariates on CL, whereas age was not. The allometric coefficients on CL and VC were estimated to be 0.95 and 0.89, respectively, supporting a BW normalized dosing regimen in adolescents. The typical CL and VC for adolescents were estimated, with 95% CI of those parameters within 85–115%. Geometric mean of simulated Cminss, Cmaxss and Cavgss achieved by 3 mg/kg Q3W were within 12% of the corresponding adult exposures.
Conclusions: Ipilimumab PK in pediatric patients was adequately described by a linear, 2-compartment model, with the same covariates as in adults. Ipilimumab 3 mg/kg Q3W is the recommended dose for adolescent melanoma patients based on achieving similar exposure in adolescent and adult melanoma patients.
T-034
Evaluation of individual probability in mixture model in NONMEM®
Ka-Ho Hui1, Tai-Ning Lam1
1School of Pharmacy, Faculty of Medicine, The Chinese University of Hong Kong, Hong Kong.
Objectives: One of the utilities of mixture model in NONMEM® is to estimate the probability of a subject belonging to each subgroup (PMIX) and classify the subject according to the highest value (PMIXmax), based on its pharmacokinetic data. Theoretically, the probability of correct classification (i.e. the reliability of the classification), Pcorrect, is estimated by PMIXmax, but it has not been investigated before. This study aims at evaluating PMIXmax against the observed Pcorrect and providing a better estimator for Pcorrect if necessary.
Methods: 59,049 pharmacokinetic datasets were simulated using the subroutine ADVAN2 TRANS2 with a mixture of two CL distributions, with varying parameters (including sample size, typical values and variability of CL, Vd and ka, mixing proportion and residual unexplained variability). A model with the $MIX block and another without were run on each dataset to obtain the estimates for PMIXmax for each subject, and the change in OFV per observation (DOFVobs) after removing the mixture model, respectively. Data were binned by DOFVobs and PMIXmax, and Pcorrect in each bin was computed and compared against PMIXmax. The relationship between Pcorrect and PMIXmax and DOFVobs would be investigated and an empirical equation to estimate Pcorrect would then be developed and evaluated.
Results: The estimation of Pcorrect by PMIXmax was poor. In terms of binned data, PMIXmax almost always overestimates Pcorrect (R2 = 0.693, MPE =+7.96%), especially when DOFVobs is small (Figure). An estimation equation for Pcorrect based on DOFVobs and PMIXmax was then developed, showing improved performance (R2 = 0.952, MPE =+0.02%).
Conclusions: PMIXmax is not a reliable estimator for Pcorrect. The empirical estimation equation for Pcorrect based on DOFVobs and PMIXmax greatly improves the estimation. This study has confirmed the biases of PMIXmax and demonstrated the possibility to improve the estimation of Pcorrect.

T-035
Clinical trial simulation (CTS) for a new rapidly absorbed paracetamol formulation (NP) development from the conventional Paracetamol tablet (CP)
Kairui Feng1, Robert H. Leary1, Michael Dunlavey1, Amin Rostami-Hodjegan1,2
1Certara, USA; 2University of Manchester, UK
Objectives: A NP containing sodium bicarbonate was developed [1, 2, 3] with comparison of the clinical trial results between NP and CP and in vitro-in vivo correlation (IVIVC) analysis [2]. However, how to integrate the low-cost in vitro dissolution data (Vitro) to inform the clinical trial is still a mystery [4]. This work is to take the Vitro data to build a population IVIVC-PK model from CP and use bioequivalence (BE) statistical analysis to guide the trial design to NP.
Methods: 28 Caucasian volunteers were recruited for a 4-way-crossover study with CP and NP at fed and fasted groups [1]. Vitro data from CP and NP was obtained by USP paddle apparatus with 900 mL of 0.05 M HCL at speeds between 10–50 rpm [2]. The best Vitro model was found from Hill equation and cumulative Weibull distribution. Differential Vitro model was convolved to the pop-IVIVC-PK models [5]. Pop-IVIVC-PK models were built and validated using nonlinear mixed effect modeling (NLME). The best in vitro test method was identified and used in CTS with crossover design from the validated pop-IVIVC-PK model. Cmax and AUC were used to determine the BE between CP & NP and between observed & predicted data using ANOVA analysis.
Results: The higher paddle speed Vitro test methods built better IVIVC-PK models. The CTS and BE analysis showed that the prediction and observation is bioequivalence with respect to Cmax and AUC.
Conclusions: The low-cost Vitro data built into the pop-IVIVC-PK models and CTS and BE analysis help to predict NP and plan trial design. The method identified the correct Vitro test method and optimize CTS and hence reduce clinical studies cost [4].
References
-
1.
Rostami… Drug Dev Ind Pharm. 2002; 28(5):523–31.
-
2.
Rostami… 2002; 28(5):533–43.
-
3.
Kelly… Pharm Res. 2003. 20(10):1668–73.
-
4.
Kaur… AAPS. 2015. 17(4).
-
5.
Buchwald. JPP. 2003. 55:495–504.
T-036
Modeling double peak phenomenon and in vitro-in vivo correlation (IVIVC) in pharmacokinetics (PK) for Clinical trial simulation (CTS) of virtual bioequivalence (BE) studies
Kairui Feng1, Robert H. Leary1, Michael Dunlavey1, Amin Rostami-Hodjegan1,2
1Certara, USA; 2University of Manchester, UK
Objectives: A few models has been proposed to resolve the double-peak phenomenon [1–4] in PK. IVIVC was a separated topic [6] and not used in pop-PK analysis. This work is to build the IVIVC model in double-peak phenomenon in pop-PK. CTS was then used for BE studies to inform the clinical trial design and decision-making.
Methods: Multiple peaks in PK has been considerable interest recently [1, 2, 4]. Three methods were used to capture these complex absorption, including two-parallel pathways (TPP), double-Weibull distribution (DWD) and enterohepatic recirculation (ER). After validating a compartmental model from these methods using a nifedipine double-peak concentration data, a direct IVIVC model [5] was built into these double-peak phenomenon PK models using the in vitro dissolution data [7]. CTS and BE statistical analysis was used to compare these methods using different BE study protocols such as parallel, crossover and replicated design. Single dose and multiple doses was considered during the CTS. Dose superimposition in multiple doses was handled and demonstrated [3, 4].
Results: DWD method got better fit with the double-peak concentration data in single dose scenarios. TPP method obtained good results after manually turning the number of transit compartments in each of the pathway. ER method with a continue feedback is less robust. DWD method is difficult for dose superimposition while two-parallel pathway method handled it naturally from ODEs. CTS and BE statistical analysis was further affirm the above findings.
Conclusions: It is feasible to build a double-peak phenomenon IVIVC pop-PK models. Different absorption models can be used in single dose and multiple doses during BE modeling. CTS and BE statistical analysis did produce informative BE decisions for these complex absorption phenomenon.
References
-
1.
Godfrey…Comput Methods Programs Biomed. 104(2011):62–69.
-
2.
Guittet…Pharm Res (2017)34:1840–1848.
-
3.
Shen…J.PKPD. (2012)39:251–262.
-
4.
Cirincione…AAPS. (2016)19(2):487–495.
-
5.
Buchwald.JPP. (2003)55:495–504.
-
6.
Kaur…AAPS. (2015)17(4).
-
7.
Mercuri…J. Pharm. (2016)499:330–342.
T-037
Evaluation of the Efficacy of a CD122 Biased Agonist for Treatment of Melanoma as a Monotherapy and in Combination with PD-1 Inhibition Using a Mechanistic Physiological Model
Samira Khalili1, Ute Hoch1, Aleksandrs Odinecs1, Douglas Chung2, Vincent Hurez2, Michael Weis2, Mike Reed2, Katherine Kudrycki2
1Nektar Therapeutics, San Francisco, CA; 2Rosa & Co., LLC, San Carlos, CA.
Background and Objectives: Despite advances from approved immunotherapies, there is a need for new, effective treatments for metastatic melanoma. Our primary objective was to evaluate the efficacy of a CD122 (IL-2 receptor beta)-biased agonist (NKTR-214) as a monotherapy and in combination with an anti-PD-1 mAb (nivolumab) using a QSP method. Our secondary goals included evaluation of dosing strategies (concurrent or sequential), identification of characteristics of responders and key biological pathways impacting therapy outcomes.
Methods: An Immuno-Oncology PhysioPD™ Research Platform was developed describing a mechanistic model representing the physiology of metastatic melanoma (i.e., tumor cell dynamics, T cells, NK cells, APCs, key mediators, PD-1/PD-L1 dynamics, key regulatory effects), and the pharmacokinetics, mechanisms of action, and tumor responses to several immunotherapies. Virtual Patients (VPs) with variable clinical response to IL-2 and anti-PD-1 therapies were developed and qualified (Friedrich, 2016) based on published and proprietary data. Simulated experiments assessed efficacy on clinical outcomes, e.g., the simulated sum of longest diameters, SLD.
Results: Research using the platform was able to identify VPs which benefited from the combination therapy but did not respond well to either NKTR-214 or nivolumab monotherapy. However, nivolumab monotherapy responders may receive benefit from the NKTR-214 add-on. Simulations implied that the ratio of cytotoxic T lymphocytes to regulatory T cells inside the tumor, but not in plasma, is a potential biomarker of response to the combination therapy and suggested that simultaneous rather than sequential dosing is likely to be more efficacious.
Conclusions: The in silico research and analysis identified VPs most likely to respond to combination therapy, and a potential tumor biomarker of combination therapy response to supportdose optimization strategies. The platform has generated interesting hypotheses regarding the combination therapy efficacy of nivolumab and NKTR-214 to be further investigated in clinical studies.
Reference
Friedrich, CM (2016). CPT: PSP 5(2), 43.
T-038
Population pharmacokinetic analysis of solriamfetol (JZP-110), a selective dopamine and norepinephrine reuptake inhibitor
Katie Zomorodi, PhD1; Nastya Kassir, PharmD, PhD, FCP2; Leila Kheibarshekan, PhD2
1Jazz Pharmaceuticals, Palo Alto, CA, USA; 2Certara Strategic Consulting, Montreal, Canada
Objectives: Primary objective of this analysis was to characterize the pharmacokinetics (PK) of solriamfetol (JZP110) and to examine sources of variability across studies and sub-populations to determine relevant covariates. -
Methods: Population PK modeling was performed on data from six Phase 1 and two Phase 3 (in narcolepsy and obstructive sleep apnea [OSA]) studies. Different compartmental models with linear disposition were tested. An assay conversion factor was incorporated to accommodate for different assay methodologies. Covariates were evaluated using a stepwise forward/backward approach. Bootstrap resampling analyses and visual predictive checks were performed to evaluate the final model.
Results: A total of 791 subjects (healthy, renally impaired, OSA, or narcolepsy subjects) receiving different doses of solriamfetol (from 37.5 mg to 1010.4 mg) were included in the analysis. Solriamfetol exposure was dose-proportional and best described by a 1-compartment model with first order absorption rate and lag time. PK was similar between OSA and narcolepsy patients. Population estimates of apparent oral clearance (CL/F) and apparent central volume of distribution (V/F) were 19.49 L/h and 198.72 L, respectively (for a male patient, weighing 92.5 kg, with a creatinine clearance (CRCL) of 116.5 mL/min, and on a dose of 150 mg). Half-life was 7 h. CRCL and end-stage renal disease (ESRD) were the most important covariates describing the variability of CL/F. Additional statistically significant covariates describing variability of CL/F (weight, dose, gender, and healthy vs narcolepsy/OSA), V/F (weight and gender) and absorption rate constant (Ka) (fed/fasted condition, formulation, and dose) did not have a clinically relevant impact on exposure parameters.
Conclusions: Solriamfetol exposure was mainly affected by renal function. Although other covariates such as gender and weight were identified as statistically significant, none was considered to have a clinically relevant impact that would be expected to require dose adjustment.
Support: Jazz Pharmaceuticals.
Disclosures: K Zomorodi is an employee of Jazz Pharmaceuticals who, in the course of this employment, has received stock options exercisable for, and other stock awards of, ordinary shares of Jazz Pharmaceuticals plc. N Kassir is an employee of Certara who was paid to provide consulting services to Jazz Pharmaceuticals. L Kheibarshekan is an employee of Certara who was paid to provide consulting services to Jazz Pharmaceuticals.
T-039
NKTR-255 Exhibits Target Mediated Drug Disposition and Stimulates Proliferation of Cytotoxic Immune Cells in Cyonomolgous Monkeys
Kavitha Bhasi, Palakshi Obalapur, Peiwen Kuo, Ping Zhang, Takahiro Miyazaki and Werner Rubas
Research Biology, Nektar Therapeutics, San Francisco, CA
Background: IL-15 is a cytokine that activates T cells and NK cells and has long been recognized for its potential as an immunotherapeutic agent for the treatment of cancer. Exploiting this potential has been challenging due to unfavorable pharmacokinetic properties requiring daily dosing. NKTR-255 is a polymer-modified IL-15 that shows sustained exposure relative to hrIL-15 while retaining potency and high affinity for IL-15Rα. Modeling was conducted to characterize the PK/PD of NKTR-255.
Methods: NKTR-255 was administered intravenously to healthy cynomolgous monkeys at a dose range of 0.001–0.3 mg/kg of NKTR-255 (as IL-15 content); blood samples were collected and analyzed. Modeling was conducted using NONMEM 7.
Results: A target mediated drug disposition (TMDD) model describes the PK of NKTR-255. Preliminary estimates for elimination from central compartment (kel), receptor binding (kon and koff) and internalization (kint) rates are 0.0642 h−1, 0.785 nM−1 h−1, 0.126 h−1, and 0.0107 h−1, respectively. PD effects were modeled for the proliferation marker (Ki67) for NK and CD8 T cells. Ki67 levels showed an increase from baseline over time after a slight initial delay and were captured using the stimulatory indirect response model with a transit compartment model. As expected, the preliminary estimates showed that NKTR-255 stimulated Ki67 more potently for NK cells compared to CD8 T cells with potency (SC50) of 0.0184 nmol/kg and 0.953 nmol/kg, respectively.
Conclusion: A preliminary PK/PD model was successfully built for NKTR-255 in monkeys and could serve as a valuable tool for dose selection in first-in-man clinical studies.
T-040
Population Pharmacokinetic (POP-PK) Analysis of Daprodustat (GSK1278863) and its Metabolites in Non-dialysis (ND) and Hemodialysis-Dependent (HDD) Anemia Patients with Chronic Kidney Disease (CKD)
Kelly M. Mahar1, Richard Mills2, Navin Goyal1
1GlaxoSmithKline, Collegeville, PA, USA, 2ICON, Marlow, Buckinghamshire, UK.
Objectives: To characterize the population pharmacokinetics (POP-PK) of daprodustat and its metabolites in ND and HDD patients and to explore previously untested daprodustat doses and dose regimens to support clinical trial designs and sampling strategies.
Methods: Systemic exposure data from healthy volunteers (8) and chronic kidney disease (CKD) patients in Phase I and II studies were used to develop POP-PK models for daprodustat and its six metabolites (NONMEM). Graphical and statistical approaches were employed to evaluate and qualify model performance.
Results: Data from seven trials, representing 560 subjects was utilized for the analysis. A two-compartment model with first order absorption adequately characterized the PK of daprodustat and a one-compartment model characterized the metabolites’ PK. Model development utilized a two-stage approach. Metabolite data alone was fitted to the final model with the individual post hoc parameter estimates for the parent incorporated into the POP-PK dataset to drive the metabolite model. A total of 10 covariates namely: body weight, age, PGx for BCRP and CYP2C8, co-administration of inhibitors for CYP2C8, CYP3A4, BCRP and OATP along with phosphate binding medications and food effect were included in the full model. The key covariates affecting metabolite clearance CLMx/F/Fmx were dialysis, body weight and GFR. Goodness of Fit (GoF) and Visual Predictive Check (VPC) plots confirmed adequate performance of the POP-PK model in characterizing parent and metabolite observed concentrations.
Conclusions: The systemic exposure of daprodustat and metabolites was adequately described by POP-PK approach. Covariate analyses demonstrated no clinically significant influence on parent drug PK but were retained in the model to allow adequate characterization and predictions of all scenarios. Estimated glomerular filtration rate and dialysis were clinically relevant covariates on metabolite clearance. The model was utilized for simulations of other daprodustat posology in supporting design of additional clinical trials.
T-041
Population Kinetic/Pharmacodynamic (K/PD) Analyses of Daprodustat (Prolyl Hydroxylase Inhibitor) in Non-dialysis (ND) and Hemodialysis-Dependent (HDD) Anemia Patients with Chronic Kidney Disease (CKD)
Kelly M. Mahar1, Brendan Johnson2
1GlaxoSmithKline, Collegeville, PA, USA; 2Roivant Sciences, Durham, NC, USA.
Objectives: To develop a population daprodustat dose–hemoglobin (Hgb) response (K/PD) model after repeat-dose administration to ND and HDD anemia subjects with CKD, including evaluation of covariates of response. The model was used in clinical trial simulation to support selection of dose levels and individual dose adjustments for Phase 3 trials.
Methods: Model parameters were estimated using NONMEM. A full covariance matrix was estimated for the seven structural model parameters. A base structural model with backwards elimination was used to determine significant covariates followed by a reduced covariate model and parsimonious model (Dose Selection Model) that included the most relevant covariates. A precursor cell compartment and 12 transit compartments were used to describe the red blood cell (RBC) dynamics and life-span. Daprodustat was assumed to stimulate the precursor cell production rate.
Results: Data were from six studies representing 710 subjects that received daprodustat (81%) or placebo. Several covariates appear to have clinically relevant effects on the response, including body weight, baseline transferrin saturation (TSAT), prior erythropoiesis-stimulating agents (ESA) dose, baseline reticulocytes and baseline hepcidin. Baseline TSAT was a significant covariate that clearly indicates availability of adequate iron is a determinant of response. ND subjects appear to be more sensitive to the erythropoietic effects of daprodustat than HDD subjects. The estimated RBC life-span was 82 days (CVb = 60%). Model diagnostics of the base structural model, reduced covariate model, and Dose Selection Model were well within acceptable boundaries.
Conclusions: A semi mechanistic longitudinal dose–response model provided a suitable description of the Hgb data from Phase 2 and was used to support Phase 3 doses in anemic subjects with CKD. Daprodustat starting doses were based on baseline Hgb or prior ESA doses and aimed to reach or maintain Hgb within the target range with a minimum number of dose adjustments.
T-042
Bioequivalence evaluation for a complex drug product, cytarabine liposome injection, using modeling and simulation approaches
Ken Ogasawara1,2, Alejandro Pérez-Pitarch1,2, Jia Chen1,2, Myong-Jin Kim1, Liang Zhao1, Lanyan Fang1
1Division of Quantitative Methods and Modeling, Office of Research and Standards, Office of Generic Drugs, Center for Drug Evaluation and Research, US Food and Drug Administration, Silver Spring, MD, 2Oak Ridge Institute for Science and Education, Oak Ridge, TN
Objectives: Cytarabine liposome injection is indicated for the intrathecal treatment of lymphomatous meningitis, a rare and serious central nervous system metastasis. Conventional bioequivalence (BE) approach with a limit of 80–125% may not be applicable for establishing BE for this complex drug product because of the difficulty in intensive pharmacokinetic (PK) sampling in cerebrospinal fluid (CSF) from patients. In this study, we evaluated a model-based BE approach for cytarabine liposome injection based on sparse PK sampling from a limited number of patients.
Methods: Using the PK data from the new drug application, a population PK model of encapsulated and free cytarabine following intrathecal administration of cytarabine liposome injection was developed with NONMEM 7.3. Thousands of BE studies were simulated in a steady-state, crossover design, comparing the reference to the test drug products with various relative bioavailability (RBA). In each BE study, patients provided 2–3 CSF samples per treatment. The RBA was re-estimated using the population PK model and used as the BE metrics. Several limits on the RBA estimate were evaluated based on the percentage of BE studies that passed the pre-specified limit.
Results: The PK of encapsulated cytarabine was adequately described by a two-compartment model with first-order release to free cytarabine compartment; while free cytarabine’s PK was described by a one-compartment model with first-order elimination. Simulation results indicated that, given the proposed study design and a BE limit of 60–150%, the rate of type I and type II errors of the model-based BE assessment appears to be reasonable. For instance, a high passing rate of 90% was achieved for a test product with RBA of 1 and a low passing rate of < 2% was achieved for a test product with RBA of 1.67.
Conclusions: This model-based BE method may provide an alternate approach in BE assessment for cytarabine liposome injection, a complex drug product.
T-043
Characterization of absorption profile of morphine after manipulation of morphine sulfate extended-release tablets with or without abuse-deterrent properties
Ken Ogasawara1,2, Yehua Xie1,2, Lanyan Fang1, Myong-Jin Kim1, Liang Zhao1, Zhichuan Li1
1Division of Quantitative Methods and Modeling, Office of Research and Standards, Office of Generic Drugs, Center for Drug Evaluation and Research, US Food and Drug Administration, Silver Spring, MD, USA, 2Oak Ridge Institute for Science and Education, Oak Ridge, TN, USA
Objectives: One of the common approaches to develop opioid drug products with abuse-deterrent (AD) properties is the use of physical/chemical barriers which is expected to slow down the rise of plasma concentration and reduce abuse potential when the manipulated opioids are taken orally or intranasally. The objective of this study is to develop a population pharmacokinetic (PK) model to quantitatively characterize and compare the absorption properties of manipulated morphine sulfate extended-release (ER) tablets with/without AD properties (morphine-AD/morphine-nonAD) following oral and intranasal administration.
Methods: One oral (N = 39, 4-way crossover) and one intranasal abuse potential studies (N = 50, 5-way crossover) from the new drug application of ARYMO ER (a morphine-AD product) were included in the analysis. The oral study comprised placebo, 60-mg intact morphine-AD, 60-mg manipulated morphine-AD and 60-mg manipulated morphine-nonAD; and the nasal study included placebo, oral 60-mg intact morphine-AD, intranasal 60-mg manipulated morphine-AD (all particle sizes), intranasal 60-mg manipulated/sieved morphine-AD (small particle sizes) and intranasal 60-mg manipulated morphine-nonAD. Population PK model of morphine was developed with NONMEM 7.3.
Results: The PK of morphine following oral and intranasal administration of intact or manipulated morphine-AD/nonAD was adequately described by a two-compartment model with first-order elimination and one transit compartment absorption. Mean transit time (MTT) for drug moving from depot to central compartment and relative bioavailability (RBA) to oral intact morphine-AD were reflective of rate and extent of absorption, respectively. In both oral and intranasal routes, manipulated or manipulated/sieved morphine-AD showed a longer MTT and a lower RBA, compared with manipulated morphine-nonAD. In oral route, manipulation of the morphine-AD reduced the MTT without affecting RBA to intact morphine-AD.
Conclusions: The quantitative assessment using population PK model provides a better understanding of the absorption profile of morphine after manipulation of a morphine-AD product. Future studies will be conducted to quantitatively analyze the relationship of absorption behaviors and AD potential.
T-044
Metrics of Patient Differences in Two Digital Pharmaceutical Pilots
Kirsten E. Smayda, PhD1, Hilary F. Luderer, PhD1, David Zuckerman, MBA1, Yuri A. Maricich, MD, MBA,1 Heather Shapiro, PhD1
1Pear Therapeutics, Boston, MA, USA
Objectives: Recent estimates suggest that 20.2 million adults in the US suffer from substance use disorder (SUD). Concurrently, there is a severe lack of resources for neuropsychiatric disorders like SUD, especially in rural and other underserved areas, making it difficult for many to receive adequate care. Mobile devices offer the potential to deliver clinically validated therapy to these areas for in-the-moment assistance, and a critical component of such an intervention is the ability to track individual variability of user engagement. Data captured through software usage can also help fill an important void of information, namely what happens in-between visits with a healthcare provider. Therefore, the goal of this project is to characterize individual differences in behavior as they relate to use of reSET®, an FDA-cleared prescription digital therapeutic for the treatment of SUD.
Methods: Participants with SUD in two different pilot programs utilized the reSET digital therapeutic for 12 weeks. reSET® usage data was analyzed to identify trends in time of day using reSET, duration of sessions, and pattern of reSET® feature usage.
Results: Patterns of patient behavior including regularity of use (Figure 1), therapeutic preferences, and feature accessing were extracted and suggest individual differences in reSET engagement and exposure.
Conclusions: Results suggest that software usage data collected from a prescription digital therapeutic can capture unique variability in end-user behavior. Critically, these results show the diversity of information that can be gathered during treatment, particularly during the time between visits, facilitating the application of personalized medicine.

Figure 1 Individual patients plotted by time in each module (including lesson, quiz, rewards spin) for Pilot 1
T-045
Deriving Patient Personas with Natural Language Processing for a Digital Therapeutic Device
Kirsten E. Smayda, PhD1, Jordon Bosse, RN2, Amanda Wilson, MD3, Yuri A. Maricich, MD, MBA1, Hilary F. Luderer, PhD1 and Lisa Chiodo, PhD2,3
1Pear Therapeutics, Boston, MA; 2University of Massachusetts College of Nursing, Amherst, MA; 3Clean Slate Research and Education Foundation, Northampton, MA
Objectives: Health data can span a wide range of formats including both qualitative and quantitative. It is common practice in software development to conduct user research using one-on-one interviews to garner qualitative insight about the target product user group beyond numeric-based surveys. With the rise of the digital health industry, user-centered research is effectively patient-centered research. Tools such as natural language processing (NLP) afford an unprecedented ability to turn qualitative patient reports into quantitative actionable insights. The goal of this project is to incorporate data-driven methodologies into user research to support development of a prescription digital therapy for opioid use disorder (OUD).
Methods: Interviews were conducted with OUD patients at CleanSlate Addiction Treatment Centers with the goal of better understanding patients’ recovery journey. Interview questions covered topics such as history of substance abuse, key motivators for achieving and maintaining recovery, and patient attitudes towards recovery, treatment and technology. NLP methods including data cleaning, abstraction and term frequency-inverse document frequency (tf-idf) weighting were used to aggregate, transform, and interpret patient responses to extract common patient experiences. Results were conveyed back into the product development cycle via key stakeholders.
Results: Using NLP methods, common themes surrounding recovery experiences and patient goals in and out of treatment were derived from semi-structured qualitative patient interviews. Words with the highest relevance scores (tf-idf weights) are plotted for each topic, and clustering based on cosine similarity of first-level persona word groups suggest coherent patterns of experiences across patients corroborated by higher level interview themes. Results were used to complement top-down product development efforts.
Conclusions: Patient interviews provided a unique and descriptive lens into patients’ recovery journey, supporting internal efforts to tailor product development to better fit OUD patient needs. This project demonstrates feasibility of extracting insights from unstructured text data for product development using data-driven techniques.
T-046
Population PK Analysis of Nifurtimox for the Treatment of Chronic Chagas Disease in Adults
N.H. Prins1, I. Ince2, S. Willmann2, H. Stass2, G. Sutter2
1qPharmetra, Andover MA; 2Bayer AG, Germany
Objectives: Although nifurtimox has been a successful treatment for Chagas Disease for 53 years, the pharmacokinetic (PK) information on nifurtimox in humans derived from controlled studies is very limited. We aimed to develop a population PK model that describes the highly variable exposure after administration of 120 mg nifurtimox in adult patients with chronic Chagas’ disease.
Methods: Approximately 1900 nifurtimox plasma concentrations obtained in 72 adult patients with chronic Chagas’ disease were modeled using NONMEM v7.3 (ICON Development Solutions) with FOCE-I and SAEM. Observed and model-predicted concentrations were log-transformed with an additive error on the log-scale. Model building focused on separating the highly variable absorption from the far less variable disposition phase.
Results: Drug disposition was adequately described by a one-compartment structure. The absorption was characterized by multiple absorption peaks with high degree of inter-individual variability (IIV) and inter-occasion variability, and it was strongly affected by taking food. While zero-order and/or 1st-order absorption kinetics were insufficient, two parallel transit compartment absorption model (TCAM) components splitting the total dose amount were required. Food reduced the amount absorbed via the 1st and increased that absorbed via the 2nd TCAM component (Figure 1), such that the relative oral bioavailability increased by 80%. A visual predictive check confirmed that the model adequately described the observed data. The model acknowledged the difference in variability between absorption and disposition phase with IIV estimates for clearance, and volume of distribution being relatively low (21–25%), and that for the TCAM parameters high (47–53%).
Conclusions: A population PK model was established that described the highly variable, multiple-peak absorption phase and the less variable, mono-phasic disposition phase of nifurtimox exposure in adult patients with chronic Chagas’ disease. This model may serve as the cornerstone of describing nifurtimox PK in studies where sparse sampling is required, for example in pediatric patients.

Fig. 1 The input functions characterizing the TCAM process for nifurtimox absorption
T-047
Evaluating model evaluation: shall we trust a model whose parameter estimation yields low RSEs and/or successful output messages?
Stanislav Tsitkov1, Konstantinos Biliouris2, Etienne Pigeolet3, Ramprasad Ramakrishna2, Yu-Yun Ho4, Andrew M Stein2
1Department of Biomedical Engineering, Columbia University, New York, USA; 2Novartis Institute for Biomedical Research, Cambridge, USA; 3Novartis Pharma, Basel, Switzerland; 4Novartis Pharma, New Jersey, USA.
Objectives: To evaluate the convergence and identifiability of pharmacokinetic/pharmacodynamic (PK/PD) models whose parameter estimation is successful and their relative standard errors (RSEs) are low.
Methods: We assessed 10 PK/PD models that were developed in-house or described in the literature [1] using NONMEM/Monolix. The models described preclinical or clinical data from small molecules or antibodies. Following model development, a two-step approach was implemented to assess practical identifiability and convergence: 1) examining the RSEs and NONMEM output message, and 2) examining the log-likelihood profiles (LLPs) and/or objective function value (OFV) waterfall plots [2].
Results: The output file of the NONMEM models did not include error messages, suggesting that the estimation was successful, and the RSEs of the estimates for all models were low, < 40%. However, when the LLPs and OFV waterfall plots were generated, model convergence and/or un-identifiability issues were observed in 6/10 models. In addition, some models showed high correlation between parameters (≥ 0.98), but the correlation value was dependent on the type of covariance matrix used.
Conclusions: Many modelers comfortably accept a model whose parameter estimation process outputs low RSEs and/or no error messages. Here, we use real-world examples to show that meeting these two criteria does not guarantee model convergence/identifiability and, therefore, additional model evaluation is needed. We propose that LLPs and OFV waterfall plots should be examined during model evaluation. Failing to do so may lead to the selection of unidentifiable and complex models, leading to misinterpretation of the parameters’ physiological meaning and inconsistent parameter estimates when the dataset is updated with new data.
References
-
1.
Stein, Andrew. “Practical unidentifiability of receptor density in target mediated drug disposition models can lead to over-interpretation of drug concentration data.” bioRxiv (2017): 123240.
-
2.
Raue, Andreas, et al. “Lessons learned from quantitative dynamical modeling in systems biology.” PLoS One 8.9 (2013): e74335.
T-048
Population PK/PD Model of an Extracellular Tau Targeting mAb Being Developed for the Treatment of Progressive Supranuclear Palsy (PSP) and Alzheimer’s Disease (AD)
Kubra Kamisoglu1, Kumar Kandadi Muralidharan1, Ivan Nestorov1
1Biogen, Cambridge, MA, USA
Objectives: Increased deposition of aggregated tau in the brain is the hallmark of tauopathies including PSP and AD. BIIB092 is a humanized IgG4 antibody targeting extracellular tau (eTau), which are N-terminal tau fragments found extracellularly in the interstitial and cerebral spinal fluid (CSF). The hypothesis is that BIIB092-mediated removal of eTau may prevent spread of tau pathology and potentially slow disease progression1. A population PK/PD model was developed to characterize the exposure-target engagement relationship for BIIB092 in healthy volunteers and PSP patients.
Methods: BIIB092 and eTau concentrations measured in serum and CSF samples from 49 healthy volunteers who received a single dose and 36 PSP patients who received multiple doses of BIIB092 were used for the development of the model describing drug distribution and ensuing target engagement in CSF. Modeling and simulations were performed on Monolix suite (2018R1).
Results: Three-compartment model with linear elimination from central compartment captured observed PK profiles successfully. Target engagement in CSF was described by indirect response model. Estimated half-maximal effect concentration (EC50, 0.952 nM) agreed well with binding affinity to human eTau (Kd, 0.7 nM) measured ex vivo. Body weight significantly contributed to inter-subject variability of the central and peripheral volumes and drug clearance. The rate of drug distribution to CSF was found to be higher in PSP patients compared to healthy volunteers, likely due to compromised blood–brain barrier permeability caused by tauopathy2.
Conclusions: A PK/PD model describing the distribution and target engagement of an anti-eTau antibody has been developed based on phase 1 clinical studies. Model simulations indicate a high target engagement (> 95%) can be expected in the ongoing phase 2 study in PSP patients. The results also provide insight into expected target engagement in AD patients.
References
-
1.
Bright, J. et al. Neurobiol. Aging 36, 693–709 (2015).
-
2.
Blair, L. J. et al. Acta Neuropathol. Commun. 3, 8 (2015).
T-049
Population Pharmacokinetics of Aducanumab in Patients with Alzheimer’s Disease
Kumar Kandadi1, Ivan Nestorov1, Philipp von Rosenstiel2
1Clinical Pharmacology and Pharmacometrics, Biogen, Cambridge, MA, USA; 2Clinical Development, Biogen, Cambridge, MA, USA.
Objectives: Aducanumab (BIIB037) is a human, anti-Aβ monoclonal antibody (mAb) currently in Phase-3 trials for the treatment Alzheimer’s disease (AD). The objective of this analysis is to develop a population pharmacokinetic (PK) model using data from the clinical studies to characterize aducanumab PK in serum and cerebrospinal fluid (CSF) across patients with AD following intravenous (IV) Aducanumab administration.
Methods: The Aducanumab PK data was obtained from single (221 AD-101) and multiple ascending (221 AD-103) dose studies. In total, 6401 serum samples from 224 patients and 35 CSF samples from 24 subjects were included in the population PK analysis. Serum and CSF PK models were developed sequentially using NONMEM (Version 7.3). Diagnostics plots, and various predictive check procedures were used for model evaluation. Physiologically plausible covariates were tested via stepwise covariate modeling on the serum PK model. No covariates were evaluated on the CSF PK model.
Results: PK of Aducanumab in serum and CSF was best described by a three- compartmental model with linear elimination from the central compartment. Based on the model, the mean (90% Confidence interval) clearance (CL) is 18.20 mL/h (17.6, 18.8), median volume of distribution at steady state (Vss) is 10.5 L (10.1, 10.8) and terminal elimination half-life (t1/2,β) is 23.7 (14.5, 37.1) days. 90% of steady state concentrations were expected to reach by 4 months for an individual dosed with Q4W (every 4 weeks) IV aducanumab. Covariate analysis showed that CL, V1 (Central volume of distribution) and V2 (Peripheral volume of distribution) increased as body weight increased. The steady state exposure ratio of CSF to serum was estimated to be 0.4%.
Conclusions: The integrated, semi-mechanistic population PK model captured the time course of aducanumab PK and allowed to link serum concentrations to CSF concentrations in AD subjects.
T-050
Quantitative Systems Toxicology Modeling Using DILIsym Suggests That Mitochondrial Biogenesis Could Explain Adaptation to Drug-Induced Liver Injury
Kyunghee Yang1, Jahid Ferdous1, Jeffrey L Woodhead1, Paul B Watkins2, Brett A Howell1, and Scott Q Siler1
1DILIsym Services Inc., a Simulations Plus Company, Research Triangle Park, NC; 2UNC Eshelman School of Pharmacy, The University of North Carolina at Chapel Hill, Chapel Hill, NC
Objectives: Resolution of drug-induced liver injury (DILI) despite continued drug dosing, termed “adaptation”, is commonly observed in clinical trials, but the underlying mechanisms behind this phenomenon remain unclear. In the current study, the contribution of mitochondrial biogenesis to DILI adaptation was investigated using DILIsym, a quantitative systems toxicology (QST) model platform.
Methods: The mitochondria sub-model within DILIsym [1] was updated to represent mitochondrial biogenesis, and a simulated population (SimPops) that includes variability in hepatotoxicity mechanisms and mitochondrial biogenesis was created. Biogenesis parameters were obtained from literature or optimized to ALT profiles in patients treated with solithromycin, a mitochondrial electron transport chain (ETC) inhibitor. Six exemplar compounds with different hepatotoxicity mechanisms were simulated in human biogenesis SimPops and the standard SimPops (without biogenesis).
Results: Solithromycin simulations using the human biogenesis SimPops recapitulated clinically observed resolution of serum ALT elevations; simulated serum ALT peaked on day 4 and then decreased despite the continued dosing through day 7, consistent with the clinical data. Similar pattern of serum ALT adaptation was predicted for clarithromycin, which was shown to induce DILI through ETC inhibition from our previous work. Frequency and severity of DILI mediated with overdose of buprenorphine, an ETC inhibitor and uncoupler, was decreased with biogenesis. However, Hy’s Law cases were predicted in 10 out of 285 individuals even with biogenesis, suggesting that biogenesis effects can be overcome by severe mitochondrial injury. Mitochondrial biogenesis did not alleviate hepatotoxicity mediated by bile acid transporter inhibition (erythromycin, AMG 009) or oxidative stress (acetaminophen).
Conclusions: QST modeling suggests that mitochondrial biogenesis can mitigate DILI caused by mitochondrial dysfunction. More in vitro and clinical data are needed to better quantitate the timing, extent, and inter-individual variability of biogenesis and to enhance the accuracy of prospective predictions of adaptation to DILI.

Reference
-
1.
Yang et al. (2015) Pharm Res 32(6):1975–92.
T-051
Development of a Population Pharmacokinetic Model for Binimetinib with Subsequent Exposure–Response Analyses in NRAS Mutant Melanoma
Lance Wollenberg1, Mathilde Marchand2, Henri Merdjan2 and Kevin Litwiler1
1Array BioPharma, Boulder CO 80301 2Certara Strategic Consulting, Paris, France 75012
Objectives: To develop a population pharmacokinetic (PK) model for single-agent binimetinib to assess relevant covariates and exposure–response relationships of overall response rate (ORR) and progression-free survival (PFS) in an NRAS mutant melanoma population.
Methods: The PK analysis dataset was constructed by merging data collected in 6 clinical trials (4 Phase 1 studies, 1 Phase 2 studies and 1 Phase 3 study) in a total of 75 healthy subjects and 526 patients. Population PK modeling was conducted using Phoenix NLME v.1.3. The exposure–response analysis was conducted using Kaplan–Meier plots and Cox regression for PFS and logistic regression for ORR using R v.3.1.3.
Results: The population PK model for the parent drug was a 2-compartment linear disposition model with first-order oral absorption with lag time, and a log-additive error model. The base population PK model was used to derive individual exposure parameter estimates in cancer patients. These values served as input for exposure–response analysis. The final population PK model with relevant covariates on clearance (CL/F) and volume of distribution (V/F) is described with the following functional form:
where Mild RI and Moderate RI represent mild or moderate renal impairment, respectively. In the final covariate model, moderate renal impairment was the most important characteristic to explain variability on CL/F. Binimetinib exposure-efficacy relationships were assessed based on data from the pivotal Phase 3 study NEMO (CMEK162A2301) in 266 patients with advanced unresectable or metastatic NRAS positive melanoma. The ORR probability did not significantly (p > 0.05) increase with any of the binimetinib steady state exposure metrics. The hazard for PFS significantly decreased with increasing binimetinib exposures (Cmax,ss (p = 0.00614), AUCtau,ss (p = 0.0237)).
Conclusion: Overall these analyses support the well behaved pharmacokinetic behavior and positive exposure response relationship of binimetinib in a single agent setting.
T-052
Physiologically-Based Pharmacokinetic Modeling Prediction of Systemic Exposure of Olanzapine and Samidorphan When Administered in Combination as ALKS 3831 in Pediatric Subjects
Lei Sun1, Zoe Barter2, Lisa von Moltke1, Karen Rowland Yeo2
1Alkermes, Inc., Waltham, MA; 2Simcyp, Ltd. (Division of Certara), Sheffield, UK
Objectives: ALKS 3831 is a fixed-dose combination of olanzapine (an atypical antipsychotic) and samidorphan (a μ-opioid receptor antagonist), designed to provide the established antipsychotic efficacy of olanzapine with favorable weight and metabolic properties. In support of the ALKS 3831 pediatric study plan, physiologically-based pharmacokinetic (PBPK) modeling was applied to predict the systemic exposure of olanzapine and samidorphan when administered as the combination ALKS 3831 in pediatric populations.
Methods: Separate PBPK models were constructed for olanzapine and samidorphan in the Simcyp Simulator and refined by leveraging in vitro metabolism and in vivo clinical data. The two models were combined to represent administration of ALKS 3831 and verified by comparing simulated and observed clinical data. The final models were applied to predict systemic exposures of olanzapine and samidorphan in healthy, non-smoking adults and in pediatric subjects divided into 10–12 years-old (YO) and 13–17 YO following once daily oral administration of ALKS 3831 over the dose range of 2.5 mg olanzapine/10 mg samidorphan to 20 mg olanzapine/10 mg samidorphan.
Results: In 10–12 YO, the predicted steady-state olanzapine Cmax and AUC were 1.87 and 1.73-fold higher, and samidorphan Cmax and AUC were 1.93 and 1.83-fold higher, respectively, than corresponding data in adults. In 13–17 YO, the predicted steady state olanzapine Cmax and AUC were 1.24 and 1.16-fold higher, and samidorphan Cmax and AUC were 1.28 and 1.22-fold higher, respectively, than corresponding data in adults. Ratios of Cmax and AUC in both 10–12 YO and 13–17 year YO relative to adults were constant across the ALKS 3831 dose range investigated.
Conclusions: Steady state exposures (Cmax and AUC) of olanzapine and samidorphan following once daily oral administration of ALKS 3831 are predicted to be approximately 2-fold higher in 10–12 YO and similar (within 30%) in 13–17 YO compared to that in adults.
T-053
Semi-mechanistic Pharmacokinetic/Pharmacodynamic (PK/PD) Modeling of Dupilumab on Pre-bronchodilator Forced Expiratory Volume in 1 Second (FEV1) in Uncontrolled Moderate-to-Severe Asthma
Li Zhang1, Meng Li1, Zhaoling Meng1, John D. Davis2, Vanaja Kanamaluru1, Qiang Lu1
1Sanofi, Bridgewater, NJ; 2Regeneron Pharmaceuticals, Inc., Tarrytown, NY; USA
Objectives: Dupilumab, a fully human anti-interleukin (IL)-4Rα mAb, inhibits signaling of IL-4/IL-13, key drivers of Type 2-mediated inflammation. Dupilumab is approved for treatment of adults with inadequately controlled moderate-to-severe atopic dermatitis. We investigated the pharmacokinetic/pharmacodynamic (PK/PD) relationship of dupilumab as add-on therapy in the intent-to-treat (ITT) uncontrolled moderate-to-severe asthma population and identified factors significantly contributing to forced expiratory volume in 1 s (FEV1) response variability.
Methods: A PK/PD model was developed with data from two placebo-controlled pivotal studies (NCT01854047; NCT02414854) in 2654 adult and adolescent patients (n = 794 treated with placebo, n = 1860 treated with dupilumab 200 mg [loading dose (LD) 400 mg] or 300 mg [LD 600 mg] administered either q2w or q4w). Demographic variables, baseline disease characteristics, Type 2 inflammation biomarkers, and immunogenicity were tested as covariates by forward selection and backward elimination. The model was validated with visual predictive check and bootstrap.
Results: FEV1 response over time was characterized by a semi-mechanistic PK/PD model, with treatment effect described by dupilumab concentration-dependent direct response Emax model and placebo effect described by an empirical time-dependent function. Population mean estimates of treatment effect were: Emax = 0.10 L, EC50 = 0.71 mg/L. FEV1 response was positively correlated with fractional exhaled nitric oxide (FeNO) and eosinophil (EOS) count. None of the other tested covariates, including age (12–87 years), had significant impact on FEV1 response. Treatment effect was predicted to approach plateau over 200 to 300 mg q2w, with a slightly greater efficacy and less fluctuation over the dosing interval for 300 mg q2w (Figure).
Conclusions: The PK/PD model predicted near-maximum placebo-adjusted FEV1 response (> 0.15 L) in patients with moderate-to-severe asthma, with a small increment with increase of dose from 200 to 300 mg. Baseline Type 2 biomarkers (FeNO and EOS count) are significant covariates for FEV1 response, with greater efficacy in patients with elevated biomarker levels.

T-054
Mechanism-based Population PK/PD modeling of T lymphocytes Depletion and Repopulation Following Treatment with anti-CD52 Antibody GLD52 in Patients with Progressive Multiple Sclerosis
Li Zhang1, Vanaja Kanamaluru1, Qiang Lu1
1Sanofi, Bridgewater, NJ, US
Objectives: GLD52, a humanized anti-CD52 IgG1 mAb, induces lymphocytes depletion through antibody dependent cellular cytolysis and complement-dependent cytolysis. This analysis aimed to: 1) develop a mechanism-based population PK/PD (Pop PK/PD) model to quantitatively describe the time profile of GLD52-elicited T lymphocyte depletion and repopulation in progressive multiple sclerosis (MS) patients; and 2) assess exposure–response (E-R) relationship in support of GLD52 dose selection for Phase 3 studies.
Methods: The Pop PK/PD model was developed by GLD52 serum concentration and total T lymphocytes from 33 progressive MS patients from a Phase 1, ascending single IV and SC dose study (NCT02282826). The time course of GLD52 E-R relationship was described by a Pop PK/PD model with direct and indirect treatment effect on T lymphocyte dynamics. Clinical trial simulation (CTS) was conducted to predict the extent of T lymphocyte depletion to support the dose selection for Phase 3 studies.
Results: GLD52 elicited rapid and dose-dependent T lymphocyte depletion followed by slow repopulation. The PK of GLD52 was described by a 2-compartment linear model. GLD52 directly depletes T lymphocytes and indirectly inhibits the migration of T lymphocytes into circulating blood. A feedback regulation was added to mimic the slow repopulation of T lymphocytes after GLD52 treatment. T lymphocyte migration time was estimated as 2.44 days, which is within the reported time window of human lymphocyte trafficking1. CTS revealed that full treatment courses with the highest SC dose would result in T lymphocyte depletion that is similar in extent to that observed for anti-CD52 mAb alemtuzumab in MS patients.
Conclusion: The time course of depletion and repopulation of T lymphocytes following GLD52 treatment in progressive MS patients was successfully characterized. Full treatment courses of GLD52 administered by SC injection were predicted to elicit T lymphocyte depletion comparable to alemtuzumab in MS patients.
Reference
-
1.
Mager DE. J Clin Pharmacol (2003): 1216.
T-055
Physiologically-based Pharmacokinetic (PBPK) Modeling to Predict Inter-ethnic PK differences in Exposure in Caucasian, Chinese and Japanese Populations: Voriconazole Case Study
Li Zhou1, Pradeep Sharma2, Hongmei Xu1, Nidal Al-Huniti1, Diansong Zhou1
1Quantitative Clinical Pharmacology, Early Clinical Development, IMED Biotech Unit, AstraZeneca, Boston, US; 2Safety and ADME Translational Sciences, Drug Safety and Metabolism, IMED Biotech Unit, AstraZeneca, Cambridge, UK
Objectives: Better understanding of the influence of ethnicity on drug exposure and response can ensure patient safety and minimize duplication of clinical studies. This analysis aimed to evaluate the ability of PBPK modeling to predict clinical exposure differences across various ethnic populations (Caucasian, Chinese and Japanese) using voriconazole as a test drug.
Methods: Full PBPK models integrating demographic, physiological and CYP2C19 genotype information of different ethnic populations were developed in the Simcyp simulator version 17. First order absorption model was applied. The literature Km values of CYP2C19 and 3A4, 3.5 and 0.15 µM, respectively, were used to retrograde the corresponding Vmax based on clinical data. Relative abundance in different CYP2C19 phenotypes were derived from in vitro human liver microsome data, and the abundances in Asian populations were optimized according to accumulated understandings by the field. Published voriconazole pharmacokinetic studies in Caucasian, Chinese and Japanese subjects were used to verify model predictions.
Results: The model well predicted pharmacokinetics for CYP2C19 phenotypes among Caucasians and Chinese, including ultra-rapid (UM), extensive (EM), intermediate (or heterozygous extensive metabolizer, HEM) and poor (PM) metabolizers. The pooled ratios of predicted-over-observed AUCs were 0.92–1.24. The prediction in Japanese PMs after multiple dosing was also well-captured by the model, with a AUC ratio of 1.18. Slight over-predictions (within 2-fold) were observed in Japanese EM after multiple dosing, which warrants further model investigations. Single oral dose data from limited number (n = 1–3) of Japanese subjects were also slightly lower than the predictions. Nevertheless, the concentration–time profiles were all reasonably captured in these three ethnic populations.
Conclusions: The Simcyp built-in mechanistic models of these virtual patient populations adequately described clinically observed voriconazole pharmacokinetic differences and can potentially be used to predict drug exposure across different ethnicities, in lieu of clinical trials addressing these specific ethnic PK differences.

T-056
Population Pharmacokinetic Modeling of Nusinersen in Patients Across Spinal Muscular Atrophy Phenotypes
Lilly East1, Joanna Peng2, Ivan Nestorov1, Eric Masson1
1Biogen Inc, Cambridge, MA, 2Nuventra Pharma Sciences, Durham, NC
Objectives: Nusinersen is an intrathecally-administered antisense oligonucleotide (ASO) and the only approved treatment of spinal muscular atrophy (SMA). Pharmacokinetic (PK) modeling on this new drug modality is limited, and previous analysis for nusinersen has been primarily focused on children with later-onset SMA, with the clinical experience in patients with pre-symptomatic SMA and infantile-onset SMA remain largely unaccounted for. Therefore, population PK modeling was conducted to characterize nusinersen PK and identify meaningful covariates across all SMA phenotypes.
Methods: Model development was conducted using data from 10 clinical trials, 274 patients, and across a dose range of 1–12 mg administered as different dosing regimens. Nusinersen cerebral spinal fluid (CSF) and plasma concentrations, and potential covariates were analyzed using NONMEM 7.3.
Results: Population PK parameters include CLCSF (clearance from CSF to plasma, 0.158 L/hr [25.8%]), CLplasma (2.78 L/hr [22.3%]), intercompartmental clearance of QCSF to CNS and Qplasma to peripheral (0.0783 L/hr and 0.24 L/hr, respectively) and apparent volume of distribution for VCSF, VCNS, Vplasma, Vperipheral (0.391 L [88.3%], 324 L, 39.3 L [31.4%], and 166 L, respectively), expressed as population estimates (mean [BSV %]). Time-varying body weight and age at first dose were found to be statistically significant covariates on nusinersen PK. After inclusion of the significant covariates, nusinersen plasma concentrations were largely dose-proportional between 1 and 12 mg, and the CSF concentrations were more than dose-proportional at doses ≤ 3 mg, and nearly dose proportional at doses greater than 3 mg. Within the treatment durations (up to 4 years), no time-dependent changes were observed in CLCSF.
Conclusions: A 4-compartment model comprised of CSF, CNS tissue, plasma and peripheral compartments was developed using sparse pre-dose CSF and plasma PK data to describe the disposition and population PK of nusinersen across SMA phenotypes, and continues to support a single dosing regimen across all SMA populations.
T-057
A Quantitative Systems Pharmacology Model of Colonic Motility to Aid Drug Discovery and Development
Zhang Liming1, Das Raibatak2, Wille Lucia2, Chen Chunlin1, Selimkhanov Jangir1, Wykosky Jill1, Winchester Wendy1, Almansa Cristina1, Burke John2, Hua Fei2, Vakilynejad Majid1
1Takeda Pharmaceuticals, Cambridge, MA, USA; 2Applied BioMath, Concord, MA, USA.
Objectives: Gastrointestinal (GI) motility disorders encompass a wide array of signs and symptoms that can occur anywhere throughout the gastrointestinal tract, and dramatically affect patients’ quality of life. There is no quantitative systems pharmacology (QSP) model available to assist drug discovery and development in this area. The aim of this study was to develop a colonic motility QSP model as part of GI motility platform to examine the functional effect of several marketed drugs used to treat constipation.
Methods: The colon motility was modeled as a series of connected compartments and used ordinary differential equations to describe the periodic influx of intestinal content, mass movement driven by high amplitude propagating contractions (HAPCs), nutrient and water absorption through the colonic wall, and periodic defecation. The physiological model was coupled with a biochemical model of 5HT signaling to understand how the enteric nervous system modulates colonic motility. Model parameters were calibrated to capture normal and slow transit constipation (STC) patient data gathered through an extensive literature review.
Results: A QSP model for colonic motility was developed. Model parameters were tuned in healthy controls to achieve a good match with reported HAPC frequencies and rates of influx and efflux. The model demonstrates that reducing HAPC frequency—an observed pathology in STC—leads to a lower frequency of defecation, and reduced water content in the stool, relative to healthy controls, consistent with observed symptoms of STC. Consistent with literature data, simulated treatment with a 5-HT4 receptor agonist or a secretagogue reverts these effects.
Conclusions: To our knowledge, this is the first QSP model for colon motility. This work lays the foundation of a platform for GI motility model to enable model-informed drug discovery and development. Future work will expand upon this model to include other parts of GI tract in targeted patient populations.
T-058
Quantitative Systems Pharmacology model of amyloid beta and plaque dynamics in Alzheimer’s Disease upon treatment with anti-amyloid beta drugs Crenezumab, Solanezumab, and Bapineuzumab.
Kumpal Madrasi1, Lin Lin1, Hafiz Abdul1, Carissa Young1, Jennifer Park1, John Burke1, Joshua Apgar1, Fei Hua1, and Lore Gruenbaum1,
1Applied BioMath, Concord, MA.
Objectives: With the high rate of failure for disease modifying treatments for Alzheimer’s Disease (AD; 99.6%—Cummings et al. 2014), there is an urgent need to: (1) better understand the failures, (2) improve clinical trial design, and (3) inform the next generation of therapeutics. In an attempt to address these needs, we present here a quantitative systems pharmacology (QSP) model describing amyloid beta (Aβ) dynamics in AD, incorporating mechanisms for multiple anti-Aβ drugs, and predicting plaque reduction over time.
Methods: A QSP model was developed describing three different pools of Aβ: monomer, soluble oligomer, and plaque for patients with mild to moderate AD. The model includes intercompartment transport of Aβ species between: brain interstitial fluid (ISF), cerebrospinal fluid (CSF), and plasma. The baseline model was calibrated with data from stable isotope labeling kinetics (SILK) experiments. Mechanisms for three anti-Aβ drugs, Crenezumab, Solanezumab, and Bapineuzumab, were added, and fitting was performed to publicly available pharmacokinetics (PK) and pharmacodynamics (PD) data from clinical studies.
Results: After fitting plasma PK, a single QSP model captured plasma Aβ, CSF Aβ, and plaque level changes reported from clinical trials of the three anti-Aβ drugs. Our analyses predict that with a hypothetical dose of 10 mg/kg, Solanezumab or Bapineuzumab that have a low affinity for plaque induces low plaque clearance over 5 years (5.2% and 1.8% respectively). In contrast, Crenezumab which binds with higher affinity to plaque is predicted to reduce plaque faster (32.6%).
Conclusions: We developed a single QSP model to describe the effects of anti-Aβ drugs on different Aβ species in AD patients. The model suggests that drugs with lower affinity to plaque will not reduce plaque significantly in 5 years. This model will be expanded to include tau biology, simulate effects of combination therapy, and simulate patient variability.
T-059
Power assessment for hierarchical combination endpoints using joint modelling of repeated time-to-event and time-to-event models versus Finkelstein-Schoenfeld method
Camille Vong1, Steve Riley2 and Lutz O. Harnisch3
Pfizer Inc, 1Clinical Pharmacology, Pharmacometrics, Cambridge, MA, USA; 2Clinical Pharmacology, Groton, CT, USA; 3Clinical Pharmacology, Pharmacometrics, Sandwich, UK
Objectives: Finkelstein-Schoenfeld (FS) [1] proposes a non-parametric test based on a score derived from subject-to-subject comparison of their time to an event, and the comparison of a longitudinal ancillary endpoint. The objective is to assess power performances of joint PK/PD models of a mortality time-to event endpoint, combined with a repeated-time-to-event model of hospitalization frequency to inform a dose recommendation for a cardiovascular-related rare disease.
Methods: Simulated PK-mortality-hospitalization data of a Phase 3 trial with 400 subjects were generated using MTIME for three different drug effect relationships and different degrees of correlation between endpoints. Data were analysed using a time-to-event (TTE), a repeated time-to-event (RTTE), a time-to-event model with hospitalization frequency as a time-varying covariate (TTE-COV), and a RTTE + TTE models linked by a common hazard with a scaling factor. Power curves and FS were generated with the parametric power estimation (PPE) algorithm and with SAS, respectively.
Results: For all 3 scenarios investigated, the median estimated PPE curves were in general in the following order: TTE, FS, TTE-COV, RTTE and RTTE + TTE. For instance, the power to detect drug effect at the original simulated sample size, was 30, 44, 54, 55, 59, and 72%, respectively for an Emax relationship. Type I error rates for the respective models were found to be 1, 4, 6, 7 and 5%, respectively.
Conclusions: Using all available survival and hospitalization data in patients and enabling a two-dimensional evaluation of an exposure–response relationship suggest that the power to detect a drug effect can be substantially increased using the proposed joint PK/PD models. Thus, they may be considered for smaller sample sizes to detect the same treatment effect in future trials.
Encore: The results in this abstract have been previously presented orally in part of Stuart Beal Methodology session at PAGE 27, Montreux, Switzerland, May 30th, 2018 and published in the conference proceedings as a longer abstract PAGE 27 (2018) Abstr 8762.
Reference
-
1.
Finkelstein DM, Schoenfeld DA. Combining Mortality and Longitudinal Measures in Clinical Trials. Statist. Med. 1999; 18; 1341–1354.
T-060
A Model of Endogenous and Meal-Induced Triglycerides (TG)- Population PKPD of GSK3008356 in Healthy Subjects
Malek Okour, BDS, Ph.D.; David Tenero, PharmD; Richard Brigandi, MD, Ph.D.
GlaxoSmithKline, Upper Providence, PA, USA
Objectives: Nonalcoholic steatohepatitis (NASH) is a fatty liver disease in which fatty liver infiltration is accompanied by liver inflammation. GSK3008356 is under development as a potent and selective inhibitor of diacylglycerol acyltransferase 1 (DGAT1), a key enzyme involved in the formation of triglycerides (TG). Decreased DGAT1 activity may reduce circulating and liver TG and could potentially treat NASH. The aim of the current study is to develop a population PKPD model that characterizes the PK disposition of GSK3008356 and its relation to the changes in blood TG following oral administration of the drug to healthy subjects.
Methods: Drug concentrations were measured in 104 healthy adults receiving various single (SD) and repeat doses (RD) in a first time in human (FTIH) study (funded by GlaxoSmithKline). A fat meal was given at hour 2 post-dose with postprandial TG assessment performed by collecting blood TG samples at various time points. The population PKPD model consists of several parts including a PK model, drug-effect model, meal-effect model, and a turnover model.
Results: The pharmacokinetic data were best described using an oral 3-compartment model with first-order elimination. Drug effect was described by a sigmoidal Emax model. Since TG levels change with the introduction of a meal, a meal-effect model was utilized with a bi-exponential equation to account for changes in TG. The total change in TG was fitted using a turnover model with drug and meal effects on the TG production rate. Goodness of fit metrics demonstrated overall adequacy of the PKPD model.
Conclusion: The current analysis presents a novel PKPD modeling strategy of time-varying TG data coming from both endogenous and exogenous sources in healthy volunteers. In general, the presented model could be utilized in the model-based drug development of drugs that influence TG levels in blood.
T-061
Disease progression model platform to inform efficient clinical trial design for Parkinson’s Disease
Malidi Ahamadi1, Daniela J Conrado2, Sreeraj Macha1, Vikram Sinha1, Julie Stone1, Timothy Nicholas3, Chao Chen7, Jill Gallagher4, David Dexter4, Massimo Bani5, Babak Boroojerdi5, Jonas Weidemann6, Minhua Yang8, Pierandrea Muglia5, Michele Hu9, Rachel Lawson10, David Burn10, Ken Marek11, Jackson Burton2, Diane Stephenson2, Renee Hynds2, Klaus Romero2 on behalf of the Critical Path for Parkinson’s (CPP) Consortium
1Merck, Kenilworth, NJ, USA;2Critical Path Institute, Tucson, AZ, USA; 3Pfizer, Groton, CT, USA; 5UCB, Brussels, Belgium, 4Parkinson’s UK, 6Lundbeck, 7GSK UK, 8Biogen, 9OPDC, 10ICICLE, 11PPMI
Objectives:Trial design optimization is essential in Parkinson’s disease (PD) drug development programs. The Critical Path for Parkinson’s (CPP) consortium has achieved EMA qualification of an enrichment biomarker and is in the process of developing clinical trial simulation tool for PD. The objective of this work is to develop a structural model to characterize disease progression in PD patients using the integrated CPP database and provide sample size estimations using clinical trial simulations.
Methods: A disease progression model characterizing the time course of MDS-UPDRS Part II and Part III, was developed using an integrated dataset comprised of multiple observational studies (PPMI, ICICLE). Covariates including demographic factors, time from diagnosis, genetic status (GBA and LRRK2 mutation) and background medications were assessed using the SCM method. Monte Carlo simulations were performed to compare the statistical power by sample size in trials with and without enrichment using relevant covariates.
Results: The generalized logistic model described adequately the integrated dataset. Preliminary covariate analyses indicated age had a significant effect on baseline severity and GBA mutation had an increase of progression rate on slope. The disease progression rate was estimated to be ~ 0.21 points/month. For a 24-month parallel design that is enriched with carriers of GBA mutation, approximately 76% power is achieved with 600 patients per group for a therapeutic effect targeting 50% reduction in disease progression rate compared to 69% power for the non-enriched trial with the same number of subjects and therapeutic effect.
Conclusions: The insights from the disease progression model are valuable to inform inclusion criteria and enrichment strategies for long-term trials. The current quantitative methodology permits a comprehensive integration of relevant patient characteristics available for decision-making.
T-062
Development and Application of Large-Scale Data-Driven Latent Viral Dynamics Model (LVDM) To Inform HIV Cure Drug Development
Malidi Ahamadi1, Youfang Cao1, 2Kyle Baron, 2Timothy Knab, Munjal Patel1, Daniel Rosenbloom1, Ryan Vargo1
1Pharmacokinetics, Pharmacodynamics and Drug Metabolism, Merck & Co., Inc., Kenilworth, NJ, 2Metrum Research Group, CT USA
Objectives: Current antiretroviral therapies (ART) control HIV disease in many patients, but do not cure HIV. As highly effective treatment combinations emerge, there is consideration as to whether these drugs, together with new targets and approaches, might allow for cure outcomes. Drug development of HIV cure requires mechanistic modeling of within-host infection. We extended the latent viral dynamics model (LVDM) [1] (Figure) to include components that may inform ability to achieve cures. We aim to build a mechanistic modeling platform driven by clinical data to accurately and reliably inform HIV cure clinical strategy.
Methods: We implemented a virtual population method [2] and also developed a multi-staged approach to fit the LVDM to viral load (VL) from clinical trials of both HIV treatment and analytical treatment interruption (ATI). The model fitting used an improved log-likelihood function to capture the below-limit-of-quantification (BLQ) VL data by assuming a Gaussian distribution.
Results: Both methods described the VL data of individual participants in a phase III HIV treatment trial (N = 659). Key parameter estimates, and their precisions are all within biologically plausible ranges (Figure). Clinical trial simulations (CTS) based on these fits showed clear correlation between the final endpoint of viral rebound time and the estimated size of the latent reservoir before ATI, one of the key parameters in HIV cure. These results quantitatively inform the degree of latency eradication required to achieve long-term HIV control or cure.
Conclusions: High-quality model fits were obtained for a large population of treatment responders, which is the population of interest for initial HIV cure trials. The data-driven LVDM can be leveraged to explore HIV cure through large-scale CTS. Overall this platform can be applied to enable model-informed HIV cure drug development.

References
-
1.
PNAS April 28, 2015. 112 (17) 5467–5472.
-
2.
CPT Pharmacometrics Syst. Pharmacology. (2016) 5, 140–146.
T-063
Modeling the probability of HIV infection over time in seronegative participants in high risk undergoing placebo PrEP treatment
Maria Garcia-Cremades1, Craig Hendrix2, Leah Jarlsberg1, Robert Grant3, Connie L. Celum4, Michael Martin5,6, Jared Baeten4, Jeanne Marazzo7, Peter Anderson8, David Glidden9, Radojka M. Savic1
1Department of Bioengineering and Therapeutic Sciences, University of California San Francisco, San Francisco, USA; 2Division of Clinical Pharmacology, Department of Medicine, Johns Hopkins University, Baltimore, MD, USA; 3Department of Medicine, University of California San Francisco, San Francisco, USA; 4Departments of Global Health, Medicine, and Epidemiology, University of Washington, Seattle, WA, USA; 5Thailand Ministry of Public Health-US CDC Collaboration, Nonthaburi, Thailand; 6Centers for Disease Control and Prevention, Atlanta, GA, USA; 7Division of Infectious Diseases, University of Alabama at Birmingham Medical Center, Birmingham, Alabama, USA; 8Department of Pharmaceutical Sciences, University of Colorado, Denver; 9Department of Epidemiology and Biostatistics, University of California San Francisco, San Francisco, USA
Objectives: The World Health Organization [1] recommended using preexposure prophylaxis (PrEP) in people at risk of HIV infection. Identifying sub-groups with a higher HIV risk in different target populations will provide key insights for interpreting study outcomes and suggesting future directions for PrEP clinical trial designs and targeted intervention.
Methods: The probability of HIV infection over time was analyzed through parametric survival analysis in NONMEM7.4 using placebo data from longitudinal PrEP trials: iPrEX [2] (n = 1218), VOICE [3] (n = 2008), Partners [4] (n = 1574), and Bangkok [5] (n = 177). Studies were analyzed separately due to availability of different baseline covariates and target populations. Baseline survival models were evaluated (exponential, Gompertz or Weibull), and covariates were selected with consideration of scientific plausibility, statistical significance and clinical relevance. Simulations of HIV probability for the identified subgroup populations were performed with simulx (Rpackage).
Results: Exponential hazard distribution best fitted the survival data for the four studies. In iPrEX, significant covariates were “non-condom receptive anal intercourse in the 3 months prior” (p < 0.001) and age (p < 0.05). Syphilis seroreactivity was selected by graphical analysis. In VOICE, significant covariates were HSV2 status (p < 0.05), age (p < 0.001), and marital status (p < 0.001). In Bangkok, significant covariates were sex and drug injection frequency (p < 0.05). In Partners, age and sex were selected by graphical analysis.
Conclusion: The analysis identified sub-groups of people at higher risk of HIV infection (Figure 1) in different target populations. Additionally, women appear to be at higher risk than men. There is a substantial difference in risk profile between “high-risk subgroups” in different target populations, while “low-risk subgroups” are similar across target populations. The established quantified models will be used to optimize future PrEP clinical trial design, refine the definition of preventative concentration, and identify target populations.

Fig. 1 Simulated HIV probability for the identified sub-populations at higher and lower risk of infection
References
-
1.
WHO/HIV/2015.48.
-
2.
Grant RM. NEJM 2010;363:2587–99.
-
3.
Marrazzo JM. NEJM 2015; 372:509–18.
-
4.
Baeten JM. NEJM 2012; 367:399–410.
-
5.
Choopanya K. LANCET 2013; 381:2083–90.
T-064
A Model-based Approach to Bridging Plasma and Dried Blood Spot Concentration Data for Phase 3 Verubecestat Trials
Marissa F. Dockendorf1, David Jawarowicz2, Rebecca Humphrey2, Melanie Anderson1, Sheila Breidinger1, Bhavna Kantesaria1, Kevin P. Bateman1, Eric Woolf 1, Julie Stone1
1Merck & Co., Inc., Kenilworth, NJ, USA; 2Cognigen, Buffalo, NY, USA.
Objectives: Following initial evaluations from simultaneously-sampled dried blood spot (DBS) and plasma concentrations in the verubecestat EPOCH trial, plasma sampling was discontinued, and DBS was intended as the sole pharmacokinetic (PK) matrix for the remainder of the trial [1]. Subsequently, a stability issue with DBS emerged necessitating re-examination of the DBS-plasma bridging approach. A conversion algorithm for calculating plasma-equivalent concentrations from DBS concentrations accounting for sample stability was developed to enable verubecestat population PK analysis from pooled plasma and DBS samples.
Methods: Verbuecestat concentrations from available time-paired DBS and plasma samples were graphically explored including assessing relationships with potential influencing factors. Regression analyses were performed in NONMEM to establish the DBS to plasma-equivalent concentration algortihm. Forward selection along with standard goodness-of-fit criteria were used to select the most appropriate factors for inclusion in the algorithm.
Results: The conversion algorithm described decreasing DBS/plasma ratios with increasing time-to-assay, with varying rates of decline associated with sample handling/storage factors identified as significant predictors of DBS degradation. Baseline hematocrit was also included as a predictor of the DBS-plasma relationship. A 250 day time-to-assay limit was established for inclusion of DBS-derived concentrations in the population PK analysis based on available data range. Verubecestat population PK models developed from (1) plasma and plasma-equivalent concentrations from acceptable DBS samples (2) plasma-only data were similar, supporting sufficiency of the applied conversion algorithm.
Conclusions: Novel sampling approaches such as DBS have the potential to decrease patient burden and provide augmented clinical trial datasets and are a key component to enabling a shift toward more patient-centric trials. However, unanticipated challenges can occur in moving from well-controlled early phase to late stage trials. It is imperative that we learn from these experiences and adapt as necessary to enable successful implementation of these approaches.
Reference
-
1.
AAPS J. 2016;18(2):519–527.
T-065
A semi-mechanistic model describes platelet count time-course following PF-04965842 administration to patients with moderate to severe atopic dermatitis
Elena Soto1, Chris Banfield2, Pankaj Gupta3, Mark C. Peterson4
Pfizer, Inc1−4, Global Pharmacometrics1,4, WRD Clinical Pharmacology2, Global Clinical Pharmacology3, Sandwich, UK1, Cambridge, MA2,4, Groton, CT3, USA.
Objectives: To develop a semi-mechanistic model to characterize the time course of the drug induced platelet count reduction and recovery during the administration of PF-04965842 in a Phase 2 trial of atopic dermatitis patients.
Methods: A multi-center, randomized (ratio of 1:1:1:1:1), double-blind, Phase 2 proof-of-concept trial in adults with atopic dermatitis investigated, in parallel, doses of 10, 30, 100 and 200 mg PF-04965842 or placebo taken orally once daily for 12 weeks (n = 267; 56, 49, 51, 56 and 55, respectively). Platelet counts from a total of 264 subjects, measured at screening, baseline, and weeks 1, 2, 4, 6, 8, 12 (on treatment), and 13, 14 and 16 (off-treatment follow-up) were modeled using the first-order conditional estimation method (FOCE I) in NONMEM version 7.3.
Results: A semi-mechanistic model [1] consisting of a platelet proliferation pool, 3 transit compartments (platelet maturation) and a circulating platelet compartment described the time-course of platelet counts. Drug was linked to the effect via a kinetic pharmacokinetic (KP) model. The final model consisted of ke (0.278 h−1), three system parameters: platelet baseline (272 × 1000/µL), mean transit time (197 h) and Gamma (0.314), a drug parameter (Slope 0.00231 mg−1) and a combine additive and proportional residual error. Inter-individual variability was estimated in BASE and Slope and the correlation between these parameters was also estimated. The developed model returned predictions consistent with the observed on-treatment, and off-treatment platelet count changes following PF-04965842 administration (see Figure 1).
Conclusions: Platelet count time-course following the administration of PF-04965842 was adequately described by a semi-mechanistic model consisting of system parameters (BASE, MTT, Gamma) and drug parameters (Slope). A KP model approach was adequate to link the drug dose to the drug effect and returned reasonable predictions of both on- and off-treatment effects of PF-04965842.

Fig. 1 Visual predictive check of platelet counts over time. Lines represent the median (solid line), 2.5th, and 97.5th percentile (dashed lines) of observed (red) or simulated platelet counts (black)—semi-transparent areas are 95% confidence intervals of simulation-based median and percentiles (Color figure online).
Reference
-
1.
Friberg et al., J. Clin.Oncol. 20, 4713–4721 (2002).
T-066
Dose–Response Analyses of IGA and EASI Scores Following PF-04965842 Administration in Moderate to Severe Atopic Dermatitis Patients
Rujia Xie1, Chenhui Deng2, Chris Banfield3, Pankaj Gupta4, Mark C. Peterson5
Pfizer, Inc1,3−5, Global Pharmacometrics1,5, WRD Clinical Pharmacology3, Global Clinical Pharmacology4, Singapore1, Cambridge, MA3,5, Groton, CT4, USA; CStone Pharmaceutical Ltd, Shanghai, China2
Objectives: To characterize the dose–response (DR) relationship of PF-04965842 with the week 12 Investigator’s Global Assessment (IGA) response, and Eczema Area and Severity Index score (EASI) at all time points in atopic dermatitis patients.
Methods: A multi-center, randomized (ratio of 1:1:1:1:1), double-blind, Phase IIb proof-of-concept trial in adults with atopic dermatitis (AD) investigated, in parallel, doses of 10, 30, 100 and 200 mg PF-04965842 or placebo taken orally QD for 12 weeks (n = 267; 56, 49, 51, 56 and 55, respectively). This efficacy analysis utilized week 12 non-responder imputation IGA (binary, n = 245 observations) and EASI (continuous) from Day 1(week 0), day 8 (week 1), week 2, 4, 6, 8, 12, 13, 14 and 16 (n = 2220 observations). Dose–response modeling was performed using NONMEM (v. 7.3) and Perl-speaks-NONMEM (v. 4.2.0). Methods used were LAPLACE for week 12 IGA categorical response data and first-order conditional estimation method with interaction (FOCEI) for time-course EASI score data. The final models were intended to be used to predict placebo-corrected response rates across a range of doses.
Results: Week 12 IGA categorical response and EASI score were described using proportional odds and linear Indirect Response (IDR) models, respectively. For both models all parameters were well estimated (see Table 1). For IGA response, the half-maximal effective dose was estimated at 145 ± 21.9 mg. For EASI score, a linear increase in effect across the dose range described the observed changes over time and provided predictions of 75% reductions in EASI from baseline (EASI75).
Conclusions: Both IGA response at week 12 and EASI score time-course and dose–response following the administration of PF-04965842 were adequately described by the applied models. These models provide platforms for informative simulations to support subsequent trial designs evaluating PF-04965842 in moderate to severe atopic dermatitis patients.
Table 1 Parameter estimates of dose response models for week 12 IGA and EASI Score over time
Parameter | Description | Estimates ± SE (or RSE%) | IIV (RSE%) |
|---|---|---|---|
IGA response at week 12 | |||
B1 | Logit value of baseline | −2.69 ± 0.425 | |
Emaxa | Maximum effect of drug | 4.26 ± 1.72 | |
ED50a | Dose to reach half of Emax | 145 ± 21.9 | |
Longitudinal dose–response model for EASI score | |||
E0a | EASI score at baseline | 21.7 (1.58) | 0.351 (5.18) |
Kouta (week−1) | Elimination rate constant | 0.0674 (−1.11) | |
Peffa | Coefficient of placebo on Kout | 0.585 (−52.9) | 2.98 (20.7) |
Dslpa (mg−1) | Slope of dose on Kout | 0.0252 (−6.16) | 2.22 (22.1) |
SD | Additive residual | 0.967 (6.51) | |
CV (%) | Proportional residual | 0.401 (1.51) | |
T-067
Application of Feto-Maternal Physiologically-Based Pharmacokinetic model To Predict Emtricitabine Concentration during Pregnancy
Khaled Abduljalil1, Trevor N. Johnson1, Masoud Jamei1
1Certara UK Limited, Simcyp Division, Sheffield, S1 2BJ, United Kingdom
Objectives: To use a Physiologically-Based Pharmacokinetic (PBPK) model for prediction of Emtricitabine Concentration in Pregnant women.
Methods: A full Feto-Maternal PBPK model was developed using physiological [1,2] and drug specific parameters [3] to predict Emtricitabine concentration in 100 virtual pregnant term mothers after single administration of 400 mg. The model coded using the Simcyp Lua interface within the Simulator. Transplacental kinetics was obtained from experimental perfusion model [3]. Predictions of emtricitabine maternal and fetal plasma concentration were performed and compared to reported observations [3].
Results: In spite of the large variability in the observed data, the model adequately replicated the maternal as well as fetal clinical observations [3,4]. The maternal observed vs predicted median AUC24hr was 14.3 vs 13.4 mg/L*h, while the median Cmax was 1.7 vs 2.7 mg/L and the mean CLpo was 39.9 vs 31 L/h. The fetal observed vs predicted median AUC24 h was 9.33 vs 11.3 mg/L*h and the median Cmax was 0.72 vs 0.95 mg/L.
Conclusion: The developed feto-maternal PBPK models can be used to predict drug exposure in inaccessible fetal organs during utero growth. The inter-subject variability can be predicted incorporating both the drug physicochemical properties and system (mathernal and fetal) parameters.

References
-
1.
Abduljalil et al., Fetal physiologically‐based pharmacokinetic models: systems information on fetal biometry and gross composition. Clin Pharmacokinet (2017).
-
2.
Abduljalil et al., Fetal Physiologically-Based Pharmacokinetic Models: Systems Information on Fetal Organs growth and their Compositions (submitted).
-
3.
De Sousa Mendes et al., Prediction of human fetal pharmacokinetics using ex vivo human placenta perfusion studies and physiologically based models. Br J Clin Pharmacol. 2016.
-
4.
Hirt D et al., Very high concentrations of active intracellular phosphorylated emtricitabine in neonates (ANRS 12109 trial, step 2). Antimicrob Agents Chemother. 2011.
T-068
Exposure–response population analysis of padsevonil (PSL) in adult patients with highly drug-resistant focal epilepsy
Massimiliano Germani (1), Brigitte D. Lacroix (1), David Sciberras (1), Miren Zamacona (2)
(1) UCB Pharma, Braine-l’Alleud, Belgium, (2) UCB Pharma, Slough, UK
Objectives: Exploring the relationship between PK, pharmacodynamics of PSL, and the probability of adverse events (AEs) in treatment-resistant epilepsy population, while assessing inter-subject variability and covariate relationships.
Methods: The modeling of PK, clinical outcome and tolerability was based on data from the PoC study in 55 drug-resistant patients receiving 400 mg/bid. A population PK model was developed based on rich sampling, 2 dosing occasions and sparse samples. The individual predicted daily average plasma concentration obtained from the PK model (Cavg) was integrated in the PKPD model describing the longitudinal daily seizure counts. The PSL effect on seizure reduction was described using a negative binomial distribution, accounting for previous-day seizure frequency1. The tolerability was explored linking the Cavg with the treatment emergent AEs grouped in three categories: psychiatric disorders, central nervous system disorders and a combination of the central nervous system and general disorders e.g. “fatigue”, “gait disturbance”. Tolerability was analyzed using a proportional odds model assuming consecutive scores to be highly-correlated.
Results: Baseline seizure rate was 1.3 day−1, placebo effect 20% and EC50 = 190.6 ng/mL. A bi-modal distribution was used to separate the population into responders and non-responders, with 45% of patients classified as responders. The tolerability model showed that the probability of moderate to severe AEs for doses lower than 200 mg/bid are similar to that in placebo. There was no AE dose dependency when comparing 200 mg/bid with 400 mg/bid.
Conclusions: PKPD analysis allowed estimation of a precise PSL EC50 which should be considered in relation to the severity of the patient population, and the protocol design. PSL showed an antiepileptic drug effect additional to the 20% placebo effect. Provided the limitation of the current dataset, no AEs dose-dependency was evident with increasing doses from 200 mg/bid to 400 mg/bid.
Reference
Schoemaker R et al. Journal of Clinical Pharmacology 56:1591–1602 (2016).
T-069
Shortened PANSS and Shorter Trial Duration as Alternate Clinical Endpoint for Acute Schizophrenia Trials is a Feasible Option : Analysis from the US Food & Drug Administration
Mathangi Gopalakrishnan1, Hao Zhu2, Ramana Uppoor2, Mehul Mehta2, Tiffany Farchione2, Mitchell Mathis2, Islam Younis2
1Center for Translational Medicine, University of Maryland, Baltimore; 2Center for Drug Evaluation and Research, US Food and Drug Administration
Background: Registration trials for acute schizophrenia are 6-week, placebo controlled with mean change from Baseline (CFB) in a 30–item Positive and negative symptom score (PANSS) as the primary end point. The aim of the analysis was to evaluate the feasibility of using a shortened (modified) version of PANSS and shorter trial duration for demonstration of efficacy for acute schizophrenia.
Method: The master database (32 trials, 14219 subjects) consisted of efficacy information from eight new drug applications submitted to FDA between 2001 and 2015. Item response theory (IRT) analysis was performed on PANSS items at baseline to derive modified PANSS (mPANSS). The mean CFB in PANSS and mPANSS at 4 & 6 weeks were estimated using mixed model repeated measures and compared with the original pre-specified analysis. Concordance rates of the 6-week and 30-item PANSS trial results and implication of a shorter trial with mPANSS on the sample size requirements were assessed.
Results: The IRT analysis identified 19 out of 30 PANSS items (5 positive, 6 negative and 8 general psychopathology) as sensitive to reflect the underlying schizophrenia symptom severity. The effect size using mPANSS at 4 weeks was found to be similar to a 6-week 30-item PANSS trial. The concordance rate of mPANSS at 4-weeks or 6-weeks vs a 6-week total PANSS trial were 93% and 98% respectively. A 4-week trial using mPANSS required a 6% increase in sample size, whereas a 6-week trial using mPANSS had a 32% reduction in the sample size as compared to a 6-week trial using total PANSS.
Conclusions: Use of change from baseline in mPANSS at 4 weeks can be considered a feasible alternate endpoint for acute schizophrenia registration trials, given the advantage of a shorter trial and a shorter administration of PANSS to patients.
T-070
Model-Based Meta-Analysis to Improve Drug Development Decisions for Weight Loss Compounds
Matthew L. Zierhut1, Mahesh N. Samtani2, José Pinheiro1, Peggy Wong3
1Statistics & Decision Sciences: Statistical Modeling & Methodology; 2Global Clinical Pharmacology; 3Quantitative Sciences – Janssen Research & Development
Objectives: Despite the variety of approved drugs that lead to weight loss, there remains an unmet need for a safe and effective therapy for many overweight/obese patients. Model-based meta-analysis (MBMA) is a tool that can summarize data available in the public literature with a model that can be used to quantify the competitive landscape, to simulate future clinical trials, and to estimate probability of development success. The objective of this work was to develop an MBMA to quantify the competitive landscape for weight loss in both diabetic (T2DM) and non-T2DM obese populations, and to project probability of successful development of early compounds.
Methods: Utilizing data from 76 trials, a mixed effects longitudinal model was developed to characterize mean percent change from baseline weight (ΔW) for various doses of ten drugs and placebo. As some drugs have been tested in both T2DM and non-T2DM obese populations, the model was also used to assess the difference in ΔW between these populations. A validation step was performed by training the MBMA with a small, 6-week, dose-ranging trial1 (representing a typical trial in early development). The updated MBMA was then used to simulate a Phase 3 trial2 and compare to actual observed ΔW over time.
Results: Figure 1 shows the process used to develop and validate an MBMA for ΔW. The model was able to both quantify the competitive landscape for ΔW and accurately predict Phase 3 results for sibutramine.
Conclusions: MBMA was shown to be a valuable tool to quantify the competitive landscape in weight loss and project probability of technical and trial success with limited compound-specific data. This approach is currently being utilized to help with internal decisions for compounds in early development.

Fig. 1 MBMA Validation Process: 1. Acquire mean weight loss data from network of trials (including small dose-ranging trial with validation compound: sibutramine); 2. Develop Model-Based Meta-Analysis (MBMA) to properly quantify competitive landscape for placebo (pbo) corrected weight loss; 3. Use MBMA to simulate Phase 3 results for sibutramine and compare to actual trial results. Symbols represent observed data. Solid lines and shaded areas represent MBMA prediction and 95% confidence intervals, respectively. Colors represent drugs and/or doses (see legends) (Color figure online).
References
-
1.
Bray GA, et al. Obes Res. 1996 May;4(3):263–70.
-
2.
Wirth A, Krause J., JAMA. 2001 Sep 19;286(11):1331–9.
T-071
Exposure–response analyses of rovalpituzumab tesirine in studies of small-cell lung cancer: pooled-analysis of phase I and II studies
Kevin J. Freise1, Sven Stodtmann1, Sven Mensing1, Emily O. Dumas1, Scott Gulbranson1, Wei Liu1, Matthew P. Kosloski1
1AbbVie Inc., North Chicago, IL, USA
Objectives: To determine the rovalpituzumab tesirine (Rova-T) antibody–drug conjugate (ADC) exposure–response relationships for overall survival (OS), objective response (OR), and adverse events of special interest (AESI; pleural effusion, pericardial effusion, generalized edemea, and photosensitivity reaction) in small-cell lung cancer patients.
Methods: A completed phase I and an ongoing phase II study with a total of 413 SCLC subjects were pooled for the analysis. Individual subject Rova-T ADC concentrations were determined using a population PK model. Cox proportional hazards (CPH) models were used for OS and individual AESI, while a logistic regression model was used for OR. Covariates were identified using a step-wise model building procedure.
Results: Exploratory plots and CPH regression of OS vs. average Rova-T concentration over 12 weeks (Cavg,12wk) indicated a positive significant (P < 0.01) association of Rova-T with reduced the risk of death (Figure 1). Similarly, logistic regression of OR vs. Cavg,12wk indicated a positive significant (P < 0.01) association of Rova-T on the probability of achieving OR. Sensitivity analyses, including a time-variant CPH model, confirmed these associations. Baseline Eastern Cooperative Oncology Group (ECOG) performance status score and sum of tumor diameters (SOD) for target lesions were identified as covariates negatively associated with OS. Separate CPH regression of grade ≥ 3 AESI vs. Cavg,12wk indicated no significant (P > 0.01) association with Rova-T.
Conclusions: Based on a typical subject Cavg,12wk of 1.50 μg/mL, two intravenous infusions of 0.3 mg/kg Rova-T administered 6-weeks apart was associated with a 67.9% (95% CI: 54.1%, 77.6%]) decrease in the risk of death over the baseline risk without treatment. No significant associations were identified between Rova-T exposure and pleural effusion, pericardial effusion, generalized edema, or photosensitivity reaction in the studied population.
Disclosures: The study was funded by AbbVie. AbbVie contributed to the study design, research, and interpretation of data, writing, reviewing, and approving the publication. All authors are AbbVie employees and may hold AbbVie stocks or options.

Fig. 1 Kaplan–Meier Estimator Curves of OS by Rova-T Cavg,12wk (μg/mL) Quartile. ‘+’ symbols indicate censoring. Strata are the Cavg,12wk quartiles in units of (μg/mL).
T-072
Population pharmacokinetics of rovalpituzumab tesirine, an antibody–drug conjugate, in phase I and II studies of small-cell lung cancer
Sven Stodtmann1, Kevin Freise1, Denise Beck1, Sven Mensing1, Wei Liu1, Matthew P. Kosloski1
1AbbVie Inc., North Chicago, IL, USA
Objectives: To develop a population PK model and assess the impact of intrinsic and extrinsic factor covariates on systemic Rova-T exposure in SCLC patients.
Methods: A nonlinear mixed-effects model was developed to characterize the population PK of rovalpituzumab tesirine (Rova-T) antibody–drug conjugate (ADC) after intravenous (IV) infusion at 0.05 to 0.8 mg/kg in 429 small-cell lung cancer (SCLC) subjects enrolled in two phase I and one phase II studies. Covariates associated with inter-individual variability in PK parameters were determined using a forward inclusion (α = 0.01), backward elimination (α = 0.001) model building procedure. Intrinsic and extrinsic factors evaluated included demographics, baseline clinical chemistries, hepatic and renal function, tumor antigen expression, anti-therapeutic antibodies, and drug formulation.
Results: A linear two-compartment PK model parameterized in terms of clearance (CL) adequately described the systemic concentration–time data. Bodyweight was incorporated as a covariate on both CL and central volume (V) in the base model. The model building procedure identified effects of albumin, aspartate aminotransferase (AST), and sex on CL, and of sex on V. AST was positively correlated with CL. No other intrinsic or extrinsic factors were identified. The terminal elimination half-life was typical for an ADC of 15.4 days. Visual predictive checks indicated the final model described the central tendency and the variability (5th and 95th percentile) of observed data. Bootstrapping confirmed the robustness of estimated parameters.
Conclusions: Individual Rova-T ADC systemic concentration–time profiles in SCLC patients were well described by a two-compartment PK model incorporating effects of sex, body weight, baseline AST, and baseline albumin. These intrinsic factors were associated a small magnitude of impact on exposure and were not considered clinically relevant.
Disclosures: The study was funded by AbbVie. AbbVie contributed to the study design, research, and interpretation of data, writing, reviewing, and approving the publication. All authors are AbbVie employees and may hold AbbVie stocks or options.
T-073
Modeling Fluid Volume and Serum Creatinine Dynamics During Acute Kidney Injury and Edema
Megan P. Cala1, Gilles Clermont1,2, John T. Maclin1, and Robert S. Parker1,2,3
1Department of Chemical & Petroleum Engineering, University of Pittsburgh, Pittsburgh, PA, USA; 2Department of Critical Care Medicine, University of Pittsburgh, PA, USA; 3Department of Bioengineering, University of Pittsburgh, PA, USA.
Objectives: Acute kidney injury (AKI), a sudden decrease in renal function, is common in critically ill patients. AKI is linked to a decrease in glomerular filtration rate (GFR), and is typically diagnosed by a decrease in urine output and a rise in serum creatinine (SCr) as a surrogate for GFR. The interplay of hydration status, SCr, and GFR is highly variable, leading to challenges in diagnosing AKI magnitude. The development of a physiologically-based, low-order model of volume and SCr dynamics can improve AKI diagnosis.
Methods: Fluid distribution is modeled with a four-compartment (serum, hematocrit, interstitial, and intracellular) nonlinear model. SCr dynamics are also modeled with four-compartments, though the intracellular and interstitial volumes are re-distributed as muscular and non-muscular tissues to account for creatinine production from muscle. The model is informed with patient-specific fluid administration, urine production, non-urinary volume losses, and SCr measurements during an ICU time-course. GFR and tubular filtration rate are time-variant and fit via nonlinear least-squares to available clinical SCr and volume data.
Results: Using a patient-specific normalized GFR profile (1 = health; 0 = no kidney function), the model can capture the 14-day SCr trajectory of a patient exhibiting an AKI event followed by restoration of kidney function with a normalized relative-mean-square deviation of 0.15. This proof-of-concept model will be extended, and the model refined, to capture a larger bank of critical care patients from the UPMC health record experiencing various levels of AKI and fluid loading.

Conclusions: The dynamic model predicts a longer sustained injury to yield an equally-elevated SCr when compared to a fixed-volume model, implying that using SCr to gauge injury without fluid volume correction may underpredict AKI severity. A patient-specific AKI model could aid in the development of a physiologically-motivated set of criteria for AKI staging and potentially enable earlier AKI detection.
T-074
Where’s the sodium? Model-based support for the role of peripheral sodium storage in sodium homeostasis in therapeutic electrolyte-free water clearance
Md Fazlur Rahman1, Gabriel Helmlinger2a, David W. Boulton2b, Peter J. Greasley2c, K. Melissa Hallow1
1School of Chemical, Materials, and Biomedical Engineering, University of Georgia, Athens, GA, USA. 2Innovative Medicines and Early Clinical Development Biotech Unit, AstraZeneca, 2aWaltham, MA, USA, 2bGaithersburg, MD, USA, 2cGothenburg, Sweden
Objectives: Recent clinical findings of SGLT2 inhibitor (SGLT2i)-mediated cardiovascular protection are compelling, however the underlying mechanism is incompletely understood. Coupling a sodium (Na+) and volume homeostasis model with clinical biomarker data, we recently showed that a non-osmotic Na+ storage compartment is necessary to reproduce observed changes in electrolyte-free water clearance (eFWC), due to osmotic diuresis with SGLT2i, while also reproducing observed constant blood Na+ levels. We proposed that peripheral Na+ storage plays an important role in determining the effect of eFWC on relative changes in interstitial and blood volumes, potentially contributing to reduced heart failure hospitalization with SGLT2i.
The role of peripheral Na+ storage in Na+ homeostasis is increasingly recognized but not well established. In this study, we sought further evidence to test or refute the role of this compartment on volume responses to therapies eliciting increases in eFWC by modeling previously published responses to tolvaptan, a vasopressin antagonist that causes eFWC without impacting Na+ excretion.
Methods: We coupled a pharmacokinetic-pharmacodynamic (PK-PD) model of tolvaptan with a three-compartment (blood, interstitial fluid and an optional peripheral Na+ storage compartment) model of fluid and Na+, based on published urine, plasma PK and biomarker data for tolvaptan [1]. PK, daily urinary water excretion and water intake data were used to fit the model, and the ability to predict blood Na+ concentration, with and without the third Na+ storage compartment, was evaluated.
Results: Without a peripheral Na+ compartment, increases in plasma Na+ concentrations were vastly overpredicted. Turning on the peripheral Na+ compartment allowed to fit the relatively small increases in plasma Na+.
Conclusions: This analysis provides further evidence for the role of non-osmotic Na+ storage in Na+ homeostasis and in response to drugs that alter eFWC.
Reference
Kim, S.R., et al., Cardiovasc Drugs Ther, 2011. 25 Suppl 1: p. S5–17.
T-075
A quantitative systems pharmacological study for risk assessment of astemizole-induced proarrhythmia
Mikiko Nakamura1,2, Tsuyoshi Minematsu1,3, Yoshimi Katayama1,4,5, Hiroshi Matsukawa1,4, Ryuta Saito1,6
1iSmart, Japanese Safety Pharmacology Society; 2Clinical Pharmacology Dept., Chugai Pharmaceutical Co., Ltd.; 3Analysis & Pharmacokinetics Research Labs., Drug Discovery Research, Astellas Pharma Inc.; 4Higashimatsuyama Labs., Drug Safety Testing Center Co., Ltd.; 5Pharmaceutical Research Dept., Biological Research Labs., Nissan Chemical Industries, Ltd.; 6Discovery Technology Labs., Sohyaku. Innovative Research Division, Mitsubishi Tanabe Pharma Co.
Objectives: Astemizole (AST) has been withdrawn from market since 1999 due to the potential to cause arrhythmia. For a quantitative estimation of proarrhythmic risk of AST, we developed a quantitative systems pharmacology (QSP) model of AST that is integrated with a physiologically based pharmacokinetic (PBPK) model and a biophysical model of human ventricular cardiomyocytes.
Methods: A PBPK model of AST including the active metabolite desmethyl-astemizole (Des-AST) was developed in Gastroplus™ and simulated unbound drug concentrations in plasma and heart for AST and Des-AST. Cardiac action potentials were simulated by a biophysical mathematical model of human ventricular cardiomyocytes developed by O’Hara and Rudy (ORd) or a dynamic-IKr ORd model reported by Li et al. Inhibitory effects on IKr were investigated by a whole-cell patch-clamp technique. Comprehensive effects of AST and Des-AST on the cardiac action potentials were implemented in the models as static and dynamic blockade models, respectively.
Results: Estimated unbound concentrations of AST in plasma and heart were quite low compared with its IC50 for IKr and did not show APD90 prolongation on ORd model. However, by including Des-AST which also inhibits IKr, our integrated model with the dynamic-IKr ORd model and the dynamic blockade model on IKr could predict APD90 prolongation at clinical dosage of AST.
Conclusions: Our results suggested that the proarrhythmic effect of AST, which is assessed as APD90 prolongation, was mostly explained by enhancement of IKr inhibition and accumulation in heart of Des-AST. The dedicated PBPK-QSP model including metabolites would provide better quantitative predictions by using appropriate inhibition models. The results in this abstract have been previously presented in part at 9th Japanese Safety Pharmacology Society annual meeting, Tokyo Japan held on Feb. 9th, 2018 and published in the conference proceedings as abstract 31.
T-076
PK/PD modeling of hydroxyurea treatment effects on fetal hemoglobin levels in young African children with sickle cell anemia
Min Dong1,3, Anu Marahatta2, Robert O. Opoka4, Patrick T. McGann2,3,5, Chandy C. John6, Russell E. Ware2,3,5, Alexander A. Vinks1,3
1Division of Clinical Pharmacology, Cincinnati Children’s Hospital Medical Center, Cincinnati, Ohio, USA; 2Division of Hematology, Cincinnati Children’s Hospital Medical Center, Cincinnati, Ohio, USA; 3Department of Pediatrics, University of Cincinnati College of Medicine, Cincinnati, Ohio, USA. 4Department of Paediatrics and Child Health, Makerere University, Kampala Uganda; 5Global Health Center, Cincinnati Children’s Hospital Medical Center, Cincinnati, Ohio, USA; 6Ryan White Center for Infectious Diseases and Global Health, Department of Pediatrics, University of Indiana, Indianapolis IN.
Objectives: Fetal hemoglobin (HbF) is the major modulator of clinical and hematologic features of sickle cell anemia (SCA). Pharmacotherapy with HbF inducers such as hydroxyurea is associated with great clinical benefits in patients with SCA. However, the dynamic changes of %HbF in response to hydroxyurea treatment in young patients have not been quantitatively characterized. This study analyzed hydroxyurea exposure in relation to its effect with the goal to develop an integrated pharmacokinetic-pharmacodynamic (PK/PD) model for the prediction of %HbF outcomes in very young pediatric patients with SCA in Uganda treated with hydroxyurea.
Methods: Data from a prospective, randomized, placebo-controlled phase III trial (NOHARM Study; NCT01976416) in children were utilized for PK/PD analysis using non-linear mixed effect modeling (NONMEM). The age-related natural decline of %HbF prior to hydroxyurea treatment was described by an exponential decay model. For the PK-PD modeling, Bayesian estimation of hydroxyurea exposure (AUC) was used as individual PK input. Several PK/PD models including the turnover and the Emax models were investigated. The final models were evaluated by goodness-of-fit plots and internal model evaluation.
Results: The normal physiological decline of %HbF was associated with baseline %HbF and patient age. The treatment effect over time was appropriately described by the Emax model with an exponential function to take into account HbF turnover. Taking into consideration both physiological decline and treatment effect, individual %HbF was well predicted by adding these two factors.
Conclusions: This modeling approach represents a first effort to quantitatively describe the time course of long-term dynamic changes in %HbF in response to hydroxyurea treatment. The developed PK/PD model in combination with a limited PK sampling strategy1, holds great promise to provide early prediction of %HbF response and to guide individual dose optimization for hydroxyurea treatment in young children.
Reference
-
1.
Dong et al. Br J Clin Pharmacol. 81(4):742–52.
T-077
Exposure–Response of Erenumab (AMG 334) in Episodic Migraine Patients
Thuy Vu1,2, Mita Kuchimanchi1, Liviawati Wu3, John D. Clements1, Joseph Kahn4, Daniel Mikol1, and Edward Lee1
1Amgen Inc., Thousand Oaks, CA; 2Daiichi Sankyo Inc., Basking Ridge, NJ; 3Alios Biopharma, South San Francisco, CA; 4Novartis Pharmaceuticals Corp., East Hanover, NJ, USA
Objectives: To quantitatively characterize the relationship between daily serum erenumab concentration and daily migraine occurrence.
Methods: Included in the analysis were erenumab concentrations and daily migraine data from one phase 2 and two phase 3 studies in episodic migraine patients, in which collectively 1926 subjects received either placebo or erenumab (doses of 7 mg, 21 mg, 70 mg, 140 mg), administered by subcutaneous injection every 4 weeks (Q4W). Individual posthoc PK parameters were obtained from a previously described population PK model [1] but updated with data from migraine patients. A mixed effects logistic regression model was used to estimate daily migraine probability during a 4-week baseline period and 12–24 weeks of double-blind treatment. The response variable was whether or not an individual subject had a migraine day. A random effect was included to estimate a patient’s probability of having a migraine day.
Results: Mixed-effects logistic regression analysis suggested a direct erenumab concentration effect on daily migraine probability. A sigmoidal Emax function described the relationship between daily serum erenumab concentration and migraine day probability (p < 0.001) with an EC50 of 5.15 μg/mL. Incorporating a Markov element for prior migraine day improved the model fit significantly. Age, disease duration, region, sex, body weight, and injection site were not significant covariates (p > 0.001). Prior failed prophylactic medication use status (non-failed vs. failed) had a significant interaction with baseline and maximum placebo effect.
Conclusions: Erenumab exposure was a significant predictor of efficacy in patients with episodic migraine. There was no evidence of delay between systemic exposure and migraine day response. With a far greater proportion of treatment days above EC50, a 140 mg dose is more likely to maintain maximum migraine efficacy during the dosing interval than 70 mg.
Reference
-
1.
Vu T, Ma P, Chen JS, et al. Pharm Res. 2017; 34: 1784–95.
T-078
Multiscale physiology-based modeling of mineral bone disorder in patients with chronic kidney disease and secondary hyperparathyroidism on hemodialysis: application to etelcalcetide treatment effects on calcium homeostasis
Matthew M Riggs1, Kyle T Baron1 and Murad Melhem2
1Metrum Research Group, LLC, Tarriffville, CT, USA; 2Amgen Inc, Thousand Oaks, CA, USA
Objectives: To evaluate contributions of physiologic disease (Chronic Kidney Disease, CKD) progression and feedback mechanisms, as well as the pharmacokinetics (PK) and pharmacologic effects of the calcimimetic etelcalcetide on the time- courses of changes in calcium (Ca) and parathyroid hormone (PTH).
Methods: Clinical data from 5 studies (2 Phase 1, 1 Phase 2, 2 Phase 3) provided single and repeated intravenous dosing information on etelcalcetide PK and responses to placebo and individually titrated etelcalcetide in patients with CKD and secondary hyperparathyroidism on hemodialysis. Individual exposure estimates were obtained from a 3-compartmental population PK model. An expanded multi-scale systems pharmacology model 1 was first calibrated to describe Ca and PTH balance in CKD patients, using the R package mrgsolve. Drug effects were then considered as effects on calcium sensing receptors (CaSR) in parathyroid gland (PT) and bone. Parameters were estimated using newuoa in the minqa R packages. Goodness-of-fit diagnostics guided model development. One Phase 3 study was withheld for external evaluation.
Results: Model calibrations included removal of exchangeable intracellular phosphate, suspension of calcitriol effect on renal calcium excretion and its adjustment as a function of kidney filtration), adjustment in PT Ca-sensitivity with CKD progression, and reversibility of PTH secretion capacity with treatment. Drug effects included maximal inhibition of PT sensing (89%) and relative osteoclast function (39%). The model described PTH and Ca changes following single and repeated dosing. Notably, the model captured the time-courses and magnitudes of the near 10% and 60% maximal mean decreases in calcium and PTH, respectively, from both Phase 3 studies.
Conclusions: Long-term changes in Ca and PTH were predicted with a modified systems pharmacology model after adjusting for CKD. This provided estimates of expected contributions of physiologic disease progression, feedback mechanisms and pharmacologic effects of etelcalcetide on Ca homeostasis.
Reference
-
1.
Peterson and Riggs, Bone, 2010.
T-079
Bridging/extrapolation between adult and pediatric subjects with CKD and SHPT receiving dialysis: a population PK and PK/PD analysis of Cinacalcet
Ping Chen1, Winnie Sohn1, Adimoolam Narayanan1, Per Olsson Gisleskog2, Murad Melhem1
1Amgen Inc. 2SGS Exprimo NV
Objectives: Cinacalcet is a calcium-sensing receptor (CaSR) activator for the treatment of secondary hyperparathyroidism (sHPT) recently in development for pediatric use. The objective was to perform population pharmacokinetic-pharmacodynamic (PK/PD) analyses to link cinacalcet exposure to markers of efficacy (PTH) and safety (Ca) in order to bridge exposure–response in adults and pediatric sHPT patients.
Methods: Cinacalcet, intact parathyroid hormone (iPTH) and corrected calcium (cCa) concentration–time data from 4 paediatric and 4 adult clinical studies following 100–200 mg oral doses of cinacalcet (1 to 200 mg) were pooled for modeling. Population PK/PD analyses were performed using NONMEM 7.2. A semi-mechanistic model, implementing allosteric activation, was used to describe the relationship between cinacalcet, iPTH and cCa (Figure 1). Impact of relevant covariates was evaluated by stepwise forward/backward selection. Model evaluation was based on goodness-of-fit plots and prediction-corrected visual predictive checks (pcVPC). Model-based trial simulations were performed to compare predicted iPTH and cCa based on approved and proposed titration schema in adults and paediatric subjects, respectively. The predicted proportions of subjects with hypocalcemia or achieving the primary end point (at least 30% reduction in PTH from baseline) were also reported.
Results: The exposure–response profiles for cinacalcet, iPTH and cCa were well described by the model. Estimated PK parameters were in agreement with findings in adults scaled by body weight. No additional predictors of PK/PD variability were identified. The predictive ability of the model was confirmed by pcVPC plots. Simulations suggested that the proposed titration schema in pediatric subjects resulted in comparable reductions in iPTH and cCa to adults.
Conclusions: There were no clinically relevant differences in cinacalcet PK and PD attributes between adult and pediatric patients. Model-based simulations demonstrated that the 0.2 mg/kg starting dose of cinacalcet in pediatric would provide the desired PD response (PTH suppression < 30%), while minimizing safety concerns (i.e., hypocalcemia).
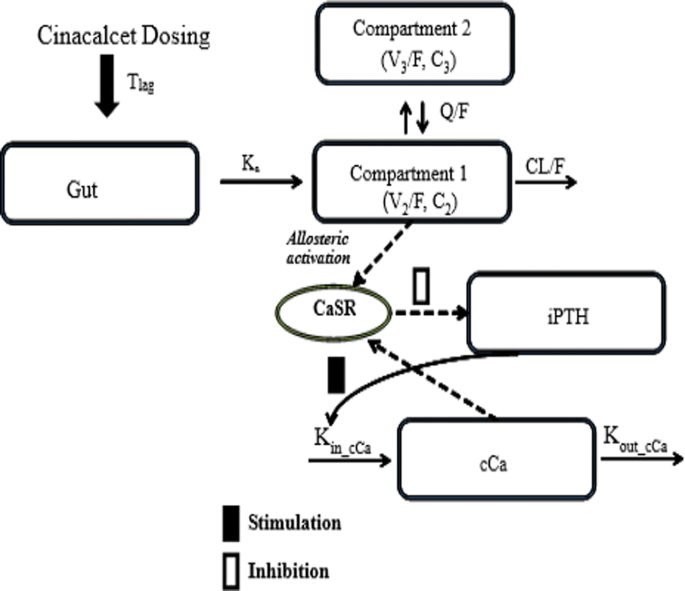
Fig. 1 Semi-mechanistic PK/PD Model Structure. K in,cCa and K out,cCa: the zero order production rate of Ca and the first order elimination rate for Ca, respectively. C 2: the cinacalcet plasma concentration. V 2 and V 3: central compartment, and peripheral compartments, respectively
T-080
Application of Physiologically-Based Oral Absorption & Pharmacokinetic Modeling to Investigate Formulation Factors Influencing the Pharmacokinetics of Novel Oral Anticoagulants
Nashid Farhan1, Sumit Basu1, Sarah Kim 1, Karthik Lingineni1, Valvanera Vozmediano1, Sihem Ait-Oudhia1, Lanyan Fang2, Liang Zhao2, Lawrence Lesko1, Stephan Schmidt1
1Center for Pharmacometrics and Systems Pharmacology, College of Pharmacy, University of Florida, Orlando, FL; 2Office of Research and Standards, Office of Generic Drugs, Center for Drug Evaluation and Research, Food and Drug Administration, Silver Spring, MD
Objectives: The objective of this study was to determine the impact of changes in formulation-specific properties of three prototypical Novel Oral Anticoagulants (NOACs) (rivaroxaban, apixaban, edoxaban) on their absorption and pharmacokinetics (PK) using a physiologically-based absorption and pharmacokinetic (PBAPK) modeling and simulation strategy.
Methods: PBAPK models for above NOACs were developed in GastroPlus™ and externally qualified using clinical observations from literature after different doses. Parameter sensitivity analyses (PSA) were conducted on the final models to predict the effect of changes in particle radius (0.1–10 fold), particle radius standard deviation (up to 10-fold), particle shape factor (0.5–2), and particle density (from 0.1 to 10-fold) on the area under the curve (AUC0-∞) and maximal concentration (Cmax) of the respective NOACs.
Results: For all PBAPK models, the predicted vs. observed AUC0-∞ and Cmax ratios were contained within a 90% confidence interval (0.8–1.25): 0.8–1.24 and 0.8–1.18 for apixaban; 0.85–0.93 and 0.9–1.18 for rivaroxaban; and 0.87–0.96 and 0.95–1.18 for edoxaban, respectively. The results of the PSA, summarized in Table 1, indicate that Cmax and AUC0-∞ for both rivaroxaban and apixaban are sensitive to particle radius and density, whereas none of the studied parameters are significantly influential for edoxaban.
Conclusions: Using PBAPK models, we have identified, among tested formulation factors, particle size and density as the most relevant formulation properties for apixaban and rivaroxaban, suggesting that these parameters should be carefully considered and may need to be controlled.

T-081
Clinical Trial Dose Optimization of Buprenorphine for Neonatal Abstinence Syndrome Using an Adaptive Monte Carlo Simulation
Nicole R. Zane1, PharmD, PhD, Walter K. Kraft2, MD, Athena F. Zuppa1,3, MD MSCE, Marc R. Gastonguay4, PhD,
1Center for Clinical Pharmacology, Children’s Hospital of Philadelphia, Philadelphia, PA; 2Department of Pharmacology and Experimental Therapeutics, Thomas Jefferson University, Philadelphia, PA; 3Department of Anesthesiology and Critical Care Medicine, Children’s Hospital of Philadelphia, Philadelphia, PA; 4Metrum Research Group, Tariffville, CT.
Objectives: In the past two decades, the incidence of the neonatal abstinence syndrome (NAS) in the United States nearly tripled.1 The aim of this research was to optimize buprenorphine dosing via simulation based on a published population PK/PD model.2
Methods: An adaptive dosing Monte Carlo simulation was designed to explore expected trajectories of response, titration, stabilization, and weaning, given different starting buprenorphine doses. Residual variability was called randomly from a normal distribution. Based upon predefined rules of titration and weaning, the simulation produced a buprenorphine concentration that determined the Finnegan score (PD endpoint). The Finnegan score then determined if the neonate would titrate, wean, or stay at the same dose for the next row. Time to stabilization (TTS) and time to weaning (TTW) were calculated for 7 simulated doses and compared to clinical data.3
Results: For a 5.3 mcg/kg q8 dose, simulated TTS was within 20 h of observed, demonstrating it adequately replicated observed results. When simulated dose was increased to 8 mcg/kg, there was a reduction in TTS to 16.5 h. However, doses greater than 8 mcg/kg showed negligible reduction in TTS. For TTW, a reduction of 11 h was shown when simulated dose was increased from 5.3 to 8 mcg/kg. There was an additional reduction of 40 h when the weaning rate per downtitration step was increased from 10% to 15%.
Conclusions: The adaptive model simulation design was able to titrate and wean a hypothetical buprenorphine dose by integrating key clinical decision thresholds into the model. This adaptive design can be used to investigate hypothetical doses and titration/weaning schedules to improve efficacy and reduce time in the hospital.
References
-
1.
Tolia VN, et al. N Engl J Med 2015;372.
-
2.
Moore JN, et al. Clin Pharmacol Ther 2018.
-
3.
Kraft WK, et al. N Engl J Med 2017;376.
T-082
Torsten: Stan functions for pharmacometric (PMX) applications. Validation and new functions
William R. Gillespie and Yi Zhang
Metrum Research Group, Tariffville, CT
Objectives: Stan is a general purpose Bayesian modeling package. It provides a general model specification language and uses HMC simulation for fully Bayesian data analysis. We developed Torsten, a library of Stan functions that provides functionality similar to NONMEM®’s PREDPP library. Those functions simplify implementation of PK and PKPD models in Stan. Since we debuted a prototype at ACoP7, we improved and extensively tested Torsten and added new functions.
Methods: Torsten is open source software (https://github.com/metrumresearchgroup/Torsten). Its functions are written in C ++ and they comply with Stan development requirements. They may be accessed by all Stan interfaces such as RStan and CmdStan. All behavior was thoroughly tested with unit tests for the local functionality and PKPD model-based integration tests to guard against breaking things end-to-end with local changes. Integration tests assured result-consistency between Torsten and mrgsolve (https://github.com/metrumresearchgroup/mrgsolve). Via that process we validated Torsten version 0.84. New functionality includes:
-
Steady-state calculations.
-
Mixed different PMX ODE models and solution methods, e.g. coupled linear PK and nonlinear PD models, solved by analytical and numerical solvers, respectively.
-
Univariate integral.
-
Piecewise linear interpolation.
Results: Torsten validation consisted of successful execution of 57 unit tests, tests of all possible function signatures, and integration tests that compared the results to mrgsolve. We demonstrate the univariate integral and piecewise linear interpolation functions by analyzing time to dropout in a simulated dose-finding trial for an antipsychotic (4 treatment arms, 100 patients/arm). The dropout hazard is modeled as a function of the observed PANSS score: h(t) = h 0 exp exp (β·PANSS (t)) where PANSS(t) is a piecewise linear interpolation of the observed weekly scores.
Conclusions: The Torsten library was successfully validated by extensive testing. Stan + Torsten is a highly flexible open source platform for Bayesian PMX data analysis.
T-083
Optimizing Dose Selection in the Face of Model Uncertainty with Proc MCPMod
Cecilia Fosser1, Jaydeep Bhattacharyya1, Paridhi Jain2, Hrishikesh Kulkarni1
1Cytel, Inc., Cambridge, MA, USA; 2Cytel, Inc., Pune, India
Objectives: Developed by Bretz, et.al and endorsed by EMA, MCPMod combines multiple comparisons prodedures with modeling to address both proof-of concept and dose finding within a single study. Cytel’s Proc MCPMod implements this statistical method, previously only available in the R DoseFinding package, within SAS to leverage its powerful data management and reporting capabilities. Here we explore how this SAS procedure performs compared to R’s MCPMod function. There are two conceptual decisions that are done in Phase II dose-finding trials: Proof-of-Concept (PoC) and selection of the target dose. This analysis was intended to demonstrate how these two decision points are supported by Proc MCPMod, and to compare the results with those from R’s MCPMod function.
Methods: Proc MCPMod starts with several candidate models, and model and dose selection criteria, to estimate the target dose for the next phase. Proc MCPMod was applied to Phase II dose-ranging categorical data with three candidate models (linear in log-dose, emax and logistic), and results were compared with the results from running the same analysis using R’s MCPMod function.
Results: Proc MCPMod performed the analysis seamlessly within SAS without the overheads of data porting, reviewing and retrieving. Comparison to R’s MCPMod function found nearly identical results, except for the parameter estimates of the logistic function. The source of the discrepancies was explored and well understood as driven by the endpoint and use of the logistic model. Despite these discrepancies, the predicted responses from either software platform provide nearly identical values.
Conclusions: Cytel’s Proc MCPMod enables the use of the MCP-Mod approach from within the SAS environment. The MCP-Mod approach is, thus, made more accessible as a model-informed approach to drug development.
References
Bretz F, Pinheiro JC, Branson M. (2005) Combining multiple comparisons and modeling techniques in dose–response studies, Biometrics. 2005;61(3):738–48; EMA reflection paper: http://www.ema.europa.eu/docs/en_GB/document_library/Regulatory_and_procedural_guideline/2014/02/WC500161027.pdf.
T-084
An Integrated R-Based Framework for Model Development in Health Economics
Daniel Kaschek (1), Henning Schmidt (1), Anna Georgieva Kondic (2)
(1) IntiQuan, Basel, Switzerland, (2) Economic and Data Sciences, MSD, Rahway, NJ, USA
Objectives: Health economic decisions rely on the evaluation of complex systems. Modeling is a powerful tool to deal with this complexity and support decision making. To date, several software tools have been used to generate such models. However, models cannot be easily exchanged and exported into a readable, self-explanatory representation. Thus, proving the validity of a model to decision-makers constitutes a major difficulty. We set out to develop a software framework to overcome these short-comings.
Methods: The Discretely Integrated Conditions and Events (DICE) approach is a recently developed formalism to set up health-economic models. Models consist of “conditions”, describing all relevant aspects of a patient’s state, and “events”, causing sudden changes of conditions and triggering consequent events. As a special case, the DICE concept covers Markov models which are widely used in health economics. It is therefore especially suited for building the core of a general modeling framework that allowed to set up, simulate and analyze different health-economic models.
Results: We implemented the framework with an R-based Health Economic Modeling (RHEM) language at its heart by which both, DICE and Markov models can be represented. The simulation engine is capable of interpreting RHEM Language using the DICE algorithm to simulate both DICE and Markov models. To connect to already existing platforms, we have developed a standardized JSON-based exchange format to exchange models and results.
Conclusion: Health-economic modeling has a major impact on the estimated value of a drug. By the conception of the new RHEM modeling language and standardized exchange format, the readability and intuitive understanding of complex models is maximized and trust in the validity of the model is generated.
References
-
1.
Caro JJ, Möller J, Getsios D. Discrete event simulation: the preferred technique for health economic evaluations?
-
2.
Beck JR, Pauker SG. The Markov process in medical prognosis.
T-085
A workflow to detect non-identifiability in parameter estimation using SimBiology
Florian Augustin, Sietse Braakman, Ricardo Paxson
The MathWorks, Natick, MA, USA
Objectives: Estimating parameters is an essential step in creating a model that predicts clinical data. However, parameter estimation is often inherently difficult, e.g. due to limited data, or models being insensitive to changes in certain parameters. Here, we present strategies to investigate and mitigate parameter non-identifiability of a mechanistic nanoparticle PBPK model1.
Methods: The mechanistic nanoparticle PBPK model from [1] is presented to describe PK data for several organs. SimBiology’s parameter estimation functionality, supported by local sensitivity analyses and parameter scans, is used to fit model parameters to data. Confidence intervals are used to assess the quality of the fit.
Results: Without prior knowledge, fitting model parameters to data resulted in non-physiological parameter values and large confidence intervals for estimated parameters. To improve the fit, a sensitivity and model response analysis of parameters, including clearance (CL), nanoparticle release rate (Krel) and partition coefficients (Kp), was conducted. High response rates were found with respect to CL, Krel and Kp,liver. Subsequently, only CL, Krel and Kp,liver were estimated using a global optimization algorithm, fixing the remaining parameters to values calculated from NCA parameters2 or literature. This resulted in satisfactory confidence intervals. A parameter scan around the newly estimated parameters confirmed that restricting the fitted parameters to CL, Krel and Kp,liver did not cause loss of information in the fit.
Conclusions: Using SimBiology’s tools for performing sensitivity analyses, parameter scans, parameter estimations as well as computing confidence intervals helped to detect and overcome problems with non-identifiability in parameter estimations. The presented workflow guides modeling choices to ensure an accurate description of the data and to overcome parameter aliasing.
References
-
1.
Dong D., Wang X., Wang H., Zhang X., Wang X., Wu B., International Journal of Nanomedicine (2015) 10:2521–2535.
-
2.
Gallo. J.M., Lam F.C., Perrier D.G. Journal of Pharmacokinetics and Biopharmaceutics (1987) 15:271–280.
T-086
reSET Digital Therapeutic for SUD Demonstrates Dose-Dependent Improvement in Outcomes
Hilary F. Luderer, PhD1, Kathleen Coolidge1, Aimee N. C. Campbell, PhD2, Edward V. Nunes, MD2,3, Yuri A. Maricich, MD1
1Pear Therapeutics, Boston, MA, USA; 2Department of Psychiatry, Columbia University Medical Center, New York, NY; 3New York State Psychiatric Institute, New York, NY
Objectives: Substance use disorder (SUD) is a chronic, relapsing disease impacting > 20 million in the US. Patient engagement with treatment improves outcomes. reSET® (academic name Therapeutic Education System), the first FDA-cleared prescription digital therapeutic for SUD, delivers clinically-validated, addiction-specific behavioral therapy.1−4 This study explored the relationship between reSET dose and outcomes.
Methods: Participants (n = 206) randomized to receive 12 weeks reSET were asked to complete 4 modules/week. The relationship between dose (defined as engagement/module completion) and abstinence (% of all urine drug screens negative) or appointment attendance (% of study visits attended) was analyzed using linear regression. Logistic regression was used to evaluate whether dose in the first 6 weeks of treatment predicted treatment retention.
Results: Dose correlated with abstinence (R2 = 0.21, p < .001). Participants completing 50–62 modules had the highest abstinence rates (84%, p = .005). A strong correlation between dose and appointment attendance was observed (R2 = 0.63, p < .001). Individuals completing ≥ the recommended 24 modules in the first 6 weeks of treatment (n = 190) were over 3 times more likely to complete the entire 12-weeks than patients who completed < 18 modules (OR = 3.28, p = .003).
Conclusions: reSET dose correlated with improved treatment outcomes and early engagement was an indicator of treatment retention. These findings suggest that reSET may be a predictive tool enabling better clinical management of SUD patients.
References
-
1.
Bickel WK et al. Computerized behavior therapy for opioid-dependent outpatients: a randomized controlled trial. Exp Clin Psychopharmacol. 2008;16(2):132–143.
-
2.
Christensen DR et al. Adding an Internet-delivered treatment to an efficacious treatment package for opioid dependence. J Consult Clin Psychol. 2014;82(6):964–972.
-
3.
Campbell ANC et al. Internet-delivered treatment for substance abuse: a multisite randomized controlled trial. Am J Psychiatry. 2014;171(6):683–690.
-
4.
Marsch LA et al. Web-based behavioral treatment for substance use disorders as a partial replacement of standard methadone maintenance treatment. J Subst Abuse Treat. 2014;46(1):43–51.
T-087
A method for detecting trends in bias from model predictions.
Sahmin M Saffian1, Daniel F.B. Wright2, Stephen B. Duffull2
1Faculty of Pharmacy, The National University of Malaysia, Kuala Lumpur, Malaysia. 2School of Pharmacy, University of Otago, Dunedin, New Zealand.
Objective: The predictive performance of a model is often assessed using mean prediction error (MPE) [1]. MPE may be insensitive to bias patterns that display a systematic trend. This study presents a method for detecting systematically biased model predictions.
Methods: The method was developed as follows;
-
1.
Bin observed data (starting with n = 2 bins).
-
2.
Calculate MPE for each bin.
-
3.
Regress MPE against the bin number; MPE(k) = β 0 + β 1 × bin k; β 1 = slope, β 0 = intercept, k = bin number in the nth iteration. Let n = {2,…,N max}, let k = {1,…,n}, N max is the maximum bins.
-
4.
Increment n repeat until n = N max.
-
5.
Regress slope values (β 1) against bin number and estimate the asymptotic slope (S ∞); \( \beta_{1} = S_{\infty } + \left( {S_{0} - S_{\infty } } \right)\left( {exp^{{ - \theta \times n_{j} }} } \right); j \in \left\{ {2, \ldots , N_{max} } \right\} \), S ∞ = asymptotic slope, S 0 = initial slope, θ = rate constant, and j = bin number.
-
6.
Calculate the 95% CI of S ∞, if this includes zero then we conclude no trend in bias.
The method was evaluated using six different patterns of bias including a control (unbiased), bidirectional, off-set, non-linear, and U-shaped bias. n = 100 datasets were simulated using MATLAB (2016). Random noise was simulated assuming \( \varepsilon_{i} \sim N\left( {0, \sigma^{2} } \right) \) and σ 2 of 0.25. MPE (95% CI) and S ∞ (95% CI) were determined for each simulated scenario.
Results: Both MPE and the asymptotic slope method correctly specified the absence of bias in the control (unbiased) scenario. The MPE, but not the asymptotic slope method, identified off-set bias. The asymptotic slope method, but not MPE, correctly identified bias in scenarios C,D and E (bidirectional, non-linear bias at larger and smaller observations, respectively). Neither method could detect U-shaped bias (scenario F).
Conclusions: The method for numerically detecting systematic deviation in model-predictions provides an additional interpretation to the standard MPE approach.
References
-
1.
Sheiner LB, Beal SL J Pharmacokinet Biopharm. 1981; 9:503–512.
T-088
A quantitative systems pharmacology model to describe the immunopathogenesis of inflammatory bowel disease and guide drug development decisions
Vidya Ramakrishnan1, Pinyi Lu2, Jacqueline McBride1, Franklin Fuh1, Annemarie Lekkerkerker1, Meina Tang1, Andrew Leber2, Raquel Hontecillas2, Angelica Quartino1, Jin Yan Jin1, Josep Bassaganya-Riera2, Saroja Ramanujan1, Kapil Gadkar1
1Genentech, Inc., South San Francisco, CA, USA; 2Biotherapeutics Inc., Blacksburg, VA, USA
Objectives: Inflammatory bowel disease (IBD) encompasses an umbrella of disorders commonly associated with chronic inflammatory condition of the gastrointestinal tract. To facilitate a quantitative understanding of the diverse innate and adaptive immune responses leading to IBD pathogenesis, a quantitative systems pharmacology (QSP) model was developed. The model serves as a platform disease model enabling evaluation of anti-inflammatory, immunosuppressive, and cytokine targeting therapeutic agents.
Methods: The QSP model was developed to include mechanisms related to: epithelial disruption, microbial translocation and antigen presentation, acute intestinal inflammation due to activation of dendritic cells and macrophages (innate immunity), and eventual chronic inflammation via recruitment of effector and regulatory T cells (adaptive immunity) leading to increased expression of pro-inflammatory cytokines. The model includes six compartments representing the intestinal lumen, epithelium, lamina propria, mesenteric lymph node, vascular endothelium, and blood. SimBiology, a MATLAB® based application was used for the implementation of the model and the dynamics of all the species in the model were described by ordinary differential equations. State transitions, transport, and production reactions of the model species were broadly described via mass-action kinetic approximations such as, Michaelis–Menten and Hill kinetics.
Results: The model adequately represents mechanisms associated with: microbiota (commensal and disease associated bacteria), relevant innate and adaptive immune cells (dendritic cells, macrophages, neutrophils, Th1, Th17, and regulatory T cells), pro-inflammatory cytokines (TNF, IFN, IL-8, IL-12, IL-1, IL-6, IL-17), and anti-inflammatory cytokines (IL-10, TGF). The effects of cytokines were linked to the clinical efficacy end-points measured in Crohn’s disease and ulcerative colitis clinical studies.
Conclusions: A QSP model illustrating the critical immune mediated mechanisms in IBD was developed. The in silico model predictions hold potential utility in several critical drug development decisions including: target selection and validation, clinical trial readout expectations and biomarker interpretation, and evaluation of responses in diverse patient phenotypes.
T-089
Quantification of lung function and risk of COPD exacerbation association to predict long-term effects for new treatment arms using a drug-differentiated joint model
Kirill Zhudenkov1, Dina Chernikova1, Ulf Eriksson2, Robert Palmér2, Alexandra Jauhiainen3, Kirill Peskov1, Gabriel Helmlinger2, Ulrika Wählby Hamrén2
1M&S Decisions, Russia 2Quantitative Clinical Pharmacology, Early Clinical Development, IMED Biotech Unit, AstraZeneca R&D, Sweden/USA 3Early Clinical Biometrics, Early Clinical Development, IMED Biotech Unit, AstraZeneca R&D, Sweden
Objectives: To investigate the use of short-term FEV1 dynamics for the prediction of treatment effects on COPD exacerbations, using joint modeling and extend a previously developed joint model [1] for prediction of new treatment arms.
Methods: Longitudinal FEV1 data and time-to-first exacerbation from a 12-month COPD trial [2], including patients randomized to twice-daily dosing of budesonide/formoterol, formoterol or placebo, were jointly modeled using the JM package and STAN [3,5]. Formoterol was assumed to affect FEV1 dynamics, and budesonide to affect the risk of exacerbation. Additional effects of formoterol and budesonide on exacerbations and FEV1 dynamics, as well as covariate effects were considered in the model structure. The model was used to predict the outcome of a 6-month trial [4], including two additional treatment arms (budesonide, and its combination with formoterol) using a 1-month cut-off for FEV1 data.
Results: A 100-ml increase in FEV1 decreased the risk of exacerbation by 8%. A dose-dependent effect of budesonide was estimated; for every 2x80 μg of budesonide, the risk of exacerbation decreased by 15%. Other significant factors found to affect exacerbation risk were: baseline breathlessness score, history of exacerbations, and country. STAN parameter estimates were similar to those derived in JM. The model adequately predicted the outcome of the 6-month trial with additional treatment arms, using a 1-month cut-off for FEV1 data.
Conclusions: The use of a joint model and short-term individual FEV1 dynamics allows for outcome prediction of a 6-month study, suggesting the usefulness of a joint modeling platform in clinical trials.

References
-
1.
Zhudenkov et al. ACOP Meeting 2017.Poster T-018.
-
2.
Rennard et al. Drugs. 2009;69(5):549–65.
-
3.
Rizopoulos, CRC Press, 2012, ISBN 9781439872864.
-
4.
Tashkin et al. Drugs.2008;68(14):1975–2000.
-
5.
Stan Development Team. RStan: The R interface to Stan.
T-090
Ofatumumab Dose Selection in Pediatric Population with Relapsing Multiple Sclerosis (RMS)
Maja Skataric1, Marina Savelieva2, Etienne Pigeolet2, David Leppert2
1Novartis Pharmaceuticals Corporation, East Hanover, NJ, USA; 2Novartis Pharma AG, Basel, Switzerland.
Objectives: Ofatumumab is a high affinity anti-CD20 drug, currently tested in Phase III trials in Relapsing Multiple Sclerosis. We adapted a published PKPD model to characterize the relationship between Ofatumumab PK and B-cell count dynamics in adults with RMS. Subsequently, we used the model to select the dosing regimen in children (> 10 years).
Methods: The analysis used data from pooled s.c. and i.v. 48-week (24-week treatment, 24-week follow-up), randomized, placebo-controlled Phase IIb studies. The base PKPD model was built using a Target Mediated Drug Disposition (TMDD) component and an indirect response structure for B-cell depletion and recovery. Weight and age covariates were tested on clearance, central volume of distribution, and baseline B-cells.
Results: PK and PD data from 36 patients in the i.v, and PD data from 231 patients in s.c. study were used in the final PKPD model. Model provided good GOF results for all doses used in Phase IIb studies. Simulations for doses used in Phase III studies in adults (loading doses + monthly 20 mg maintenance) demonstrated rapid depletion of B-cells, and recovery ~ 38 weeks after treatment interruption (~ 2 times faster than in treatment with rituximab or ocrelizumab). Simulations suggested that the proposed dosing regimen in adults is also suitable for children (> 10 years). The repletion of B-cells in children after the treatment stop is predicted to be faster than in adults (~ 28 weeks average recovery time to 100 cells/uL threshold).
Conclusions: Despite higher baseline values in children, B-cells will be consistently depleted below the 8 cells/uL thresholds for the majority of patients within the first four weeks of treatment, indicating the same dosing regimen as in adults can be used.
References
Struemper H. et.al. “Population pharmacokinetics of ofatumumab in patients with chronic lymphocytic leukemia, follicular lymphoma, and rheumatoid arthritis”, J. Clin. Pharmacol. 2014; 54(7): 818–827.
T-091
Predicting the effect of post-translational modifications on PK of mAb drug products: a case study of aducanumab with different levels of high mannose glycoforms
Michael Monine1, Ivan Nestorov1, Li Zang2, Valerie Tsang3
1Clinical Pharmacology & Pharmacometrics, 2Analytical Development, Biogen, Cambridge, MA; 3Proteins Development, Biogen, Research Triangle Park, NC
Objectives: 1) develop a model to characterize PK of mAb drugs that may exhibit post-translational modifications (PTMs); 2) evaluate the effect of high mannose glycoforms on clearance and estimate an acceptable range of high mannose levels in the aducanumab product.
Background: PTMs of mAb products can be caused by manufacturing process change or lot-to-lot variability. High mannose glycoforms were found to demonstrate faster clearance possibly due to binding to mannose receptors expressed by macrophages. Analysis of plasma samples from Alzheimer’s disease (AD) patients, who received aducanumab in a Phase 1 study, has detected the initial level of high mannose species at about 3% of total aducanumab in plasma.1,2
Methods: A generic PK model has been recently developed to describe the effect of PTMs on mAb PK.1 The model has been fitted to the Phase 1 data that included concentrations of high mannose glycoforms of aducanumab quantified via LC–MS and ELISA methods.1 The model was used to simulate the impact of different high mannose levels on the total aducanumab PK. To determine the acceptance criterion based on the total aducanumab exposure, the FDA guidance on demonstration of biosimilarity to a reference product was adopted. The product used in the Phase 1 study contained ~ 3% of the high mannose glycoforms and was considered as a reference product.
Results and Conclusions: The estimated clearance rate for the high mannose glycoforms of aducanumab is 2 to 3 times higher than that for the unmodified form. Model simulations have shown that the ratio between area under the curve (AUC) of plasma concentrations for the product containing up to 10% of high mannoses (predicted) and the reference product (data) exceeds 0.9, which is considered to be acceptable.
References
-
1.
Li Y, Monine M, Huang Y, Swann P, Nestorov I, and Lyubarskaya Y. MABS 2016; 8:1079–1087.
-
2.
Ferrero J et al. Alzheimers Dement. 2016; 2:169–176.
T-092
A Thorough QT Study to Evaluate the Effect of Glasdegib on Cardiac Repolarization in Healthy Adult Subjects
Shaik, Naveed; Mendes da Costa, Laure; Hee, Brian; Liang, Yali and LaBadie, Robert
Pfizer Inc.
Objectives: Glasdegib, a selective inhibitor of Smoothened, is under development for acute myeloid leukemia/high-risk myelodysplastic syndrome. Based on QT signals in early clinical studies, a thorough QT (TQT) study was conducted in healthy subjects to estimate the effect of therapeutic and supra therapeutic (2x) doses of glasdegib, on the QTc interval after oral administration relative to time-matched placebo.
Methods: This was a randomized, double-blind, placebo and moxifloxacin controlled, 4-period, 4-sequence, 4-treatment, single-dose, 4-way crossover study in 36 subjects. Following administration in each period, triplicate ECGs and serial pharmacokinetic samples were collected. The sample size of 36 provided at least 98% power to exclude the upper bound of a 2-sided 90% confidence interval (CI) of time-matched difference between glasdegib and placebo of > 20 ms at each time point (exclude a large effect). Given that glasdegib is under development for use in cancer patients, this 20 ms criterion was considered to be the threshold for clinical concern in oncology patients.
Results: The study was adequately sensitive to assess the effect of glasdegib on QTc interval as lower bound of the 90% CIs for mean difference in QTc between moxifloxacin and placebo was > 5 ms (11.70 ms). A lack of a large effect of glasdegib on the QTc interval was demonstrated at the therapeutic and supratherapeutic doses. The upper bound of the 2-sided 90% CIs for all time-matched least square mean differences between glasdegib and placebo was below 20 ms (90% CI upper bound was 15.6 ms at supratherapeutic dose). None of the subjects met categorical criterion of absolute QTcF interval of ≥ 480 ms or increase from baseline in QTcF interval ≥ 30 ms.
Conclusions: A lack of a large effect of glasdegib on the QTc interval was demonstrated at the therapeutic and supratherapeutic doses. Single oral doses of glasdegib were well-tolerated.
T-093
Population pharmacokinetic analysis of the β-lactamase inhibitor nacubactam in healthy volunteers and volunteers with impaired renal function
Patanjali Ravva1, Steve Dang1, Darren Bentley2
1Roche Innovation Center New York and 2 Roche Innovation Center Basel, Roche Pharma Research and Early Development, F. Hoffmann-La Roche Ltd, Basel, Switzerland
Background: Nacubactam (OP0595, RG6080) is a novel β-lactamase inhibitor with activity encompassing β-lactamases in Ambler Classes A, C and D, but also possessing direct antibacterial activity through inhibition of PBP2. Here we report the population model describing the pharmacokinetics (PK) of nacubactam in healthy volunteers and with impaired renal function and model-based simulations to guide the dose selection.
Materials/methods: Nacubactam concentration data from 3 clinical trials with a total of 86 individuals representing 1407 plasma samples and 120 urine samples contributed to the analysis. Model parameters and covariate effects were estimated using nonlinear mixed effects modelling methods. Simulations were performed to predict PTAs based on preliminary exposure targets from nonclinical experiments.
Results: A 3-compartment linear model with direct elimination to a urine compartment described the PK of nacubactam in both plasma and urine. The final population parameters for a typical individual were CL, 8.36 L/h; V1, 11.0 L; V2, 0.625 L; V3, 5.64 L; Q2, 0.0558 L/h; Q3, 6.24 L/h. Renal function (estimated CLcr) and bodyweight were significant covariates on clearance, and volume and inter-compartment clearance parameters, respectively. After accounting for renal function and weight, there was no apparent effect of age or sex. Simulations demonstrated that doses of ≥ 1 g t.i.d of nacubactam administered over 1.5 h infusion will provide greater than 90% PTA. Simulations were also used to predict the impact of dosing adjustments in patients with impaired renal function and patients with augmented renal clearance to maintain high PTAs.
Conclusion: The population pharmacokinetic model adequately described the nacubactam concentration data and model-based simulations allowed identification of a therapeutically relevant nacubactam dose range for testing in patient studies, as well as dosing algorithms to account for altered renal function.
T-094
Tedizolid Phosphate Dose Selection for Pediatric Patients from 28 Days to Less Than 12 Years of Age Based on Simulations Using a Population Pharmacokinetic Model for the Active Moiety Tedizolid
Philip E. Sabato1, Hwa-Ping (Ed) Feng1, Vincent Duval2, Rik De Greef2, Pamela Sears1, Carisa De Anda1, Robert Valesky1, Matthew L. Rizk1
1Merck & Co., Inc., Kenilworth, NJ, USA; 2.Certara, L.P., Princeton, NJ, USA
Objectives: The objective of this analysis is to project a safe and efficacious dose of intravenous (IV) and oral tedizolid phosphate, a pro-drug of a novel oxazolidinone antibiotic tedizolid, for increasingly younger children, and select a dose for a Phase 3 trial in pediatric patients (6 to < 12 years) with acute bacterial skin and skin structure infection (ABSSSI), using population pharmacokinetic (PK) modeling.
Methods: An interim population PK model to characterize tedizolid PK was developed using NONMEM (ver. 7.2) with data from ~ 1160 adults and ~ 41 pediatric subjects. The model was used to predict PK exposure and the probability of achieving PK/pharmacodynamic (PD) targets at various doses in pediatric patients, using published pediatric demographic data based on age. The PK/PD target correlated with antibacterial efficacy for oxazolidinones, including tedizolid, is the ratio of free AUC over minimal inhibitory concentration of the pathogen (fAUC/MIC).
Results: A two-compartment model with linear elimination best described the PK of tedizolid. Oral absorption was characterized by zero-order duration with a lag-time in the depot compartment followed by first-order absorption from the depot to the central compartment. Weight was implemented a priori on all disposition parameters except inter-compartmental clearance. The effects of infection and diabetes on central volume of distribution were found to be significant. Infection also had a significant effect on clearance. Based on simulations in pediatric patients, doses ranging from 4 mg/kg to 6 mg/kg administered via a 1-hour IV infusion or orally, provided exposures comparable to adult exposures at the approved 200 mg clinical dose and a ≥ 90% probability of achieving the PK/PD target (fAUC/MIC > 3).
Conclusions: The population PK model adequately described tedizolid PK for pediatric patients and supports the evaluation of weight-based doses administered either as IV infusion or orally to pediatric patients from ages 28 days to < 12 years.
T-095
A modular approach to quantitative systems pharmacology (QSP) model development for immuno-oncology (IO) therapeutic area
Roy Song1, Loveleena Bansal1, Marc Birtwistle2, Emile Chen1, Valeriu Damian1
1Systems Modeling and Translational Biology, GSK, PA; 2Clemson University, SC
Objective: Development of a comprehensive QSP model for IO is challenging as the size of the model can grow quickly when cell–cell interactions modulated by multiple receptor-ligands are described explicitly. Such models can also become unwieldly to parameterize or validate when new data becomes available. Although QSP tools have been presented to improve the modeling workflow [1], stepwise development using modules has not been explored fully. A modular approach has been proposed to facilitate model development workflow and future expansion.
Methods: The core QSP model is generated by combining individual modules (fig. 1a), which are sub-models that describe a) cell processes such as differentiation, activation, apoptosis, and migration and b) production of effectors such as cytokines and chemokines by cells. For reactions that require explicit description of cell–cell interaction through receptor-ligand pairs (which can be potential drug targets), the core QSP model is further expanded by integrating cell–cell interaction modules that describe regulation of cell processes through co-receptor/ligand interactions (Fig. 1b).

Results and Conclusion: A comprehensive QSP model for IO has been developed combining smaller modules that have been parameterized and validated using specific experimental data. This approach has resulted in several benefits to QSP modeling in GSK including: a) manageable model development by focusing on parameterization of individual modules rather than working with the full model, b) easier future expansion by addition of a new module or updating existing module to describe the new experimental data and c) reusability of these modules as building blocks towards creation of QSP models for other therapeutic areas.
Reference
-
1.
Cheng et al. AAPS J (2017) 19: 1002
T-096
Integrating Lifestyle Factors In A Quantitative Systems Pharmacology (Qsp) Model Of Human Metabolism To Predict Long Term Cardiovascular Disease Risk
Sai Phanindra Venkatapurapu1, Chezev Matthew1, Abhinav Aggarwal1, Gaurav Dwivedi1
1PwC, USA
Objectives: Lifestyle factors increase chronic disease risk and influence outcomes; however, they’ve largely been ignored in QSP modeling. We developed Bodylogical[1] QSP platform and reported its application in simulating diabetes treatments; here we applied the model to predict cardiovascular disease (CVD) risk. Studies[2] show lifestyle interventions significantly impact long term CVD risk; however, commonly used scoring methods ignore lifestyle factors, and two individuals with similar baseline biomarkers have similar 10-year CVD risks despite completely different diets. To supplement this inadequacy, we used Bodylogical to simulate 10-year, time-varying impact of lifestyle factors and their impact on CVD risk.
Methods: We created a virtual population with baseline characteristics similar to the Look AHEAD cohorts and exposed each cohort to a different lifestyle modification driving the cohort in the expected direction. We applied the Framingham and ASCVD risk scores to each cohort to estimate the time varying 10-year risk. Furthermore, we trained a classification model on half of the cohorts that uses the computed risk score to stochastically simulate CV events in the virtual population. Finally, we used the classifier to predict the rate of CV events in the cohorts not used for training.
Results: The model generated virtual cohorts statistically similar to the Look AHEAD cohorts at baseline and study end. The predicted rates of CV events were validated by the test data.
Conclusions: The results demonstrate Bodylogical’s ability to dynamically estimate long term CV risk under varying lifestyle conditions, which is not feasible with a conventional QSP model. Predictions from our model could be used for clinical support and patient education.
References
-
1.
Sarkar J, Dwivedi G, Chen Q, Sheu IE, Paich M, Chelini CM, et al. (2018) PLoS ONE 13(2): e0192472.
-
2.
The Look AHEAD Study Group, & Gregg, E. W. (2016). The Lancet. Diabetes & Endocrinology, 4(11), 913–921.
T-097
A systematic comparison of the influence of various renal function estimation methods on dose adjustment: insights from real-world data
Zufei Zhang, Nadia Noormohamed, Wei Gao
Merck Research Laboratories
Objective: To systematically compare the classification of renal function by creatinine clearance (CrCl) and various estimated glomerular filtration rate (eGFR) equations and to assess the interchangeability of these renal function estimates on dosage adjustment, using vancomycin as an example.
Methods: Using an internal virtual population database consisting of subjects from existing clinical trials, CrCl (CG) and eGFR (MDRD, MDRDm, CKD-EPI, CKD-EPIm) were calculated for each subject based on demographics and serum creatinine concentrations (Table 1). The degree of agreement between CrCl and eGFR estimates was assessed. To evaluate the interchangeability of CrCl with eGFR, individual vancomycin AUC0–24 was simulated using the approved dosing table and the calculated CrCL and eGFR values1 and compared with the reported therapeutic window (400–800 mg*h/L)2.
Results: The virtual population database included 17,696 subjects (18–93 years, 30–226 kg, 44.3% female, 70.1% white). Generally good agreement was observed between CrCL and eGFR estimates (48.6%-79.4%), especially in end stage renal disease subjects (~ 100%). MDRDm showed the highest concordance with CG across renal function groups. When vancomycin dosage was adjusted according to CG, 93.2% subjects remained within the therapeutic window, with 100% below the upper limit of the therapeutic window. However, when switching to other eGFR estimates, 69.6%, 87.5%, 79.1%, 56.5% of subjects were within the therapeutic window, with 29.4%, 12.4%, 20.5%, 39.5% of subjects falling below and 1.02%, 0.080%, 0.38%, 3.88% falling above the window for MDRD, MDRDm, CKD-EPI and CKD-EPIm, respectively.
Conclusions: While general agreement exists between CrCL (CG) and eGFR estimates, the simulation exercise with vancomycin illustrates that more work is needed to evaluate the interchangeability of these renal function estimating methods with regards to dose adjustment to ensure optimal treatment in patients with renal disease.
Table 1 Agreement between Cockcroft-Gault creatinine clearance and various eGFR estimation methods
CrCL (mL/min) calculated by CGa | Agreement (%) | |||
|---|---|---|---|---|
CG vs. MDRDb | CG vs. MDRDmc | CG vs. CKD-EPId | CG vs. CKD-EPIme | |
≥90 | 61.1 | 82.9 | 76.5 | 49.2 |
[60, 90) | 68.2 | 78.0 | 65.7 | 50.9 |
[30, 60) | 47.1 | 64.3 | 43.2 | 35.9 |
[15, 30) | 39.4 | 52.0 | 44.1 | 29.9 |
(0, 15) | 99.4 | 99.4 | 100 | 100 |
Overall | 61.7 | 79.4 | 69.8 | 48.6 |
References
-
1.
Glatard A, et al. Antimicrob Agents Chemother. 59 (2015):2986–94.
-
2.
Pai Manjunath, et al. Adv Drug Deliv Rev. 77 (2014):50–57
T-098
Posaconazole Pharmacokinetics and Dose–Response Relationship for Invasive Aspergillosis, Reflected by Suppression of the Galactomannan Index
Gastine, Silke1; Hope, William3; Hempel, Georg1; Groll, Andreas H.2
1Institute of Pharmaceutical and Medical Chemistry, Department of Clinical Pharmacy, Westfälische Wilhelms-Universität Münster, Münster, Germany 2Infectious Disease Research Program, Center for Bone Marrow Transplantation, and Department of Pediatric Hematology/Oncology, University Children’s Hospital Münster, Münster, Germany 3Antimicrobial Pharmacodynamics and Therapeutics, Department of Molecular and Clinical Pharmacology, Institute of Translational Medicine, University of Liverpool, United Kingdom
Objectives: Posaconazole is used in treatment and prophylaxis of invasive aspergillosis. To monitor pharmacodynamics of antifungal substances in vivo, it has been shown, that the polysaccharide galactomannan is a valid PD surrogate regarding aspergillosis. Although current guidelines suggest therapeutic drug monitoring to ensure adequate posaconazole exposure, there is some uncertainty about therapeutic targets for both prophylaxis and treatment of an established disease.
Methods: In 46 persistently neutropenic rabbits, the PKPD of posaconazole was investigated for the treatment and prophylaxis of invasive pulmonary aspergillosis due to Aspergillus fumigatus [1]. Antifungal therapy consisted of posaconazole at 2, 6, and 20 mg/kg of body weight, orally. To evaluate the pharmacodynamics, galactomannan Index (GAI) was collected every other day during the study. Nonparametric PKPD model building was performed using the Pmetrics Package in R [2]. Consequently, the final PKPD model was used to depict the dose–response relationship of posaconazole and the GAI.
Results: A one-compartment model with first-order absorption from a depot compartment and linear elimination best described the pharmacokinetics of posaconazole. The pharmacodynamic effect of posaconazole plasma concentrations on GAI was best described by dynamic Hill-functions reflecting growth and kill of the fungus.
Through simulations of AUC0–24h at steady-state, the dose–response relationship between posaconazole and the GAI was explored. The relationship can be described by the exponential function: AUCGAI 0–24h = 104*e−0.07*·AUCposaconazole 0−24h +17.61
Conclusion: The nonparametric population PKPD model adequately describes posaconazole pharmacokinetics and its pharmacodynamic effect on fungal growth, reflected by the GAI in both treatment and prophylaxis of invasive aspergillosis. An exponential decline best described the dose–response relationship between posaconazole plasma concentrations and the GAI.
References
-
1.
Petraitiene R et al. 2001 Antimicrob Agents Chemother.
-
2.
Neely MN et al. 2012 Therapeutic Drug Monitoring.
W-001
Soluble target engagement, cell-surface receptor occupancy and nonlinear pharmacokinetics… Are all telling the same story?
Nieves Velez de Mendizabal1, John J. Rhoden1
1Lilly Research Laboratories, Indianapolis, IN, USA
Background and Objectives: LY is a human monoclonal antibody that binds specifically to a receptor expressed on immune-cells, blocking the receptor-ligand interaction. Due to the absence of any efficacy/activity biomarker, soluble target-engagement (sTE) and cell-surface receptor-occupancy (csRO) were used as surrogates for drug activity. Quantification of soluble target and cell-surface receptor concentrations can be challenging. Since cell-surface binding is the mechanism responsible for nonlinear PK, it can potentially be used as a surrogate for csRO. Here, we compare drug activity results between three different approaches: sTE, csRO on an immune-cell subset, and csRO estimated from nonlinear PK. This approach can influence selection of biomarker assays in the clinic, which can be complex and expensive.
Methods: Data from a Phase 1a, dose escalation study (N = 18) were used in the analysis. A very broad Q2W dose range was tested. A population PKPD model was developed (NONMEM® version 7.3). The model simultaneously describes the PK in plasma and soluble target accumulation in serum. The developed model was then used for prediction of sTE and csRO based on PK and compared to measured csRO.
Results: Selected model was 2-compartment, with both linear and nonlinear elimination (Michelis-Menten). sTE in plasma was used as a marker for demonstrating LY binding capacity. csRO based on the Km parameter was also used as a marker for cell-surface binding. Both sTE and csRO derived from PK were compared with the measured csRO on immune-cells.
Conclusions: Strong agreement was observed among sTE, csRO derived from PK, and measured csRO. This demonstrated no need for implementation of TE/RO assays. Therefore, if nonlinear PK is well described, this can be used to estimate cell-surface binding, eliminating the need to quantify soluble target or directly measure RO.
Reference
-
1.
Two new parameters for characterizing ligand binding systems. Andrew Stein, 2017-ACoP8
W-002
Population pharmacokinetic analysis of lanadelumab in patients with hereditary angioedema
Colin Chang1, Elliot Offman1, JF Marier1, Patrick Martin2, Yi Wang2
1Certara Strategic Consulting, Montreal, QC, Canada; 2Shire, Lexington, MA, USA
Objectives: Lanadelumab, a fully human monoclonal antibody (mAb) of plasma kallikrein, is being developed for prophylactic treatment against angioedema attacks in patients with hereditary angioedema (HAE). A population pharmacokinetic (PPK) analysis of lanadelumab was performed following subcutaneous administration in 257 subjects to assess sources of variability.
Methods: The analysis included 23 (8.95%) adolescents, 225 (87.6%) adults, and 9 (3.50%) elderly subjects. PPK analysis was performed using a nonlinear mixed effect modeling approach and sources of variability (sex, age, race, site of injection, self-administration, baseline HAE severity, on-treatment HAE attacks, markers of liver/kidney function, anti-drug antibody) were explored via a stepwise covariate analysis.
Results: The PK of lanadelumab was best described by a one-compartment model with allometric components and linear elimination. The absorption was characterized using a firstorder rate model without lag time. -Population estimates of apparent clearance and volume of distribution were 0.0249 L/h (0.598 L/day) and 12.8 L, respectively. The elimination half-life was 356 h (14.8 days). Complete drug absorption is expected to occur within 8 days after dosing. The PK of lanadelumab was dependent on body weight and population (healthy subjects vs. patients with HAE). Mild and moderate renal impairment had no effect on the clearance or volume of distribution. The presence of anti-drug antibodies and neutralizing antibodies did not affect the PK of lanadelumab. Baseline HAE severity, on-treatment HAE attacks (within 7-days prior to PK sampling) and concomitant use of drugs to treat symptoms of HAE (i.e., analgesic, antibacterial, antihistamine, anti-inflammatory and anti-rheumatic drugs) or HAE attacks (i.e., C1 esterase inhibitor, ecallantide or icatibant) did not affect the PK of lanadelumab. Simulations supported dosing of 300 mg every 2 weeks in adolescent and adult patients with HAE.
Conclusions: As expected, lanadelumab displayed mAb-like PK characteristics (i.e., long elimination half-life) for long-term prophylaxis against HAE attacks.
W-003
Semi-mechanistic modeling of BRAF and c-MET inhibitors in the treatment of metastatic melanoma
Dmitrii Shchelokov1, Oleg Demin Jr1
1InSysBio, Moscow, Russia
Objectives: To develop a semi-mechanistic model of BRAF inhibitors therapy for melanoma (using vemurafenib as an example) which is able to describe the emergence of drug resistance during therapy; to describe inter-patient variability in response to vemurafenib treatment; to explore the effect of c-MET inhibitors in combination with vemurafenib for different types of virtual patients.
Methods: The model is a system of ordinary differential equations describing 4 various cell states (c-MET negative/positive and sensitive/resistant to vemurafenib melanoma cells), proliferation, apoptosis and transition between these cell states, as well as effects of vemurafenib and HGF on the rate of proliferation. Parameters of the model were calculated or fitted on the basis of available published data. To introduce an inter-patient variability in the model for further multiple simulations we compiled available published data and estimated variability of the model parameters. Clinical data on time to progression were used to estimate the amount of pre-existing drug-resistant cells in the tumor before therapy.
Results: Model is able to adequately reproduce all possible types of tumor response to vemurafenib monotherapy according to RECIST criteria (Figure 1). An overall response rate predicted by the model was 70% versus 53% (95% CI, 44 to 62) observed in phase 2 clinical trial (NCT00949702). The model predicts that usage of c-MET inhibitors in combination with BRAF inhibitors could improve response and overall response rate, as well as delay or avoid BRAF-inhibitors resistance development and relapse.
Conclusions: Developed model satisfactory reproduces clinical data for various types of melanoma patients. The model was able to predict the variability in response to vemurafenib treatment on the basis of published data only. The model could be used as a tool for optimization of new targeted therapies and their combinations for melanoma treatment.

Fig. 1 Model simulations (A) and clinical data ClinicalTrails.gov NCT00949702 (B) on tumor volume changes during treatment of melanoma patients with 960 mg BID vemurafenib
W-004
Identification of parameters of QSP models responsible for observed variability in experimental data
Galina Kolesova1, Oleg Demin1
1InSysBio, Moscow, Russia
Objective: to develop and test an algorithm enabling us to find out those parameters of QSP models which explain the observable variability of experimental data.
Methods: Variability in baseline concentration data is considered for the purpose of the presented analysis. In framework of QSP model baseline concentration data are approximated by values of model variables at steady state. Proposed algorithm includes (i) estimation of distribution parameters of experimental data, (ii) generation of large set of pseudo-experimental data from the distribution, (iii) fitting of model parameters against generated pseudo-experimental samples, (iv) multiple simulation of model variables in accordance with fitted parameters and (v) comparison of distribution of the simulated concentrations with the initially estimated distribution of experimental data using Student’s t-test, Q–Q plot and Kolmogorov–Smirnov test. The proposed algorithm was tested in framework of simple QSP model describing 2 cell states and 1 regulatory cytokine.
Results: To test the proposed algorithm we have assumed that only 1 “known” parameter of the simple QSP model is source of variability in baseline steady state concentrations. Then applying the algorithm we have tested whether it is possible to correctly identify the “known” parameter in case of different characteristics of its distribution. It was found that (i) identification of the “known” parameter is not possible in the case of relatively small value of dispersion of its distribution, i.e. the simulated distribution of the pseudo-experimental data can be described by the variability of any parameter in the model, (ii) in the case of relatively high value of the dispersion, the parameter can be correctly identified,. (iii) in the case of data incompleteness the results may change.
Conclusions: An algorithm enabling us to find out those parameters of QSP models which explain the observable variability of experimental data were proposed and tested for simple QSP model.
W-005
CNS penetration of cyclophosphamide and metabolites in mice bearing Group 3 medulloblastoma and non-tumor bearing mice
Olivia Campagne1, Abigail Davis1, Bo Zhong1, Martine F. Roussel2, Clinton F. Stewart1
1Pharmaceutical Sciences Department, St. Jude Children’s Research Hospital, Memphis, TN 2Department of Tumor Cell Biology, St. Jude Children’s Research Hospital, Memphis, TN
Objectives: Cyclophosphamide (CTX) is widely used in children with Group 3 medulloblastoma (G3 MB), however, little is known about the CNS penetration of CTX or its metabolites. Thus, this study uses cerebral microdialysis to characterize the CNS penetration of CTX and metabolites (4-hydroxy-cyclophosphamide (4HY) and carboxyphosphoramide mustard (CEPM)) in non-tumor bearing mice and mice bearing orthotopic G3 MB.
Methods: Plasma pharmacokinetic studies of CTX (130 mg/kg IP) were performed in CD1 nude mice (n = 15) using a population-based sampling scheme to determine pharmacokinetic parameters and D-optimal time-points (e.g., 0.25, 1, and 2 h) for microdialysis studies. Microdialysis (130 mg/kg IP) was performed in tumor-bearing mice (G3 MB, n = 8) and CD1 nude mice (NTB-1, n = 5), using derivatizing solution to stabilize 4HY in the probe. A second control group (NTB-2, n = 9) evaluated derivatizing solution in collection tubes. Extracellular fluid (ECF) was collected over 60-minute intervals for 24 h post-dose. Plasma and ECF CTX and CEPM concentrations were measured using LC–MS/MS, and plasma and ECF 4HY were measured with another LC–MS/MS method. Modeling was performed using MONOLIX.
Results: CTX and metabolite plasma and ECF concentrations were adequately described using a population-based pharmacokinetic model (Figure 1). Plasma exposures of CTX, 4HY, and CEPM were similar across all groups (mean AUC = 114.8, 40.8, and 80.2 µmol hr/L respectively). In each group, CTX CNS penetration was greater than its metabolites. Mean 4HY ECF influx and efflux clearances were greater in G3 MB than in NTB-1 mice (Influx: 1.57 × 10⁻² versus 4.78 × 10⁻³ L/hr/kg, p = 0.02; Efflux: 4.97 × 10⁻² versus 3.64 × 10⁻² L/hr/kg, p = 0.006). Mean CTX and 4HY ECF efflux clearances were lower in NTB-1 than NTB-2 (CTX: 0.124 versus 0.182 L/hr/kg, p < 10−8, 4HY:0.036 versus 0.203 L/hr/kg, p < 10−16). CEPM ECF exposure was similar across all groups (mean AUC = 3.39 µmol hr/L).
Conclusions: The CNS penetration of CTX and metabolites was characterized, however, the effects of collection methods still require further investigation.

W-006
Interspecies allometric scaling of pre-clinical data to predict human PK following intravenous administration and open joint irrigation of PLG0206 – a novel antibacterial peptide
Parviz Ghahramani1, Joannellyn Chiu1, Sanjay Kakkar2, Jonathan Steckbeck2.
1Inncelerex, Jersey City, NJ, USA; 2Peptilogics, Pittsburgh, PA, USA.
Introduction: PLG0206 is a novel eCAP (engineered cationic antibiotic peptide) with potent activity in non-clinical models against a broad spectrum of difficult-to-treat Gram-negative and Gram-positive pathogens.
Objectives: To develop a population-PK (PPK) model for interspecies allometric scaling to extrapolate to humans following intravenous administration and open-joint irrigation during prosthetic joint infection surgery.
Methods: PPK model was developed for data collected in 193 animals (64 monkeys, 82 rats, 34 mice, 3 dogs), with 1460 PK observations following intravenous administration. 1-, 2- and 3-compartment models with zero-order infusion and interspecies scaling (body-weight on CL, V, and Q) were evaluated. Covariate sex was assessed. The model was validated using bootstrap and pcVPC. Post-hoc parameter estimates were used to predict AUC0–24 and Cmax following single doses ranging 0.25–3 mg/kg 1-hour infusion in humans. The model was then adapted to develop a novel PK model (not found in literature) for joint irrigation by adding two sequential compartments representing drug absorption during open-joint irrigation (Figure). Ka was assumed to be 0.248 h−1 (highest literature-reported rate for large-molecule joint administration). Systemic exposure following joint irrigation (1 and 2 mg/kg total dose) was simulated (n = 100) using the latter model.
Results: 3-compartment linear-model with zero-order absorption adequately described the data. Fixed-effects were generally well estimated (%RSE < 20%). Bootstrap and pcVPCs supported model adequacy. For human intravenous administration, predicted median AUC0–24 for 1, 2 and 3 mg/kg dose was 1997, 5851 and 10843 ng.h/mL, respectively, with corresponding Cmax at 964, 2374 and 3975 ng/mL. For simulated systemic concentrations following joint irrigation, at 1 and 2 mg/kg dose, the AUC was 13 and 25 ng.h/mL and Cmax was 3 and 6 ng/mL, respectively.
Conclusions: The model described the data adequately for all species and was suitable for simulations to predict PK profiles for extrapolation to humans. The predicted relative exposure (AUC and Cmax) following joint administration is generally < 1% of the examined corresponding intravenous dose.

W-007
An HCV nucleoside inhibitor MK-3682 minimal PBPK-PD model for application in hypothesis generation regarding metabolic pathways and perturbations under various conditions
Paul van den Berg1, Teun M. Post1, Wei Gao2, Randy Miller2, Filippos Kesisoglou2, Leticia Arrington2, Matthew L. Rizk2
1LAP&P Consultants, Leiden, The Netherlands; 2Merck & Co., Inc., Kenilworth, NJ, USA
Objectives: To integrate the complex interplay between MK-3682 and its C- and U-nucleoside metabolites’ (M5 and M6) plasma pharmacokinetics (PK) and to link the projected PK of the active phosphorylated form (nucleoside triphosphate; NTP), which does not circulate, with efficacy.
Methods: A minimal PBPK model approach, based on Brill et al. [1], was applied to characterize the PK of MK-3682 and its metabolism to M5 and M6 in both the gut wall and the liver. PK data from five phase I studies and one phase I/IIa study were used (n = 217 subjects).
Results: The model captured differences in PK between formulations, between HCV patients and healthy volunteers and between MK-3682 monotherapy or coadministration with itraconazole. Separate formation pathways of M5 and M6 in the gut wall and in liver could be identified which was important for investigating the link between PK and efficacy, as only M5 and M6 formed in liver are derivatives of NTP. The PK and PD effects from a key drug interaction study with itraconazole could be explained by the model as well.
Conclusions: The minimal PBPK model leveraged knowledge of known/hypothesized metabolic pathways and provided a better understanding of the complex hypothesized metabolism of MK-3682 and of the relationship between plasma PK and projected liver NTP. This framework supported and guided hypothesis generation and understanding regarding underlying metabolic pathways and perturbations under various conditions, including impact on downstream viral load. Overall, this approach illustrates the value of a PBPK approach to derive understanding of the action site kinetics to better inform resulting response.

Fig. 1 Schematic Representation of the Final minimal PBPK Model.
Reference
-
1.
M.J.E. Brill et al. Semiphysiologically based pharmacokinetic model for midazolam and CYP3A mediated metabolite 1-OH-midazolam in morbidly obese and weight loss surgery patients. CPT Pharmacometrics Syst. Pharmacol., 5, 2016.
W-008
Personalized management of diabetes for the titration of insulin during initiation of SGLT2i treatment
Pavel Balazki1,2, Stephan Schaller2, Thomas Eissing3, Thorsten Lehr1
1Clinical Pharmacy, Saarland University, Saarbruecken, Germany; 2esqLABS GmbH, Saterland, Germany; 3Clinical Pharmacometrics, Bayer AG, Leverkusen, Germany
Objectives: Sodium-dependent glucose co-transporter 2 inhibitors (SGLT2i) are a co-treatment option for type 2 diabetes (T2DM) patients when blood glucose control cannot be achieved with insulin alone. SGLT2i treatment allows reduction of the daily dose of insulin (1), potentially contributing to the beneficial effects of SGLT2i treatment on weight gain and hypertension (2). Our objective is to establish a digital platform for the optimization of personalized titration of insulin during initiation of SLGT2i treatment.
Methods: A recently developed physiology based pharmacokinetics/pharmacodynamics (PBPK/PD) model for SGLT2i dapagliflozin was integrated with a QSP Diabetes Platform (3, 4) (Figure 1). Two clinical trials of SGLT2i co-administration (5, 6) were re-simulated and used for model validation.
Results: The model predicts the anticipated effects of SGLT2i, including improved glycemic control and the reduction of required insulin dose. The predicted reduction of insulin dose is higher than observed in the trials, probably due to the progression of insulin resistance in examined patients.
Conclusions: As an example, for digitally enabled personalized medicine, the diabetes platform, provided individual data, can support assessing the outcomes of SGLT2i treatment initiation with subsequent optimization of individual insulin titration. As a next step, disease progression mechanisms will be included into the model to assess implications of long-term effects of SGLT2i on insulin dosing, glycemic control, and hyperfiltration.

Fig. 1 Schematic representation of the QSP Diabetes Platform with detailed representation of the kidney module including the SGLT2i mode of action.
References
-
1.
Tang, H, et al., Diabetes, Obesity and Metabolism. 19, 142–147 (2017).
-
2.
Soleimani, M, Kidney International. 87, 497–499 (2015).
-
3.
Balazki, P, Eissing, T, Lehr, T. In review.
-
4.
Schaller, S, et al., CPT: Pharmacometrics & Systems Pharmacology. 2, e65 (2013).
-
5.
Wilding, JPH, et al., Diabetes Care. 32, 1656–1662 (2009).
-
6.
Wilding, JPH, Woo, V, Rohwedder, K, Sugg, J, Parikh, S, Diabetes, Obesity and Metabolism. 16, 124–136 (2014).
W-009
Assessing the distribution impact on equivalence test of baseline-normalized pharmacodynamic (PD) endpoint to support biosimilar development
Peijuan Zhu1, Chyi-Hung Hsu1, Steven Xu1, Liping Zhang1
1Janssen Pharmaceuticals Research and Development Inc, Raritan, NJ USA 2Merck & Co., Inc, West Point, PA USA
Objectives: The PD equivalence test is critical for biosimilar development. Sometimes the PD data are highly variable and are baseline-normalized to reduce the variability and hence the samples size required. The baseline-normalized PD data may not be log-normally distributed, and the suitability of the standard equivalence test assuming log-normal distribution is unknown. The objective is to evaluate the impacts of baseline-normalization on the operating characteristics of the equivalence test. The relationship between biological potency and equivalence margin is also explored.
Methods: The bone resorption marker CTX profile was simulated using the published PK/PD models and the AUEC of baseline-normalized CTX was calculated and its distribution was evaluated. The standard equivalence tests using 90% CI of geometric-mean-ratio were conducted applied to baseline-normalized AUEC to evaluate the Type-I error and power. Bootstrap method based on 90% CI of median difference was also evaluated and its performance were compared to the standard equivalence test.
Results: The distribution of baseline-normalized AUEC was not log-normal, but rather was right skewed with an upper bound. A 4-fold change in IC50 led to −2.6% change in AUEC, and the corresponding equivalence margin (0.974, 1.027) was chosen. The standard equivalence test had lower power than expected, while the two-sided Type I error was maintained below 10%. Bias of point estimate was observed on both sides of the margin. The bootstrap method had minimal bias of point estimate but has low power due to a wider 90% CI.
Conclusions: The baseline-normalized AUEC was not log-normally distributed for typical inhibition PD profiles. However, the performance of the standard geometric-mean-ratio-based equivalence test on the baseline-normalized AUEC was reasonable, with the power lower than expected, and Type-I error maintained below 10%. The bootstrap method has high accuracy in the point estimate, however its power was low due to a wider CI.
Table 1 Comparison of standard equivalence test based on geometric-mean-ratio v.s. the bootstrap method.

W-010
Machine learning models for the prediction of chemotherapy-induced peripheral neuropathy
Peter Bloomingdale and Donald E. Mager
Department of Pharmaceutical Sciences, University at Buffalo, SUNY
Objective: Drug-induced peripheral neuropathy (PN) is a common and major dose-limiting toxicity for many anti-cancer agents. The objective of this study is to develop quantitative-structure toxicity relationship (QSTR) models, using machine learning algorithms, to predict PN.
Methods: The incidence of PN for 95 approved drugs were obtained from package inserts, medical reviews, and scientific literature. ADMET Predictor™ was used to generate molecular descriptors, which were provided as inputs to artificial neural network and support vector machine algorithms to predict the clinical incidence of PN using ADMET Modeler™. Frequent molecular descriptors were determined and used to inform structural modifications of bortezomib, a proteasome inhibitor, to reduce PN incidence. Final QSTR models were applied to predict the PN incidence of 60 antineoplastic drug candidates that are under clinical investigation.
Results: Artificial neural network models quantitatively predicted the incidence of PN with acceptable performance (R2 range. Support vector machine models classified drugs into three groups based upon their PN incidence (≥ 10% high; < 10% and ≥ 2% medium; < 2% low), with strong predictive performance. The number of aromatic nitrogens was identified as the most frequent molecular descriptor associated with PN. The removal of aromatic nitrogens from the molecular structure of bortezomib reduced the predicted PN incidence from 32.3% to 21.1%. Twenty-two out of sixty antineoplastic agents currently in clinical trials were predicted to have a high incidence of PN in at least one QSTR model.
Conclusions: The application of in silico tools for predicting drug neurotoxicity, such as the QSTR models provided here, may be useful for developing safer therapeutics and ultimately reduce the clinical burden of CIPN. QSTR models for drug-induced PN could be adopted potentially in early discovery to screen out drugs that are highly neurotoxic and identify safer drug candidates to move forward into lead optimization.
W-011
Translational PK/PD modeling to inform first-in-human dose selection of JNJ-64179375 an exosite-1 thrombin inhibitor
Pharavee Jaiprasart, Madhu Chintala, Zheng Huang Devine, Weirong Wang
Janssen Research & Development, LLC., North Wales, PA, USA
Objectives: JNJ-64179375 is a first-in-class, recombinant, fully human IgG4 monoclonal antibody (mAb) that binds with high affinity and specificity to the exosite 1 region on thrombin and acts as an anticoagulant. We quantitatively described the relationship of JNJ-64179375 concentration with the anti-coagulation effects in pre-clinical species. First-in-human (FIH) doses were selected based on approaches built from pharmacokinetics (PK) in non-human primate using allometry.
Methods: The PK and pharmacodynamic (PD) data in rats and cynomolgus monkey following intravenous (IV) and subcutaneous (SC) administrations were used for PK/PD model development. Interspecies scaling was applied by describing the relationships between body weight and PK parameters with the allometric equation to estimate human parameters and used for maximum recommended starting dose (MRSD) determination.
Results: In agreement with the drug’s mechanism of action, among the PD measurements tested, thrombin time (TT) was shown to be the most sensitive readout as compared to activated partial thromboplastic time (aPTT), and prothrombin time (PT). JNJ-64179375 displays the expected PK characteristics of an IgG4 mAb, with the mean T1/2 ranged from 7.2 to 17.3 days across all dose groups in monkeys. The JNJ-64179375 concentrations corresponding to various PD readouts in the preclinical models, including 2x of TT baseline in rats and monkeys, IC20 and IC50 in the rat AV-shunt model, and EC20 of bleeding volume difference in the monkey liver bleeding model were determined. On applying the allometric scaling to predict PK parameters for a 70-kg human and principles of the minimum anticipated biological effective level (MABEL) of JNJ-64179375, 0.03 mg/kg IV dose was identified as the starting dose, and lower than both rat and monkey no-observed-adverse-effect level (NOAEL) exposures (> 10 mg/kg).
Conclusion: The PK/PD relationship of JNJ-64179375 in rats and monkeys was well characterized by the developed PK/PD model. FIH dose was proposed based on a model-based approach.
W-012
A population pharmacokinetic-pharmacodynamic model for tenofovir in plasma and rectal tissues of healthy volunteers
P Jayachandran1, M Garcia-Cremades1, P Anton3, C Hendrix2, RM Savic1
1Department of Bioengineering and Therapeutic Sciences, University of California San Francisco, San Francisco, CA, USA 2Division of Clinical Pharmacology, Department of Medicine, Johns Hopkins University, Baltimore, MD, USA 3 University of California Los Angeles, Los Angeles, CA, USA
Objectives: Tenofovir disoproxil fumarate (TDF; oral tablet) and tenofovir (TFV, rectal gel) are nucleoside reverse-transcriptase inhibitors used to prevent HIV sexual transmission. Defining a tissue and plasma-specific prophylactic concentration is central to PrEP product development. We developed a mechanistic population pharmacokinetic-pharmacodynamic (popPKPD) model describing the relationship between plasma TFV and TFV-diphosphate (active metabolite, TFVdp) in mucosal mononuclear cells (MMCs). This relationship was linked to infection suppression as measured by ex vivo explant assay.
Methods: Plasma and MMC drug concentration and p24-antigen expression data were obtained from a Phase 1 study (MTN0061, n = 18) comparing single dose administrations of 300 mg TDF with both single and multiple dose administrations of 1%TFV in HIV-seronegative adults. We developed and evaluated a (1) 2-compartment popPK model for TFV with an MMC compartment for TFVdp, and (2) mechanistic PKPD model with a viral growth compartment and a delayed compartment for p24-antigen expression (Figure 1). The drug effect was linked to MMC TFVdp. NONMEM 7.4.1 was used for model building.
Results: Plasma TFV pharmacokinetic parameter estimates were ka (1.78 h−1, oral; 22.2 h−1, rectal), CL/F (52.1L/h), and F (0.102, rectal). MMC TFVdp pharmacokinetic parameter estimates were effect-compartment rate constant (kp-rt, 0.0063 h−1), and ratio (1030[fmol/million cells]/[ng/mL]). Viral mechanistic parameter estimates were viral growth rate (0.045 h−1), viral death rate (0.0351 h−1), p24-antigen expression rate constant (0.0002 h−1), and concentration-effect slope (0.0001 [pg/mL]/[fmol/million cells]). Based on the model, an MMC TFVdp concentration of > 5000fmol/million cells will lead to full viral suppression in the ex vivo assay.
Conclusion: This mechanistic popPKPD model characterizes well the dose-concentration–response effect of p24-antigen suppression for tenofovir single and multiple-dose administration. It will be used to predict in vivo tenofovir concentrations necessary for infection suppression.

Fig. 1 PKPD model schematic and MMC TFVdp concentrations (fmol/million cells) necessary to suppress HIV infection (p24 = 500 pg/mL; horizontal line)
References
-
1.
Richardson-Harman, N, et al., PLoS One 9.10 (2014): e111507.
W-013
Development of a PBPK model for docetaxel as a CYP3A substrate and accounting for binding to multiple plasma proteins.
Rachel H. Rose1, Ciarán Fisher1, Iain Gardner1
1Certara UK, Simcyp Division, Sheffield, UK.
Objectives: The anticancer agent docetaxel is cleared through CYP3A4, biliary and renal elimination pathways, thus has interaction potential as a victim when used in combination with CYP3A4 inhibitors. Plasma protein levels, most notably of 1-acid glycoprotein (AAG) which shows high variability in cancer patients, also affect docetaxel clearance [1]. We aimed to develop a PBPK model for docetaxel as a CYP3A substrate and incorporating fraction unbound in plasma (fu) predicted from binding to multiple plasma proteins.
Methods: A PBPK model for docetaxel in cancer patients was developed in Simcyp V17 release 1 using the built in Cancer population model. Elimination of docetaxel was characterized using a reverse translation approach whereby the relative contributions of CYP3A4, renal and biliary clearance pathways to systemic clearance were apportioned using in vitro and in vivo data [1–3]. Simulations were performed to predict the interaction with ketoconazole. The fu was predicted from in vitro binding to AAG, albumin and lipoprotein [4] and plasma AAG and albumin concentrations.
Results: Simulated and observed docetaxel Cmax and AUC ratios are in reasonable agreement for a range of ketoconazole doses (Table 1). Predicted fu for cancer patients was 0.062 ± 0.012 (mean ± SD) compared to the reported mean fu of 0.058–0.066 measured for cancer patients [5, 6].
Table 1 Observed and predicted Cmax and AUC ratios for docetaxel in the presence of ketoconazole
Ketoconazole dose | Observed | Predicted | ||||
|---|---|---|---|---|---|---|
Dose normalized Cmax ratio | Dose normalized AUC ratio | Cmax ratio | Predicted/ observed | AUC ratio | Predicted/ observed | |
200 mg od for 3 days [6] | 1.27# | 2.19# | 1.40 (1.22–1.54)# | 1.10 | 1.57 (1.32–1.73)# | 0.72 |
400 mg tid; 7 doses [7] | 1.02# | 2.08# | 1.46 (1.24–1.65)# | 1.43 | 1.79 (1.47–2.06)# | 0.86 |
200 mg tid [8] | – | 1.68 (1.34–2.10)$ | 1.39 (1.32–1.44)$ | – | 1.90 (1.82–1.95)$ | 1.13 |
200 mg am, 200 mg pm, 400 mg evening [8] | – | 1.60 (1.26–2.04)$ | 1.41 (1.26–1.58)$ | – | 2.07 (1.84–2.34)$ | 1.29 |
400 mg tid [8] | – | 2.62 (1.92–3.52)$ | 1.36 (1.22–1.54)$ | – | 2.00 (1.78–2.28)$ | 0.76 |
Conclusions: Mechanistically accounting for variability in fu related to plasma protein concentrations should improve prediction of variability in clearance for cancer patients. The verified docetaxel model may be used to predict interaction with CYP3A4 inhibitors a priori.
References
-
1.
Bruno (1996) J Pharmacokinetic Biopharm 24:153–172.
-
2.
Shou (1998) Pharmacogenetics 8:391–401.
-
3.
van Zuylen (2000) Clin Cancer Res 6:2598–2603.
-
4.
Urien (1996) Invest New Drugs 14:147–151.
-
5.
Thai (2015) Br J Clin Pharmacol 80:534–547.
-
6.
Engels (2004) Clin Pharmacol Ther 75:448–454.
-
7.
Engels (2006) Cancer Biol Ther 5:833–839
-
8.
Figg (2010) J Urol 183:2219–2226.
W-014
Translational pharmacokinetic-pharmacodynamic modelling predicts human exposure-target engagement response
Rhys Jones1, Markus Friden2, Rasmus Jansson-Löfmark3
1Oncology IMED Biotech Unit, AstraZeneca, UK; 2RIA IMED Biotech Unit, Sweden; 3CVRM IMED Biotech Unit, Sweden
Objectives: Pre-clinical data and predictive modelling are extensively used in support of candidate drugs taken into the clinic. This includes the prediction of human dose anchored upon an understanding of the level of target modulation required to drive efficacy in an animal model. Given the extensive implementation across the industry of model-based solutions to predict human dose, it is perhaps surprising that there are relatively few publications reporting an analysis that evaluates the pre-clinical to clinical translation at a cross therapy area level. This work presents such an analysis looking across the AstraZeneca portfolio and examines how pre-clinical data/models translates to clinical pharmacodynamic response.
Methods: A framework has been established to enable an objective evaluation for the translation of an exposure–response relationship from an animal model to that observed in human for pharmacodynamic biomarkers.
Results: In the current analysis 19 projects were evaluated and the criteria for inclusion of a compound for evaluation were driven by (1) the availability of sufficient clinical data to enable a derivation of EC50, (2) the same PD biomarker measured both in the animal model used and the clinic.
Of those projects that had clinical data available to enable back translation of a target engagement biomarker, 17 out of 19 evaluated showed an exposure response relationship that translated within 2-fold.
Conclusions: This exercise has demonstrated that pre-clinical tools and pharmacokinetic-pharmacodynamic modelling can robustly predict human exposure–response relationships for target engagement biomarkers. However, attrition in the clinic continues to be dominated by lack of efficacy, and therefore, much work is still required to improve the translation and prediction of human drug efficacy, linking target modulation to effects on disease biology.
W-015
Development of a translational model to predict d-amphetamine exposure and dopamine response in human brain based on microdialysis measures of d-amphetamine and dopamine in rat and non-human primate striatum and prefrontal cortex
Saugat Adhikari1, Chandrali Bhattacharya1 and Robert E. Stratford, Jr.2
1Department of Pharmacy Practice, College of Pharmacy, Purdue University; 2Division of Clinical Pharmacology, Department of Medicine, School of Medicine, Indiana University
Objectives: Develop d-amphetamine/dopamine response PK/PD models in striatum and prefrontal cortex of rats and non-human primates (NHPs). Apply allometric scaling to predict d-amphetamine PK and elicited dopamine response in human brain.
Methods: Microdialysis sampling of brain extracellular fluid (ECF) of male Wistar rats and male cynomolgus monkeys following a 0.1 mg/kg intravenous dose of d-amphetamine with HPLC–MS/MS provided d-amphetamine and dopamine exposures in striatum and prefrontal cortex. An indirect response PD model, based on known d-amphetamine mechanisms and neuronal system regulation of dopamine, was linked to d-amphetamine exposure in ECF to predict ECF dopamine. FOCE implemented in Phoenix NLME 8.0 was used to develop region- and species-specific PK/PD models. Model parameters were scaled by body weight to predict human brain ECF d-amphetamine exposure and dopamine response in the two brain regions.
Results: In both brain regions of both species, PD model structure optimization indicated that d-amphetamine increased dopamine by stimulating reverse transport via the dopamine transporter. Tolerance development, observed in both brain regions for the two species, was evident by observed clockwise hysteresis; this necessitated incorporation of a moderator function into the model. Preservation of PD mechanism in the two species was evident, and supported allometric scaling of brain PK and PD parameters to simulate dopamine time courses in human brain. Simulations were consistent with reported clockwise hysteresis between d-amphetamine systemic exposure and behavioral measures in humans (1).
Conclusions: A mechanistic PK/PD model was developed in striatum and prefrontal cortex of rats and NHPs. Consistency of d-amphetamine actions and system counter-regulation in the two regions and in both species supported prediction of elicited dopamine time courses in human brain.
References
Brauer L, Ambre J, de Wet H (1996). Acute tolerance to subjective but not cardiovascular effects of d-amphetamine in normal, healthy men. J Clin Psychopharmacol 16 (1): 72–76.
W-016
Whole-body PBPK model for a translational study of Azathioprine pharmacokinetics
Roberta Bartolucci, Nicola Melillo, Paolo Magni
Laboratory of Bioinformatics, Mathematical Modelling and Synthetic Biology, Department of Electrical, Computer and Biomedical Engineering, University of Pavia, Pavia, Italy
ENCORE submission: The results in this abstract have been previously presented at the PAGE Meeting 2018, Montreux, Switzerland (29 May-1 June 2018) and published in the conference proceedings as abstract 8547.
Objectives: A mechanistic model was used to describe Azathioprine pharmacokinetics in rats in order to predict the plasma concentration in humans. Azathioprine (AZA) is an antimetabolite prodrug used for autoimmune disorders. It is converted into 6-mercaptopurine (6MP) which in turn is subject to an extensive metabolism [1].
Methods: Physiologically-based pharmacokinetics (PBPK) models were chosen to describe AZA and 6MP in rats and humans. Two coupled PBPK models were developed in MATLAB, each one describing the kinetics of one molecule within the whole organism, with the structure presented in the figure. Metabolism reactions were implemented as Michaelis–Menten equations.
Results: Three scenarios (Intravenous administration of 6MP, oral administration of 6MP and oral administration of AZA) were simulated in rats using in vivo data [2]-[3], to estimate seven parameters. The model obtained was then used to simulate an oral administration of AZA in humans, and the predicted plasma concentration–time profile of 6MP was compared with literature data [4].
Conclusions: The PK profiles in rats were similar to the experimental data and a good prediction was obtained in humans, with a plasma concentration curve of 6MP within the range of a standard deviation from the mean values. Therefore, the model could be useful for further investigations regarding the transition from pre-clinical to clinical phases.

References
-
1.
L. Lennard, “The clinical pharmacology of 6-mercaptopurine”, European Journal of Clinical Pharmacology, 1992.
-
2.
M. Umrethia et Al., “6-Mercaptopurine (6-MP) Entrapped Stealth Liposomes for Improvement of Leukemic Treatment without Hepatotoxicity and Nephrotoxicity”, Cancer Investigation, 2007.
-
3.
N.K. Burton and G.W. Aherne, “The effect of cotrimoxazole on the absorption of orally administered 6-mercaptopurine in the rat”, Cancer Chemotherapy and Pharmacology, 1986.
-
4.
B.J. Zins et al., “A Dose-Ranging Study of Azathioprine Pharmacokinetics After Single-Dose Administration of a Delayed-Release Oral Formulation”, Journal of Clinical Pharmacology, 1997.
W-017
Pediatric dose selection using modeling and simulation for a drug treating fatal viral infection developed under the Animal Rule
Ruo-Jing Li1, Chao Liu1, Su-Young Choi2, Shirley Seo2, Yaning Wang1
1Division of Pharmacometrics, Office of Clinical Pharmacology, US Food and Drug Administration, Silver Springs, MD, USA 2Dvision of Clinical Pharmacology IV, Office of Clinical Pharmacology, US Food and Drug Administration, Silver Springs, MD, USA
Objectives: Drug X is a small molecule developed for the treatment of fatal viral infection in biodefense. Because the infection does not naturally occur, and it is life-threatening, conducting an efficacy trial in humans is neither feasible nor ethical. Therefore, Drug X was developed under the US Food and Drug Administration (FDA) Animal Rule. The pharmacokinetics and safety were assessed in healthy adults. No clinical studies were conducted in children. The objective is to evaluate the pediatric dose selection via modeling and simulation.
Methods: Population PK model was employed to derive the pediatrics dosing regimens. Data were pooled from three clinical studies, including 199 healthy adult volunteers. The population PK was estimated using a non-linear mixed effects modeling approach. The pediatric dose selection was aimed to match the simulated exposures in pediatrics with the observed exposures in adults. Allometric scaling was applied for the extrapolation from adults to pediatrics, where the allometric coefficient for clearance was fixed at 0.75. The body weight effect on apparent clearance estimated by clinical data served as sensitivity analysis.
Results: The updated population PK model of Drug X was described by a two-compartment model with zero-order absorption and first-order elimination. Based on the simulation, the FDA proposed a dosing scheme for pediatric patients. This simulation may not be robust enough to predict the exposure profile for pediatrics younger than 2 years of age due to the immature immune system, and distinct ontogeny and organ maturation status.
Conclusion: Modeling and simulation was applied for pediatric dosing selection when no clinical data were available in children. The FDA proposed pediatric dosing regimens that are predicted to produce exposures that match or slightly exceed that in adults to preserve efficacy under various conditions and stay below the maximum safety concentration that was associated with seizure in preclinical species.
W-018
Time-varying clearance of therapeutic monoclonal antibody in inflammatory bowel diseases: association with disease dynamics and implication on exposure response analysis
Ruo-Jing Li1, Chao Liu1, Yaning Wang1
1Division of Pharmacometrics, Office of Clinical Pharmacology, US Food and Drug Administration, Silver Springs, MD, USA;
Background and Objectives: Time-varying clearance was identified at multiple therapeutic monoclonal antibodies in oncology, where the clearance decreased with improving disease status after treatment. However, such association has not been explored for chronic inflammatory diseases including inflammatory bowel diseases (IBD). The objectives are to investigate the potential impact of disease dynamics on the pharmacokinetics (PK) of therapeutic monoclonal antibodies in IBD, and to evaluate the implications on the exposure response (E-R) analysis.
Methods: Drug X was employed as a case to explore the time-varying clearance in IBD. Data were pooled from three clinical studies, including a total of 1227 patients following various dosing regimens of Drug X. The population PK was estimated using a non-linear mixed effects modeling approach. The effects of disease dynamics and other longitudinal biomarkers on PK were explored. Simulation was performed to evaluate the impact of the disease-PK interaction on exposure response analysis.
Results: PK of Drug X was best described using a 2-compartment model with first-order absorption and elimination. A time-varying clearance was identified and the change in clearance over time is associated with the post-treatment effects: decrease in clearance was associated with decreased partial Mayo score, decreased CRP, increased albumin and decreased neutrophil counts. This interaction between post-treatment effects and drug exposure may lead a biased steep estimate of E-R relationship for efficacy with the traditional method.
Conclusions: Similar to oncology, the clearance of therapeutic monoclonal antibody in IBD may also change over time. This time-varying clearance is associated with disease dynamics, which may confound the E-R analysis if it was not adjusted appropriately.
W-019
Mechanistic modeling of receptor pharmacology of NKTR-214, a new kinetically-controlled CD122 agonist for cancer immunotherapy
Samira Khalili1, Aleksandrs Odinecs1, Deborah H. Charych1, Vidula Dixit1, Peter Kirk2, Thomas Chang1, John Langowski3, Werner Rubas1, Steve Doberstein1, Jonathan Zalevsky1, Mike Eldon1, Ute Hoch1
Nektar Therapeutics, San Francisco, CA; 2Immnocore, Oxfordshire, UK; 3Kite Pharma, Emeryville, CA.
Objectives: NKTR-214 is a clinical-stage biologic that comprises interleukin-2 (IL2) protein bound by multiple releasable polyethylene glycol (PEG) chains. The key goal was to use mechanistic modeling to understand and quantify the receptor bias of NKTR-214 towards the IL2Rβγ (predominant on CD8 T cells) over IL2Rαβγ (constitutively expressed on regulatory T cells) and compare it with aldeslukin (IL2) based on preclinical data. The results in this abstract have been previously presented in part at AACR, Washington DC 2017 and published in the conference proceedings as abstract #1617.
Methods: An ODE model was developed to mechanistically describe the dynamics of NKTR-214 kinetic processes and IL2 receptor occupancy. The mathematical model incorporated release of PEG chains, clearance from plasma, and binding to the IL2 receptors. Parameter estimation was done based on available PK data, receptor binding kinetics, and literature values.
Results: Model simulation reveals that after a single dose of NKTR-214, the total occupancy AUC at IL2Rβγ is ~ 5.9-fold higher than the total occupancy AUC at IL2Rαβγ. Additionally, simulation of therapeutic doses of NKTR-214 (0.8 mg/kg) and aldesleukin (0.8 mg/kg, 5 daily doses for 2 cycles) showed that occupancy AUC from aldesleukin at IL2Rβγ reached only half of NKTR-214 while occupancy AUC at IL2Rαβγ was 19 times higher than NKTR-214.
Conclusions: Mechanistic modeling based on in vitro and in vivo kinetic data provides insight into the mechanism of NKTR-214 pharmacology. It shows how combination of sustained exposure and receptor bias, both of which are built into the molecular design of NKTR-214 provides biased receptor dynamics that favor interaction with IL2Rβγ, with ultimate activation of CD8 and NK cells in the tumor. Simulations also show this is an inherent feature of NKTR-214 that promotes its favorable biological and therapeutic effects in murine tumor models and not readily achivebale by any dosing of aldeslukin.
W-020
Pharmacokinetic-pharmacodynamic model of topiramate-induced working memory impairment in healthy volunteers
Samuel P Callisto1, Angela K Birnbaum1, Christopher M Barkley1, Sai Praneeth Bathena1, Susan E Marino1
1: Center for Clinical and Cognitive Neuropharmacology, University of Minnesota, Minneapolis, MN
Objectives: Topiramate is an anti-seizure drug that can cause cognitive deficits that, in a subset of patients, may be severe enough to cause discontinuation of an otherwise effective therapy. Administration of topiramate impairs working memory (WM) and WM is necessary for tasks that require accessing and manipulating information. A pharmacokinetic-pharmacodynamic model was developed using nonlinear mixed-effects modeling with NONMEM® 7.3 to explore the exposure–response relationship between topiramate concentration and performance on a WM task.
Methods: The model was developed using data from a double-blind, placebo-controlled, parallel-group crossover study conducted with healthy volunteers receiving 100, 150, or 200 mg of topiramate (n = 29). The outcome of interest was accuracy on a modified Sternberg WM task: subjects were shown a pronounceable non-word string of one, three, or five syllables (“memory loads”), then shown a second string of syllables after a five-second delay and asked whether the strings matched. A population pharmacokinetic model was developed to characterize topiramate pharmacokinetics. A sequential modeling approach with direct linear, exponential, and Emax models was used to explore drug effect. Covariates such as age, education, and WM capacity (WMC) for each load were tested using forward selection and backward elimination. Model adequacy was determined using goodness-of-fit plots, change in objective function value, AIC/BIC, and VPC.
Results: A linear model best described the relationship between topiramate concentration and task performance. Accuracy decreased by 3.63% for each μg/mL topiramate plasma concentration for all memory loads. The sequence of treatment did not affect performance. WMC was a significant covariate for both placebo effect and overall WM task accuracy.
Conclusions: Estimated WMC predicted task performance, modulating both placebo effect and accuracy. The model showed that patients’ WM function was impaired in a concentration-dependent manner after administration of clinically-relevant doses of topiramate.
W-021
Population pharmacokinetic analysis of pregabalin in patients with epilepsy
Sang Won Lee1, Su-jin Rhee1, Jaeseong Oh1, Jae-Yong Chung2, Kyung-Sang Yu1, In-Jin Jang1
1Department of Clinical Pharmacology and Therapeutics, Seoul National University College of Medicine and Hospital, Seoul, Republic of Korea; 2Seoul National University College of Medicine and Bundang Hospital, Seongnam, Republic of Korea.
Objectives: Pregabalin, a chemical analogue of the mammalian neurotransmitter γ-aminobutyric acid (GABA), is an efficacious therapeutic option to treat partial seizures, generalized anxiety disorder and chronic pain disorders. The aim of this study was to develop a population pharmacokinetics (PKs) model for pregabalin in patients with epilepsy.
Methods: A total of 756 plasma pregabalin concentration from a phase 1 clinical PK study involving serial sample collection following a multiple oral administration of pregabalin in healthy subjects (n = 42) were used to develop a base population PK model using the nonlinear mixed-effects method in NONMEM (ver. 7.4). Then, a total of 195 plasma pregabalin concentration from patients with epilepsy (n = 159) were pooled to estimate the apparent clearance (CL/F) and central volume (V2) of pregabalin by implementing the base population PK model. During this process, we fixed the population PK parameters estimated from the healthy subjects except for CL/F and V2. All plasma pregabalin concentration data were logarithmically-transformed during the analysis.
Results: A two-compartment PK model with first-order absorption with lag time and first-order elimination adequately described the PKs of pregabalin in healthy subjects and patients with epilepsy. The typical estimates of CL/F and V2 in epilepsy patients were 4.2 L/h and 74.3 L with inter-individual variability (CV %) of 22.3% and 121.5%, respectively. Effects of body weight on V2 and effects of estimated glomerular filtration rate on CL/F were statistically significant. Model evaluation by visual predictive check suggested that the proposed model was adequate and robust with good precision.
Conclusions: The population PK model for pregabalin can be utilized to develop and improve the dosing regimen in patients with epilepsy.
W-022
PK/PD modeling of spectinamide 1599 in Mycobacterium tuberculosis infected mice
S. Wagh1, C. Rathi1, P. B. Lukka1, K. Parmar1, Z. Temrikar1, J. Liu2, M.S. Scherman3, R.E. Lee2, G.T. Robertson3, A.J. Lenaerts3, B. Meibohm1
1The University of Tennessee Health Science Center, 2St. Jude Children’s Research Hospital, 3Colorado State University
Objectives: The purpose of the study was to characterize the exposure–response relationship of spectinamide 1599 based on a dose fractionation study conducted in a mouse model of M.tb. infection.
Methods: Multiple dose PK and PK/PD studies were conducted in healthy (3 dosing regimens) as well as M.tb. infected (23 dosing regimens) BALB/c mice. In 54 healthy animals, serial blood samples were collected over 6 time points, whereas only two blood samples were collected at 0.25 h and 8 h post-dose in 141 infected animals. A nonlinear mixed-effects PK/PD modeling strategy was implemented as outlined in Fig 1. A bacterial growth model of M.tb. with two subpopulations was built based on colony forming unit (CFU) data from infected untreated mice. Subsequently, CFU in lung specimens obtained from infected animals after 4 weeks of therapy were linked to 1599 concentration–time profiles via a sigmoid Emax-model that modulates the kill rate in the bacterial growth model.
Results: A two-compartment model with first-order absorption and linear elimination adequately described the plasma concentration–time profile of 1599. The model estimated population mean values of clearance and volume of distribution of the central and peripheral compartment were 0.44 L/h/kg, 0.075 L/kg, and 0.32 L/kg, respectively, with no significant difference between healthy and infected animals. The drug effect parameter EC50 describing the potency of the drug, maximum drug-induced kill rate constant Emax, and Hill coefficient γ were estimated as 52.2 µg/ml, 0.5 h1− and 0.34, respectively. Higher doses with lower dosing frequencies resulted in better bacterial kill, suggestion concentration- rather than time-dependent bacterial killing.
Conclusions: Application of PK/PD modeling in early preclinical development allowed to characterize the well-defined relationship between exposure and response for spectinamide 1599. This information serves as the basis for the design of dosing strategies for further efficacy studies.

W-023
A quantitative comparison approach for methylphenidate drug regimens in ADHD treatment
Sara Soufsaf, B.Sc.1, Guillaume Bonnefois, Ph.D.2, Philippe Robaey,M.D., Ph.D.3, Fahima Nekka, Ph.D.1, Jun Li, Ph.D.1
Université de Montréal, Montréal, Québec, Canada 2 Syneos Health, Montréal, Québec, Canada 3University of Ottawa, Ottawa, Ontario, Canada
Objective: Different methylphenidate (MPH) formulations, immediate release (IR) or extended release (ER), have been developped to treat Attention Deficit/Hyperactivity Disorder (ADHD). To attain optimal therapeutic effect while respecting patients’ quality of life, a proper choice of their timing, dosage and even combination, is determinant. For effectively discerning MPH drug regimens, a quantitive comparison approach is to be developed and applied to different clinical situations.
Methods: Using population pharmacokinetic models of various MPH formulations developped with data in hand, we developed a quantitative integral strategy for regimen comparison, which comprises a sequential, a relative and a probability-over-threshold method. The first method is hierarchical in nature and sequentially compares the regimen performance, the total daily dose and the administration frequency. The second compares regimens’ performance by quantifying their similarity. The third computes the probabliy of an incremental regimen performance over a specified threshold.
Results: In the context of two frequent MPH clinical situations, namely for treatment-naïve patients and those previously treated, different regimens for IR, ER or their combinations were tested with the proposed methods. For naïve patients, the combined use of two first methods is proved adquately capable to compare MPH regimens. For patients under treatment, the third gives a better discernment between the regimens. Moreover, a combined regimen of IR and ER is identified to largely outperform the most frequent ER regimen (Concerta), by 66.0% in terms of their performance score of efficacy [1].
Conclusion: Since our comparison strategy does not compare fixed doses and formulations but rather any MPH regimen, it provides a computational tool based on M&S to objectively optimize drug use for patients.
References
-
1.
Bonnefois, G., Robaey, P., Barrière, O., Li & J Nekka, F. An evaluation approach for the performance of dosing regimen in ADHD treatment. Submitted to Journal of Child and Adolescent Psychopharmacology.
W-024
Population pharmacokinetic-pharmacodynamic (PK-PD) modeling of chemotherapy-induced neutropenia (CIN) in patients treated with CPX-351
Sarah F. Cook,1 Qi Wang,2 Donald E. Mager,1 Scott A. Van Wart1
1Enhanced Pharmacodynamics, LLC, Buffalo, NY, USA; 2Jazz Pharmaceuticals, Inc., Palo Alto, CA, USA.
Objectives: CPX-351, a dual-drug liposomal encapsulation of cytarabine and daunorubicin at a synergistic ratio, was approved by the US FDA in 2017 for the treatment of adults with newly diagnosed therapy-related acute myeloid leukemia (AML) and AML with myelodysplasia-related changes. We developed a population PK-PD model of CIN following CPX-351 administration that incorporates the effect of concurrent granulocyte colony-stimulating factor (GCSF) therapy.
Methods: Data from three phase 1–3 studies in adults with AML or acute lymphocytic leukemia (N = 129), one-third of whom received GCSF therapy, were modeled in NONMEM 7.3. Individual patient-predicted PK profiles were obtained by applying previously developed PK models for CPX-351–derived cytarabine and daunorubicin. Neutrophil dynamics were described by a transit compartment model with proliferating, maturating, and circulating neutrophils (Figure). Proliferation was inhibited by a composite PK driver (cytarabine plus daunorubicin) via an Imax function. Proliferation and maturation were stimulated by exogenous GCSF, complexed with receptors on circulating neutrophils, via a receptor-binding model. Stepwise covariate testing was performed to assess whether patient demographics, clinical laboratory measures, or disease-related indices could explain interindividual variability (IIV) in CIN.
Results: Population estimates (IIV as % CV) were 3.55 × 10⁹ cells/L (85.6) for initial circulating neutrophils, 113 h (32.7) for neutrophil mean transit time (MTT), 0.0794 (66.9) for the γT feedback parameter, and 24.9 µM (149.3) for composite IC50. Imax was estimated to be 1.05 and subsequently fixed at 1. There was a strong inverse correlation between MTT and absolute neutrophil count (P < 0.00001). Incorporation of the stimulatory effect of exogenous GCSF on proliferation and maturation significantly improved the model fit (P < 0.00001).
Conclusions: A population PK-PD model that accounts for the influence of GCSF therapy on neutrophil dynamics was developed, which provides a more accurate characterization of CPX-351–induced myelosuppression potency and time for return of the absolute neutrophil count to baseline.

W-025
Population pharmacokinetic-pharmacodynamic (PK-PD) modeling of CPX-351–induced thrombocytopenia
Sarah F. Cook,1 Qi Wang,2 Donald E. Mager,1 Scott A. Van Wart1
1Enhanced Pharmacodynamics, LLC, Buffalo, NY, USA; 2Jazz Pharmaceuticals, Inc., Palo Alto, CA, USA.
Objective: CPX-351, a dual-drug liposomal encapsulation of cytarabine and daunorubicin at a synergistic ratio, was approved by the US FDA in 2017 for the treatment of adults with newly diagnosed therapy-related acute myeloid leukemia (AML) and AML with myelodysplasia-related changes. We developed a population PK-PD model of CPX-351–induced thrombocytopenia following CPX-351 administration.
Methods: Data from three phase 1–3 studies in adults with AML (n = 133), acute lymphocytic leukemia (n = 3), or myelodysplastic syndrome (n = 1) were modeled in NONMEM 7.3. Individual patient-predicted PK profiles were obtained by applying previously developed population models for CPX-351–derived cytarabine and daunorubicin. Platelet dynamics were described by a transit compartment model with proliferating, maturating, and circulating platelets (Figure). Proliferation was inhibited by a molar composite PK driver (cytarabine plus daunorubicin) via a sigmoidal Imax function. Since the amounts of platelets transfused were unknown, transfusions were incorporated as bolus inputs of 35 × 109 cells/L into the circulating platelet compartment. Stepwise covariate testing was performed to assess whether patient demographics, clinical laboratory measures, or disease-related indices could explain interindividual variability (IIV) in PD parameters.
Results: Population estimates (IIV as %CV) were 98.1 × 10⁹ cells/L (55.0) for initial circulating platelets, 91.2 h (18.1) for platelet mean transit time, 0.178 (61.9) for the γT feedback parameter, 0.316 for Imax, 0.324 µM (313) for composite IC50, and 1.29 for the Hill coefficient. Interoccasion variability in IC50 was 223% CV. Most patients (98.5%) received ≥ 1 platelet transfusion (mean [SD] number of transfusions/person was 12 [9]), and the model fit improved significantly (P < 0.00001) when bolus inputs to circulating platelets were incorporated to account for these transfusions.
Conclusions: A population PK-PD model that accounts for intermittent platelet transfusions as a confounding factor was developed to provide a more accurate characterization of CPX-351–induced thrombocytopenia and the time for platelets to return to baseline.

W-026
A model and systems based approach to assess impact of potential pharmacokinetic differences on pharmacodynamics and questions regarding generic substitution – A case study on metoprolol extended-release tablets
Sarah Kim1†, Vishnu D Sharma1†, Karthik Lingineni1, Nashid Farhan1, Lanyan (Lucy) Fang2, Liang Zhao2, Joshua D. Brown3, Rodrigo Cristofoletti1,4, Valvanera Vozmediano1, Sihem Ait-Oudhia1, Lawrence J. Lesko1, Mirjam N. Trame1*†, Stephan Schmidt1*†
1Center for Pharmacometrics and Systems Pharmacology, Department of Pharmaceutics, College of Pharmacy, University of Florida, Orlando, FL, USA 2Office of Research and Standards, Office of Generic Drugs, Center for Drug Evaluation and Research, Food and Drug Administration, Silver Spring, MD, USA 3Department of Pharmaceutical Outcomes and Policy, College of Pharmacy, University of Florida, Gainesville, FL, USA 4Division of Therapeutic Equivalence, Brazilian Health Regulatory Agency (Anvisa), Brasilia, Brazil
†Contributed equally to this work *Corresponding authors
Objectives: The objective of this research was to evaluate the impact of drug release changes from metoprolol extended-release (ER) tablets on in vitro dissolution, in vivo pharmacokinetic (PK), and exercise-induced heart rate (EHR) using a combined physiologically-based absorption pharmacokinetic (PBA-PK) and population pharmacokinetic/pharmacodynamic (PopPK/PD) approach.
Methods: We simulated dissolution and concentration–time profiles after a 20, 40, and 60% increase in the drug release rate constant via a PBA-PK model, previously developed in DDDPlus™ and GastroPlus™, for 50 and 200 mg. Similarity of the dissolution profiles was assessed using F2 test, and PK bioequivalence was tested according to FDA’s guidance1. These concentration–time profiles served as PK input into a PopPK/PD model, newly developed based on literature data in NONMEM®. PD assessment was based on the percentage reduction in EHR from baseline (150 beats/minute). Therapeutic equivalence was declared when the model predicted EHR was within 50 to 85% (95–161.5 beats/minute) of the average maximum EHR (190 beats/minute) of healthy 30-year-old people.
Results: A 40 or more percent increase in drug release resulted in dissimilarity in dissolution profiles and bioinequivalence in PK for both 50 and 200 mg. These differences in PK were also translated into statistically significant differences in the area under the effect curve of the EHR profiles. However, all of the EHR-time profiles were within the 50–85% EHR range.
Conclusions: A more than 40% difference in drug release may lead to significant differences in dissolution and PK of metoprolol ER products. Our results further suggest that EHR may not be sensitive enough to assess therapeutic inequivalence of metoprolol ER products. Future studies will explore the use of heart rate variability as the PD biomarker instead.
Reference
-
1.
Food and Drug Administration. Guidance for Industry: Statistical Approaches to Establishing Bioequivalence (2001)
W-027
Role of interleukin-6 (IL-6) in platelet production: extension of a quantitative systems pharmacology model (QSPM) to describe anti-IL-6 and anti-IL-6 receptor therapies
Sarita Koride1, Satyaprakash Nayak2, Christopher Banfield1 and Mark C. Peterson2
1Early Clinical Development, Clinical Pharmacology, Pfizer, Cambridge, MA 2Global Pharmacometrics, Pfizer, Cambridge, MA
Objective: To extend a QSPM, previously developed for evaluating effects of Janus Kinase (JAK) inhibition on platelets, to include effects of IL-6 on platelet (PLT) production using data from anti-IL-6 and anti-IL-6 receptor (IL-6R) therapies.
Methods: The base QSP model consisted of 12 ODEs and 31 parameters describing platelet formation including involvement of hematopoietic stem cells (HSC), megakaryoblasts (MBs), megakaryocytes (MKs), effects of Thrombopoietin (TPO), IL-6 and its effect on TPO production via JAK pathways. Extension evaluates changes in platelets due to IL-6 modulation in the presence of anti-IL-6/IL-6R monoclonal antibodies (mAbs). The PK models developed included binding terms for IL-6/IL-6R/IL-6-IL-6R-complex and clearance. Platelet levels and pharmacokinetic (PK) data/models from Phase III clinical trials with Tocilizumab (anti-IL-6R), Sarilumab (anti-IL-6R) and Sirukumab (anti-IL-6) [1–3] were used to train the model which was implemented in MATLAB (R2016a, Simbiology v5.4).
Results: The model retained its previous ability to describe JAK inhibition on platelets and now adequately describes the observed PK and longitudinal time course effects of IL6 inhibition. The observed longitudinal percentage decrease from baseline in PLTs in response to anti-IL6 therapies had a nadir between 25.8–38.2% around week 4 of dosing and generally remained stable at this level beyond week 4.
Conclusion: A model previously developed to explore the effects of JAK inhibitors on PLT homeostasis has been extended to include mechanistic effects of anti-IL-6 therapies on platelet homeostasis. Future work will include incorporating the interaction between IL-6 and other cell types and cytokines important in disease.

Figure: Model Schematic
References
-
1.
Takeuchi et al., Sirukumab for RA: the phase III SIRROUND-D study, 2017, https://doi.org/10.1136/annrheumdis-2017-211328.
-
2.
Gibiansky and Frey, Linking interleukin-6 receptor blockade with tocilizumab and its hematological effects using a modeling approach, 2012, https://doi.org/10.1007/s10928-011-9227-z.
-
3.
Center for Drug Evaluation and Research: 761036Orig1s000
W-028
Zonal extracellular matrix (ECM) accumulation in nonalcoholic steatohepatitis (NASH) characterized by a mathematical model of fibrosis
Grant T. Generaux1, Diane M. Longo1, Paul B. Watkins1,2,3, Brett A. Howell1, and Scott Q. Siler1
1DILIsym Services, Inc., 6 Davis Drive, P.O. Box 12317, Research Triangle Park, NC 27709 2UNC Eshelman School of Pharmacy, University of North Carolina at Chapel Hill, 301 Pharmacy Lane, CB #7569 Kerr Hall, Chapel Hill, NC 27599 3UNC Institute for Drug Safety Sciences, University of North Carolina at Chapel Hill, 6 Davis Drive, Research Triangle Park, NC 27709
Objectives: Hepatic fibrosis in NASH is caused by excessive accumulation of extracellular matrix (ECM) proteins. Fibrosis progresses over time due to an increased number of activated hepatic stellate cells (HSCs) and subsequently increased production of hepatic ECM proteins. Fibrosis in NASH is histologically described by the accumulation of ECM in different hepatic acinar zones, with stage I fibrosis occurring in zone 3, stage II fibrosis expanding to zone 1, and stage III fibrosis bridging zones 1 and 3. This zonal pattern of ECM accumulation has not been captured in mathematical models of NASH fibrosis to date.
Methods: A mathematical model was developed as a submodel within the NAFLDsym QSP model to represent dynamics of ECM turnover as well as zonal accumulation of ECM proteins during the development of fibrosis in NASH. The model consists of ordinary differential equations (ODEs) to describe the following processes in three discrete acinar zones of the liver: activated-HSC driven ECM production, MMP/TIMP modulation of collagen degradation, and collagen crosslinking by lysyl oxidase.
Results: The mathematical model simulates the zonal accumulation of ECM proteins during progression of fibrosis. Extracellular matrix proteins increase approximately linearly in Stages I and II, with little increase in ECM content associated with Stage III bridging. ECM content in Stage IV fibrosis is dramatically increased over Stages I–III.
Conclusions: A mathematical model which accurately represents the zonal pattern involved in ECM accumulation shows simulation results which are consistent with non-linear increases in ECM content observed across fibrosis stages in NASH patients. A mechanistic mathematical model that is able to capture the non-linear increase in ECM accumulation which occurs during NASH disease progression could serve as a useful tool to help guide development of therapeutics aimed at treating NASH.
W-029
Combining machine learning and mechanistic modeling approaches to solve real life problems – assessment of the local tissue binding and its influence on the systemic exposure after topical application of drugs
Sebastian Polak1,2, Aleksander Mendyk2, and Nikunjkumar Patel1
1Certara UK Ltd, Simcyp Division, Sheffield, UK; 2Faculty of Pharmacy, 2Jagiellonian University Medical College, Poland
Objectives: Assuming that predominantly unbound molecule can diffuse through the skin, and that the experimental measurement of this parameter is not routinely done, its prediction becomes crucial. In the current study we applied machine learning approach to develop empirical model for the prediction of stratum corneum binding from chemical structure. In the next step we utilized the predicted values in the dermally applied model drug (ketoprofen) in mechanistic PBPK model (Simcyp MPML MechDermA model).
Methods: Binding coefficients to different keratins, namely, bovine hoof and horn, human delipidized callus, human delipidized stratum corneum (SC), human nail, human hair, and sheep wool collected by Hansen and colleagues from the literature, were utilized for the modeling purposes [1]. The modelled endpoint was Nernst binding coefficient KNernst (log KNernst). The model was developed using data-driven approach based on the gathered data set and bioinspired heuristic algorithm so-called genetic programming (GP), based on simple physico-chemical parameters (logP, HBA). For calculations we used R statistical environment [2] with GP implementation in rgp module [3, 4]. The model quality was assessed with the use of root mean squared error (RMSE) and normalized RMSE (NRMSE). The predicted fusc value for ketoprofen (0.093) was further applied to the MPML MechDermA model, and compared with the predictions for fusc = 1. The predicted systemic exposure values from both simulation settings were compared against clinical data.
Results: The best obtained model had RMSE = 0.92 and NRMSE = 13.31%.
-
fusc = 1 − (EXP(logKNernst)/(1 + EXP(logKNernst))
where logKNernst = (ln(HBA + 4.824))^(ln(abs(logP)))
The compared pharmacokinetic parameters for two simulated virtual scenarios were significantly different, and addition of the stratum corneum binding allowed for mimicking the clinically observed results in the simulation.
Conclusions: Combination of machine learning algorithms and mechanistic, PBPK based models allows to improve performance of the latter, and solve real life problems.

Fig. 1 Observed and Predicted logKNernst values
References
-
1.
Hansen S, JPharmSci. 2011;100(5):1712–26.
- 2.
-
3.
Flasch O. 2014; https://CRAN.R-project.org/package=rgp
-
4.
Pacławski A. http://sourceforge.net/projects/rscriptsmultivariate/files/rgp/.
W-030
Quantitative systems pharmacology model to quantify benefits of DAO inhibition in schizophrenia
Sergio Iadevaia1, Christina Friedrich3, Meghan Pryor3, Colleen Witt3, Liming Zhang2, Lin Xu2, Helene Faessel2, Katherine Kudrycki3, Mike Reed3 and Majid Vakijynejad1
1Quantitative Solutions, Takeda Pharmaceuticals, Cambridge, MA 2Quantitative Clinical Pharmacology, Takeda Pharmaceuticals, Cambridge, MA 3Rosa & Co., LLC, San Carlos, CA
Objectives: Evidence indicates that hypofunctioning of the N-methyl-D-aspartate receptor (NMDAR) in the brain and a reduction in its primary co-agonist, d-serine, may contribute to the pathophysiology of schizophrenia. D-amino acid oxidase (DAO) inhibition results in increased d-serine and may lead to improvement in negative symptoms. A mechanistic model of DAO inhibition, d-serine increase and increased NMDAR signaling, combined with an empirical relationship to the relevant clinical outcomes, such as positive and negative syndrome scale and eye blinking conditioning, is expected to enable a quantitative assessment of clinical benefits of novel therapeutics.
Methods: Takeda and Rosa developed a Schizophrenia PhysioPD™ Platform representing a cerebellar tri-partite synapse, the primary site of DAO inhibition in the brain, plus plasma and cerebro-spinal fluid (CSF) compartments. The model connects systemic dosing of DAO inhibitors to d-serine increase to NMDAR signaling to clinical outcomes. In vitro, animal and human data were used to construct the model, while clinical data from trials with sodium benzoate (a moderate DAO inhibitor) and d-serine administration were used to ensure consistency of whole-system behavior.
Results: Model development has produced insights and clarifications. Expression of enzymes and transporters that govern d-serine is highly variable across brain regions, so care must be taken to use only data for cerebellum, the primary site of action. d-serine transport from the site of DAO inhibition inside the astrocyte into the synaptic cleft warrants mechanistic detail, including modeling of the complex dynamics of the alanine-serine-cysteine transporter 2 (ASCT2) antiporter. α,β-elimination of d-serine via serine racemase may occur at high d-serine concentrations and is included in the model. NMDAR subunit expression and associated d-serine potency differences were examined.
Conclusions: Mechanistic modeling clarifies and quantifies biological mechanisms involved in DAO inhibition and is expected to reduce risks associated with clinical development of DAO-inhibiting agents.
W-031
Mathematical modeling identifies optimum lapatinib dosing schedules for the treatment of glioblastoma patients
Shayna Stein1,2,3,4, Rui Zhao1,2, Hiroshi Haeno5, Igor Vivanco6, Franziska Michor1,2,3,4,7
1Department of Biostatistics, Harvard TH Chan School of Public Health, Boston, MA, USA, 2Department of Biostatistics and Computational Biology, Dana Farber Cancer Institute, Boston, MA, USA 3Department of Stem Cell and Regenerative Biology, Harvard University, Cambridge, MA, USA 4The Broad Institute of Harvard and MIT, Cambridge, MA, USA 5Department of Biology, Kyushu University, Fukuoka, Japan 6Division of Cancer Therapeutics, The Institute of Cancer Research, London, United Kingdom 7Center for Cancer Evolution, Dana Farber Cancer Institute, Boston, MA, USA
Objectives: Human primary glioblastomas (GBM) often harbor mutations within the epidermal growth factor receptor (EGFR). Treatment of EGFR-mutant GBM cell lines with the EGFR/HER2 tyrosine kinase inhibitor lapatinib can effectively induce cell death in these models. However, EGFR inhibitors have shown little efficacy in the clinic, partly because of inappropriate dosing. Here we use a computational modeling approach that incorporates both toxicity and PK/PD data to investigate whether alternative dosing strategies can be applied to circumvent the toxicity limit while exceeding the level of efficacy observed in continuous dosing.
Methods: EGFR-mutant cell line SF268 was used to model response to different lapatinib concentrations and dosing schedules. Phase I clinical studies of GBM patients treated with lapatinib were used to identify treatment strategies within the clinical toxicity limits of lapatinib. A partial differential equation modeling approach was used to study the in vivo GBM treatment response.
Results: Lapatinib was not found to be able to induce tumor regressions with a continuous daily schedule. However, our modeling approach consistently predicts that continuous dosing remains the best clinically feasible strategy for slowing down tumor growth and lowering overall tumor burden, compared to pulse dosing schedules currently known to be tolerated, even when considering drug resistance, reduced lapatinib tumor concentrations due to the blood brain barrier, and the phenotypic switch from proliferative to migratory cell phenotypes that occurs in hypoxic microenvironments.
Conclusions: Our mathematical modeling and statistical analysis platform provides a rational method for comparing treatment schedules in search for optimal dosing strategies for glioblastoma and other cancer types. Although we found that none of the tolerable doses and schedules evaluated were found capable of arresting tumor expansion, our approach predicts that continuous treatment within these parameters is likely to be more successful at slowing down tumor growth.
W-032
Assessing influence of chromatin in decoding NFkappaB signals
Shibin Mathew1,2, Victor Wong3,4, Kathryn-Miller Jensen3,4, Suzanne Gaudet1,2
1. Cancer Biology, Dana-Farber Cancer Institute 2. Genetics, Harvard Medical School 3. Biomedical Engineering, Yale University 4. Molecular, Cellular & Developmental Biology, Yale University
Objectives: The transcription factor, NFkappaB, is an important regulator of immune cell’s responses to inflammatory stimuli [1]. Single-cell measurements of NFkappaB nuclear translocation and mRNA expression has revealed the role of signaling dynamics in controlling distinct cytokine expression patterns [2,3]. We recently discovered that the interactions between NFkappaB and chromatin produce another layer of regulation which also impacts how dynamic signals are decoded [4]. For example, in our system of latent HIV LTR promoters (with kappaB binding sites), the nature of chromatin states drives divergent viral activation profiles. These observations prompted us to ask the question, Is there a general network connection to explain NFkappaB dependent gene expression variability?
Methods: We started with a mechanistic model of RelA (NFkappaB subunit) dynamics describing its cytoplasmic sequestration and nuclear translocation. We also modeled RelA binding to different kappaB sites on the chromatin with different affinities, including competition from protein complexes with other NFkappaB subunits. This model was then calibrated to measurements of nuclear RelA and transcriptional dynamics in Jurkat T lymphocyte clones. Using parameter distributions and their biological underpinnings, we introduced network connections to recapitulate experimental observations not captured with a simpler model.
Results and Conclusions: Our modeling results indicate how the chromatin environment near a target promoter puts a check on information transmission from an input NFkappaB activation to output RNA transcription. Because it is anchored in quantitative experimental data, the logical underpinnings from this work will enable us to quantitatively explain divergent HIV reactivation phenotypes as well as divergent transcriptional responses among endogenous NFkappaB targets.
References
-
1.
Hoffmann, A. et al. (2006) Immunol Rev, 210, pp. 171–186.
-
2.
Lane, K. et al. (2017) Cell Sys, 4(4), pp. 458–469.
-
3.
Kobayashi, T et al. (2009) Sci Sig, 2(81), p. 47.
-
4.
Wong, V. et al. (2018) Cell Rep 22(3), pp 585–599.
W-033
Network-based analysis of tumor-immune cross talk to decipher the mechanism of immune evasion in muscle invasive bladder cancer (MIBC)
Shruti Shah1, Dr. Barbara Foster1 & Dr. Donald Mager2
1Experimental Therapeutics Dept., Roswell Park Cancer Institute, UB 2Department of Pharmaceutical Sciences, University at Buffalo, SUNY
Objectives: To develop a Boolean logic-based network model that captures the tumor–immune cross talk in the microenvironment of muscle invasive bladder cancer (MIBC). The goal is to apply a Boolean model to predict changes in the immune microenvironment with treatment.
Methods: MIBC tumors were divided into “inflamed” and “non-inflamed” sub-types based on the cytokine gene expression profile of the tumors from TCGA (The Cancer Genome Atlas). The expression profile from TCGA was used to build the tumor network. A de-convolution algorithm, CIBERSORT, was applied to identify the immune cell signature of the tumors. Next, the tumor expression network was linked to an immune dynamic regulatory network using published literature. The Boolean model was constructed, and dynamic profiles of the tumor-immune network model were simulated using Odefy. Lastly, an attractor analysis was performed using BoolNet to predict the immune cell phenotype in the presence of different tumor cytokine profiles.
Results: The “non-inflamed” sub-type of MIBC tumors was associated with low CD8+T-cells and high non-polarized macrophages. The Boolean network of macrophage polarization reasonably captured the polarization signature in the presence of M1 and M2 polarizing conditions. Changes in the cytokine profile of the tumor network provided a spectrum of different macrophage polarization phenotypes beyond the traditionally labeled M1 and M2 macrophages.
Conclusions: Our network analysis suggests that macrophages are associated with a non-inflamed tumor sub-type, which also suggests that they may be involved in the mechanism of immune evasion by MIBC. The spectrum of different macrophages captures the complex profile of tumor-associated macrophages. The dynamic cytokine profile under different perturbed conditions may allow for the prediction of tumor immune phenotypes of in response to therapy and thus generate hypotheses on acquired or inherent resistance to immunotherapy.
W-034
Extension of the distributed delay approach to model delayed outcomes involving loss mechanism during the delay process
Shuhua Hu
Certara
Objectives: The distributed delay approach provides an alternative way to model delayed outcomes in PKPD studies that does not suffer the disavantages of the traditional transit-compartment-model (TCM) approach, and it involves convolution of the signal to be delayed (S) and the probability density function (PDF) (g) of the delay time, \( {\mathcal{S}}\left( t \right) = \mathop \smallint \limits_{0}^{ + \infty } g\left( \tau \right)S\left( {t - \tau } \right)d\tau \) [1]. Even though this approach is general enough to incorporate a variety of PK/PD models as special cases, it cannot be applied to the case where the involved mediators (e.g., cells, drug molecules) may be lost during the delay process due to degration and/or emigration. The goal is to demonstrate how to extend the distributed approach to model delayed outcomes involving loss mechanism during the delay process.
Methods: Assume that the loss of mediators occurs at a first-order rate κ l. Then the number of mediators at τ time ago that survive to time t is given by \( { \exp }\left( { - \kappa_{l} \tau } \right)S\left( {t - \tau } \right) \). Hence, the delayed outcomes is described by \( {\mathcal{S}}_{l} \left( t \right) = \mathop \smallint \limits_{0}^{ + \infty } g\left( \tau \right){ \exp }\left( { - \kappa_{l} \tau } \right)S\left( {t - \tau } \right)d\tau \), which reduces to \( {\mathcal{S}} \) when \( \kappa_{l} = 0 \).
Results: Through assuming some specific distribution form for the delay time, one can show the extended distributed delay approach includes a number of other PK/PD models as special cases. For example, if g is the PDF of an Erlang distribution, then it reduces to extended TCMs with loss rate incorporated, which include the widely used compartmental absorption and transit (CAT) models [2] and the model for describing bone minerization [3] as special cases.
Conclusions: The extended distributed delay approach provides a more general and relistic discription of the delay process, and hence may capture more complex features than the nonextended one.
References
-
1.
Hu et al., J Pharmacokinet Pharmacodyn (2018) 45:285–308.
-
2.
Yu et al., Advanced Drug Delivery Review (1996) 19:359–376.
-
3.
Schaick et al., J Pharmacokinet Pharmacodyn (2015) 42:315–332.
W-035
Practical identifiability analysis and pharmacokinetic sampling optimization for monoclonal antibodies with nonlinear pharmacokinetics in first-in-human studies
Sibo Jiang1, Stephan Schmidt1, Jin Y. Jin2, Rong Deng2
1Center for Pharmacometrics and Systems Pharmacology, University of Florida, Orlando, FL. 2Department of Clinical Pharmacology, Genentech Inc., South San Francisco, CA
Objectives: Characterization of pharmacokinetics (PK) behavior is one of primary objectives in first-in-human (FIH) studies. The purpose of this study is to determine the accuracy and precision of parameter estimation (i.e. practical identifiability) with intensive PK sampling and to explore the feasibility of optimizing PK sampling points in FIH studies for monoclonal antibodies (mAbs) with nonlinear PK.
Methods: Ten mAbs from literature with nonlinear PK described by Michaelis–Menten elimination were generalized based on theoretic combinations of Vmax and Km values. The practical identifiability for a selected group was analyzed by clinical trial simulation and parameter back-estimation. Fifty clinical trials (24 patients and 4 dose levels for each trial) were simulated in RxODE while model fitting of simulated trial data was performed in NONMEM. Once reasonably good parameter identifiability was achieved with intensive sampling, lnD-optimal design was performed using PopED to compute optimal PK sampling points. The robustness of proposed optimal sampling scheme with given Vmax/Km was further externally evaluated using Clenoliximab and MTRX1011A classified into this Vmax/Km group. PK behaviors for MTRX1011A in humans were scaled up from baboons and prospectively used as the model for optimal PK sampling design in FIH studies. Observed human PK parameters were then used to validate the design.
Results: MAbs with nonlinear PK were generalized into seven groups. Optimal sampling scheme (0.5 h, 2, 4, 6, 10, 14, 22, 31 days) demonstrated comparable practical identifiability with intensive sampling scheme for selected mAbs and was validated and successfully applied to Clenoliximab and MTRX1011A (Table 1).
Conclusions: The PK behavior for mAbs with nonlinear PK in FIH studies can be well characterized using the proposed optimal PK sampling scheme. Future work includes application of the optimal design to other mAb groups with different Vmax/Km values.

Reference
Davda JP, et al. MAbs. 2014 Jul-Aug; 6(4):1094–102.
W-036
A pharmacometric extension of MCP-MOD in dose finding studies
Simon Buatois1,2,3, Sebastian Ueckert4, Nicolas Frey2,Sylvie Retout2,3, France Mentré1
(1) IAME, UMR 1137, INSERM, University Paris Diderot, Sorbonne Paris Cité, Paris, France (2) Roche Pharma Research and Early Development, Pharmaceutical Sciences, Roche Innovation Center Basel, F. Hoffmann-La Roche Ltd, Grenzacherstrasse 124, 4070 Basel, Switzerland (3) INSTITUT ROCHE, 30, cours de l’île Seguin, 92650 Boulogne-Billancourt, France (4) Department of Pharmaceutical Biosciences, Uppsala University, Uppsala, Sweden
Objectives: Following the ICH-E4 guidance [1]: “dose-finding should rely on model-based estimation”. In this context, MCP-MOD [2] received an EMA and FDA qualification opinion as an efficient methodology. The MCP step, however, ignores longitudinal information. The objectives of this work, therefore, were to extend MCP-MOD to use longitudinal nonlinear mixed effects models (NLMEM) in both steps, as well as to compare model selection (MS) and model averaging (MA) for the MOD step.
Methods: MCP-MOD extension:
MCP step: Presence of a drug effect is tested using a likelihood-ratio-test (LRT) between the null-model (no dose–response) and the best candidate model. The critical value for the test is derived from simulations of the same selection procedure under the null-hypothesis (corrected-LRT) [3].
MOD step: Either the best candidate model is selected (MS), or a weighted mixture of the candidate models is used (MA).
Evaluation: Clinical trial simulations were used to evaluate the extension concerning the following metrics:
- Maintenance of nominal (5%) type-I error compare to a noncorrected-LRT.
- Power comparison versus standard MCP.
- Coverage probability, defined as the percentage of trial where the confidence-interval contained the true value of interest.
Results: As can be seen from the table, unlike uncorrected LRT, the type I error rate of the corrected-LRT was adequate for both designs. The proposed extension was increasing substantially the power of MCP. Regarding the MOD part, MA was leading to better coverage than MS.
Conclusions: This work extends the MCP-MOD methodology to use NLMEM models throughout the procedure, leading to a substantial increase in power while maintaining pre-specifyability and a nominal type-I error.
Table 1 Drug effect detection power and type-I error comparison using different approaches
Linear | Log-linear | Emax | Sigmoid | No-DE | |
|---|---|---|---|---|---|
Power (%) | Type-I error [3.2–7%] | ||||
LRT | 79.0 | 86.6 | 89.6 | 93.6 | 7.6 |
Corrected-LRT | 71.2 | 81.2 | 83.8 | 90.6 | 5.6 |
MCP | 14.2 | 11.2 | 12.4 | 16.4 | 3.2 |
References
-
1.
J. Cross et al., Pharmacoepidemiol. Drug Saf., vol.11, no. 6, pp. 439–446, Sep. 2002.
-
2.
F. Bretz et al., Biometrics, vol. 61, no. 3, pp. 738–748, Sep. 2005.
-
3.
H. Dette et al., Biometrics, vol. 71, no.4, pp. 996–1008, Dec. 2014
W-037
Sample size for detection of drug effect using item level and total score models for Unified Parkinson’s Disease Rating Scale data
Siv Jönsson (1), Shuying Yang (2), Chao Chen (2), Elodie L. Plan (1), Mats O. Karlsson (1)
(1) Department of Pharmaceutical Biosciences, Uppsala University, Uppsala, Sweden. (2) GlaxoSmithKline, London, UK
Objectives: To estimate the sample size required to reach 80% power for detecting drug effect using item response (IRM) and total score (TSM) models describing longitudinal 44-item UPDRS data in advanced Parkinson’s disease (PD) patients.
Methods: Using NONMEM 7.3, a previously developed longitudinal IRM [1] was re-estimated and a TSM was developed, based on 24-week longitudinal UPDRS recordings from advanced PD patients collected in a randomized study comparing ropinirole (individually titrated doses, 6 to 24 mg/day) to placebo, as adjunct therapy to L-dopa [2]. The Monte-Carlo Mapped Power (MCMP) method [3] was used for power calculation. IRM and TSM were re-estimated without and with drug effect, and the difference in individual objective function value (iΔOFV) was employed in the treatment stratified MCMP (5% significance level [ΔOFV 3.84]).
Results: For IRM, 31,212/33,951 UPDRS records from 190/201 patients treated with placebo/ropinirole were used. Corresponding numbers for TSM were 663/727 records from 189/200 patients. The TSM and IRM agreed, i.e. both having exponential placebo time course and symptomatic drug effect, the latter being statistically significant (p < 0.001, ΔOFV -210 and -37 for IRM and TSM). The sample size required for detecting a drug effect was 54% lower using IRM over TSM, and reduction tended to increase with higher ΔOFV, being 69% at ΔOFV 10.8.
Conclusions: The sample size reduction for drug effect detection for the current data, using IRM vs TSM, confirmed, or even exceeded, earlier reported sample size reductions, varying from 18% to 49%, in investigations where IRM was compared with alternative models in various diseases [4–7].
References
-
1.
Jönsson, PAGE 26 (2017) [www.page-meeting.org/?abstract=7236].
-
2.
Pahwa, Neurology, 2007; 68(14):1108–15.
-
3.
Vong, AAPSJ, 2012;14(2):176–86.
-
4.
Ueckert, Pharm Res, 2014; 31(8):2152–65.
-
5.
Kalezic, PAGE 23 (2014) [www.page-meeting.org/?abstract=3262].
-
6.
Schindler, PAGE 24 (2015) [www.page-meeting.org/?abstract=3468].
-
7.
Buatois, Pharm Res, 2017;34(10):2109–2118.
W-038
A model based approach to establish disease similarity in adults and adolescents with acute schizophrenia
Shamir N. Kalaria, PharmD1, Hao Zhu, PhD2, Mathangi Gopalakrishnan, PhD1, Tiffany R. Farchione, MD3, Mitchell V. Mathis, MD3, Ramana Uppoor, PhD2, Mehul Mehta, PhD2, Islam Younis, PhD2
1Center for Translational Medicine, University of Maryland School of Pharmacy, Baltimore, MD. 2Office of Clinical Pharmacology, Office of Translational Science, Center for Drug Evaluation Research, US Food and Drug Administration, White Oak, MD. 3Division of Psychiatry Product, Office of New Drugs, Center for Drug Evaluation Research, US Food and Drug Administration, White Oak, MD
Objectives: There is an increased in public concern about the enrollment of pediatric patients into placebo-controlled trials, thus leading to recruitment challenges and high dropout rates. Similarity in disease and response to therapy in short term schizophrenia trials is key to extrapolating efficacy from adult to adolescents. The objective of this study is to utilize a quantitative model-based approach to provide evidence of disease similarity in acute schizophrenia to support full extrapolation of efficacy to the adolescent population.
Methods: Subject-level longitudinal positive and negative syndrome scale scores (PANSS) from 8 adults (N = 3843) and 5 adolescent (N = 387) second generation antipsychotic programs evaluating efficacy in patients with acute schizophrenia were collected from NDAs. A disease progression model using placebo data was developed to describe the time course of total PANSS scores in adults. Parametric time-to-event analysis was utilized jointly to describe observed dropout patterns. Various patient characteristics and trial features were explored as potential covariates. The developed and validated joint model was then used to simulate 200 replications of the adolescent data to evaluate disease similarity.
Results: An empirical Weibull model adequately described longitudinal total PANSS in adults, with subjects achieving 63.2% of the maximum placebo effect at 3.4 weeks. Patients with higher baseline scores larger placebo response. A Weibull distribution was also selected for the dropout model with covariates demonstrating that patients with higher baseline total PANSS, patients in US trials, and patients with minimal changes in total PANSS were more likely to drop out. Visual predictive check of simulated adolescent data using the adult model provided evidence of disease similarity.
Conclusion: The use of quantitative disease models provides a novel method for evaluating disease similarity for potential extrapolation of adult data to different populations. Evaluation of exposure–response similarity can be subsequently conducted to support full extrapolation.
W-039
Prediction of the impact of protein engineering on interstitial distribution of mAbs by a newly optimized physiologically based pharmacokinetic model.
Sotaro Naoi, Tatsuhiko Tachibana, Motohiro Kato, Kazuhisa Ozeki, Masaki Ishigai
Research Division, Chugai Pharmaceutical Co., Ltd., Gotemba, Shizuoka, Japan.
Objectives: Interstitial fluid concentration of therapeutic antibodies should be more important parameter to predict local target engagement than plasma concentration when the target molecules are expressed in tissue. We have constructed a new physiologically based pharmacokinetic model by modifying the published model, which can capture the change in FcRn-mediated distribution of pI-engineered antibodies. In the present study, the impact of parameters related to FcRn-mediated transcytosis on interstitial fluid concentration was evaluated by sensitivity analyses using this model for predicting the effect of antibody engineering.
Methods: As the first step, total CL, volume of distribution at steady state, and interstitial fluid to plasma concentration ratio for each tissue were simulated with altered parameters, such as affinity against FcRn and endothelium uptake CL by pI enhancement, under the fixed plasma concentration. As the second step, infusion dose required to achieve the fixed plasma concentration was calculated in each condition. Then, dose-normalized interstitial fluid concentration was compared among these conditions.
Results: Enhanced affinity against FcRn showed few changes in interstitial fluid to plasma concentration ratio in any tissues, while it decreased total CL as expected. On the other hand, enhanced endothelium uptake CL increased interstitial fluid to plasma concentration ratio, but it increased total CL more. Consequently, dose-normalized interstitial concentration was simulated to be low in antibody with enhanced endothelium uptake CL.
Conclusions: Our model suggested that enhanced FcRn affinity is one of the approaches to increase dose-normalized interstitial concentration, but pI-enhancement alone does not work for efficient distribution due to an increment of CL. By using the model in such a way, it is a promising tool for considering the orientation of antibody engineering to achieve efficient distribution at the drug discovery stage. Continuous efforts are to be needed to validate and reconstruct it using observed data.
W-040
Model based approach for accurate vancomycin clearance estimation
Suein Choi1, So Jin Lee2, Soo Hyeon Bae1, Dong-Seok Yim1,2, Seunghoon Han1,2
1Department of Clinical Pharmacology & Therapeutics, Seoul St.Mary’s Hospital, PIPET(Pharmacometrics Institute for Practical Education & Training), College of Medicine, The Catholic University of Korea, 2Q-fitter.Inc.
Objectives: It has been known that two most commonly used equations to estimate GFR are Cockcroft-Gault (CG) and the Modification of Diet in Renal Disease (MDRD). However, studies have shown that both equations have limitation on estimating individual vancomycin clearance. This study was conducted to build the covariate model for vancomycin clearance and to detect the significant covariates.
Methods: For the analysis, vancomycin TDM data of Seoul St. Mary’s hospital was used. Total number of patients was 218 with 137 males and 81 females. Basic PK model was built using NONMEM (version 7.3). FOCE method was used for the model building. We conducted covariate screening process through GAM and visual screening, and covariates which was shown as significant were evaluated through model. Plasma creatinine concentration, body weight, height, age, UREA, CRP and plasma albumin concentration of patients were collected as candidate of covariate. We assumed individual vancomycin clearance data as true value.
Results: A two-compartment first-order elimination PK model was finally chosen as baseline model. In baseline model, vancomycin clearance was estimated to be 2.66 mL/min with 190.2% CV. From the covariate analysis, we derived four patient characteristics which improved the model significantly as covariates to predict vancomycin clearance: plasma creatinine level, body weight, height and age. Plasma creatinine level showed exponentiality to vancomycin clearance while body weight, height and age showed linearity to vancomycin clearance.
Conclusions: This study showed the new unique covariate structure could reflect the individual vancomycin clearance better than the general methods. This study suggests that new method could be needed for estimating accurate individual vancomycin clearance.
Reference
Ducharme MP, Slaughter RL, Edwards DJ. Vancomycin pharmacokinetics in patient population: effect of age, gender, and body weight. Ther Drug Monit 1994;16(5):513–8.
W-041
Performance verification of mechanistic dermal physiological based pharmacokinetic (PBPK) model for enhanced understanding of dermal absorption: prediction of local tissue exposure after topical application of acitretin
Sumit Arora1, Nikunjkumar Patel1 and Sebastian Polak1,2
1Certara UK Ltd, Simcyp Division, Sheffield; 2Faculty of Pharmacy, Jagiellonian University Medical College, Poland
Objective: Unbiased performance verification of systems models such as PBPK models are very important aspect to build confidence in utilization of such approaches for further prospective predictions. The present study aim to verify the performance of multi-phase multi-layer mechanistic dermal absorption (MPML-MechDermA) model implemented within the Simcyp Simulator V17 in terms of prediction of local tissue concentrations after topical application.
Methods: Acitretin, a second-generation retinoid, was used as a model drug [1]. Input data of acitretin included physicochemical MW 192.19, pKa 5.01, LogP 6.4, plasma clearance CLIV 9.98 L/h, volume of distribution Vss 0.42 L/kg, and the surface skin pH 5.5. Diffusion and partition coefficients for the formulation and skin tissue layers were calculated using QSAR models. Solution formulation in isopropyl myristate was used in the simulations as per the clinical study and predictions of amount of acitretin per gram of skin tissue was compared with the clinically observed values [1]. No parameters were adjusted/fitted to match the clinical data as the objective was “bottom up” prediction.
Results: MPML MechDermA model can predict the local dermal concentrations of acitretin as well as its associated population variability (Figure 1). Inclusion of the effect of vehicle by computing the stratum corneum:vehicle partition coefficient was critical to correctly capture the skin penetration of acitretin. The model also showed the importance of carefully interpreting the drug concentration determined by skin biopsy samples in terms of the composition of the skin sample.
Conclusions: Mechanistic understanding of the intricate interplay of solute partitioning, diffusion and permeation across skin layers is the key to develop safe and cost-effective products. Development and performance verification of advanced dermal PBPK models such as MPML-MechDermA model can be a game changer in achieving the above said objective.

Fig. 1 Observed and Simulated acitretin concentration after topical application of acitretin solution in isopropyl myristate
References
Surber et al. 1993. Pharm Res 10(9):1291–1294.
W-042
Quantitative systems toxicological assessment of doxorubicin-induced mitochondrial cardiotoxicity in human cardiomyocytes
Tanaya Vaidya1, Hardik Mody1, Yesenia Franco1, Ashley Brown2, Sihem Ait-Oudhia1
1Center for Pharmacometrics and Systems Pharmacology, Department of Pharmaceutics, University of Florida, Orlando, USA 2Institute for Therapeutic Innovation at Lake Nona (Orlando), Department of Medicine, College of Medicine, University of Florida, USA
Objectives: To assess the mechanisms of doxorubicin (DOX)-mediated mitochondrial cardiotoxicity (DMMC) in human cardiomyocytes and optimize DOX dosing regimens for minimizing cardiotoxicity in a novel three dimensional and dynamic (3DD) cell culture system using mathematical modeling.
Methods: Immortalized human cardiomyocytes were exposed to DOX over a time-course to examine early biomarkers of DMMC including cell viability, key-signaling proteins of mitochondria-mediated apoptosis, and released brain natriuretic peptide (BNP). A quantitative system toxicological (QST) approach was used to characterize toxicological responses. A combination of transit compartment models [1], precursor pool indirect response models [2] with negative feedback regulations, and stimulatory Hill functions were used to describe cardiomyocytes viability, signaling protein dynamics, and BNP responses to DOX. Optimization of DOX dosing regimen to minimize its cardiotoxicity was performed in a 3DD cell culture system [3]. Mathematical modeling was performed using Monolix and parameters were determined as mean ± SEM.
Results: Toxicodynamic responses to DOX-treatment were captured well with the developed QST model (Figure 1). The first-order growth rate constant for cardiomyocytes was estimated at 0.03 ± 0.001 h−1. The 50% DOX stimulatory concentration and the maximal fraction of DOX stimulation of cardiomyocytes death were determined at 13.63 ± 7.24 nM and 1 ± 0.00047. In the 3DD setting, DOX dose-fractionation displayed a significant reduction in cardiotoxicity with a once daily regimen as compared to larger doses given once every 2 or 4 days (p < 0.01, Student t-test).
Conclusions: Measured early biomarkers of DMMC were captured successfully using a combined experimental and computational QST approach. DOX dose-fractionation demonstrated significantly reduced cardiotoxicity, indicating peak concentrations as the driver of DOX-cardiotoxicity. Further evaluations of DMMC biomarkers and cardiomyocytes death in 3DD settings are ongoing.

References
-
1.
Lobo E. et al. AAPS PharmSci. 2002; 4(4):E42.
-
2.
Sharma A. et al. J Pharm. Sci. 1998; 87(12):1577–84.
-
3.
Ande A. et al. Front Pharmacol. 2018 May 1;9:403.
W-043
Translational quantitative systems pharmacology model of tau pathology in human and mouse for immunotherapy investigation
Tatiana Karelina, Alexander Stepanov
InSyBio, Moscow, Russia
Objectives Multiple efforts in neurodegeneration research are aimed at development of tau pathology therapy. Therapies may lead to different outcome in terms of pathological entities depending on the mechanism. For quantitative and translational analysis, we develop a translational mechanistic model describing tau pathology in Alzheimer’s disease (AD), and preclinical tauopathy model, mice carrying P301S(L) tau mutation.
Methods The model describes tau production, microtubule binding, phosphorylation, aggregation into soluble and insoluble species. Pathological species (oligomers) propagate through the brain compartments, leading to consecutive development of corresponding Braak stages: 1–2 (transentorhinal, EC), 3–4 (limbic, HP) and 5–6 (isocortical, CT). Pathological tau inhibits its own degradation. Tau synthesis and polymerization differ between human and P301S(L) mouse in accordance with in vitro data. The human model was calibrated across published biochemical data for soluble, insoluble tau, CSF tau, SILK data and PET (18F-AV-1451 SUVR) data. The mouse model was calibrated across biochemical data for soluble (RAB, RIPA soluble fractions), insoluble tau (FA soluble fraction) in brain regions, interstitial fluid and CSF of mouse.
Results Model satisfactorily describes consecutive appearance of insoluble tau in different regions corresponding to Braak stages of AD and in transgenic mouse, as well as decrease of soluble tau in corresponding compartments. We simulated immunotherapy by antibody binding to tau in BIF and preventing further polymerization and propagation. Results predict similar decreases of insoluble and RIPA fractions, with highest decrease in EC (up to 50% decrease) and smaller in CT both in mouse and human (Figure 1). Different efficacy for HP was predicted attesting that propagation processes contribution may differ between P301S(L) mouse and human. Other therapy mechanism explanations should be tested and verified across data for immunotherapy.
Conclusions The proposed QSP model could serve as a platform for investigation of therapeutic impact on tau pathology and translational analysis.

W-044
Population K-PD modeling of cetuximab-MMAE in xenograft mouse models of pancreatic cancer
Ting Chen1, Michelle K. Greene2, Christopher J. Scott2, WenWee Ma3, Robert M. Straubinger1, Donald E. Mager1
1Department of Pharmaceutical Sciences, University at Buffalo, SUNY, Buffalo, NY 2Centre for Cancer Research and Cell Biology, Queen’s University of Belfast, UK 3Department of Oncology, Mayo Clinic, Rochester, MN
Objectives: Cetuximab-MMAE, an antibody–drug conjugate that targets EGFR on pancreatic cancer cells, has shown efficacy in two mouse models. A population kinetic-pharmacodynamic (K-PD) model was developed to characterize temporal dose–response relationships and elucidate factors that impact efficacy.
Methods: Mice bearing MiaPaca-2 or Panc-1 xenografts were treated with cetuximab-MMAE (0.1, 1 or 5 mg/kg) on days 0 and 8, and tumor volume progression was monitored. Data from each tumor model were fitted separately with a population K-PD model in ADAPT5. Estimated parameters were compared across both mouse models and with parameters obtained from in vitro studies such as potency and receptor density. Parameter sensitivity analysis and simulations were performed in Berkeley-Madonna.
Results: 5 mg/kg of cetuximab-MMAE almost completely eliminated MiaPaca-2 tumors for 80 days, but suppressed Panc-1 tumors only moderately. In contrast, cetuximab-MMAE was more potent in vitro on Panc-1 cells (IC50 = 0.0373–0.0414 nM) than on MiaPaca-2 cells (IC50 = 1.35–1.58 nM). Logistic function was used to characterize the tumor growth kinetics and an indirect response model captured the efficacy data well in both mouse models. The estimated killing rate constant of cetuximab-MMAE in MiaPaca-2 xenograft model was five-fold higher than that in Panc-1 xenograft model. The higher expression of EGFR in Panc-1 cells may contribute to the greater potency in vitro, but may constitute a “binding site barrier” that hinders intra-tumor distribution of cetuximab-MMAE, resulting in decreased efficacy.
Conclusions: The developed K-PD model was successfully applied to characterize the temporal dose–response relationships of cetuximab-MMAE in two murine pancreatic cancer models. Model-fitting results and a comparison of in vitro and in vivo potency suggest that intra-tumor cetuximab-MMAE distribution may be a key factor explaining the distinct efficacy results in these two cancer models.
W-045
A citrulline based translational system toxicology model for predicting the risks of gastrointestinal related adverse events associated with anti-cancer treatments
Tomoki Yoneyama, Koji Abdul-Hadi, Adam Brown, Emily Guan, Matt Wagoner and Andy Zhu
Takeda Pharmaceutical International, Cambridge, MA, USA.
Objective: Gastrointestinal (GI) related adverse events are commonly observed in the clinic during anti-cancer treatments, including chemotherapeutics and immune checkpoint inhibitors. Plasma citrulline has been used as a biomarker of GI related toxicity in rats and humans. In this study, a plasma citrulline-based translational system toxicology model for GI adverse events was developed using in-house and literature data of irinotecan.
Methods: Irinotecan, its active metabolite SN-38 and citrulline in plasma were determined after single or multiple administrations of irinotecan to rats. The pharmacokinetics (PK) was described by compartment models with saturable formation of SN-38. The citrulline formation was described by an indirect response model connected initially with the system biology model of GI toxicity published by Shankaran and colleagues, which consists of a series of transit compartments for enterocyte maturation and SN-38 induced GI damage on proliferative cells. Subsequent modifications were made to feedback and tolerance.
Results: The observed non-linear PK of irinotecan and SN-38 were well described after single and multiple doses. However, the plasma citrulline profiles were not well captured by the published model structure. Thus, a feedback mechanism to the stem cells as well as a tolerance mechanism were incorporated into the model. The final model was able to accurately describe the initial decrease, rebound and tolerance behavior of citrulline in rats. Subsequently, the model was translated into humans by replacing PK and GI physiological parameters. The model also predicted the observed GI toxicity dynamics in humans well without significant adjustments in drug-specific toxicological parameters.
Conclusions: A translational system toxicology model for GI adverse events was developed by utilizing plasma citrulline as a safety biomarker with drug-specific toxicological parameters from rats. This modeling framework could be applied to other oncology drugs for translationally simulating various clinical dosing scenarios, which leads to potential mitigation plans for GI toxicity.
W-046
Predicting progression free survival using tumor growth inhibition (TGI) modeling in the newly diagnosed non-Hodgkin lymphoma with long-term remission
Tong Lu1, René Bruno2, Laurent Claret2, Dale Miles1, Jin Jin1, Xiaobin Li1, Dan Lu1
1, Genentech Research and Early Development, South San Francisco, CA. 2, Genentech/Roche-France, Marseille, France
Objectives: Using metrics of early tumor-size profile to predict progression free survival (PFS) could enable early decision making [1]. This approach is evaluated in newly diagnosed non-Hodgkin lymphoma (NHL), for Diffuse Large B-cell Lymphoma (DLBCL) and Follicular Lymphoma (FL) separately. The objective is to assess TGI metric estimations and PFS prediction given the unique tumor shrinkage profile.
Methods: Longitudinal tumor-size is characterized with simplified TGI model (sTGI)[2] and Stein model (STEIN)[3]. Estimated TGI metrics and baseline covariates are screened for PFS by univariate Cox analysis. Final TGI-PFS model is determined by parametric survival analysis through backward elimination. Dependency of TGI metric on tumor assessment duration is evaluated through TGI and TGI-PFS model. Posterior predictive check (PPC) is conducted for PFS and hazard ratio (HR) prediction.
Results: Most patients had long-term remissions, which pose challenges for accurately estimating TGI metrics. Both models fit data well. For patients without re-growth during assessment, STEIN projects significant re-growth beyond observation, especially for shorter assessment duration, consisting with duration-dependent logKG estimations (growth-rate from STEIN). Although logKG-PFS model has lower AIC (Akaike information criterion) than logTTG (time-to-growth from sTGI), logTTG shows less duration-dependency and better PPC. Both metrics cannot reproduce HR of 0.66 from a positive FL trial, requiring further assessment. Potentially, logTTG has less bias predicting PFS/HR for on-going trials with shorter assessment duration.
Conclusions: The analysis highlighted the superiority of sTGI on projecting tumor-size beyond observation, when actual data shows no re-growth. LogKg estimate strongly depends on tumor assessments duration for patients without re-growth. It is critical to select significant TGI metrics with less duration-dependency to predict PFS/HR of on-going NHL trials. Further assessment is warranted to improve predictability of TGI metrics on PFS for disease with long-term remission.
References
-
1.
Bruno R et al. PMID:24419563.
-
2.
Claret L et al. PMID:23650411.
-
3.
Stein WD et al. PMID:21106727.
W-047
A Computational Framework for Rationally Designing Combined Therapy against Fractional Killing
Guan-Sheng Liu 1*, Julie Huynh 2*, Yin Zhang 3*, Richard Ballweg 1, Andrew Paek 2, Tongli Zhang1
1. Department of Pharmacology and System Physiology, College of Medicine, University of Cincinnati, Cincinnati, Ohio, USA. 45267-0575. 2. Molecular and Cellular Biology, University of Arizona, Tucson, USA. 45229-3026 3. Division of Biostatistics and Epidemiology, Cincinnati Children’s Hospital Medical Center, Cincinnati, Ohio, USA. 45229-3026
Objectives: Fractional killing (FK), which arises due to non-genetic variability between individual cells, is a major challenge to effective treatments of cancer. Non-genetic variability can come from multiple sources, including the p53 pathway, the BCL family of proteins, as well as the levels of caspases. To rigorously investigate how such variations control cellular fates, we developed a comprehensive computational model that incorporates these three sources of variability.
Methods: After the model recaptured the life-death responses of individual cells to the drug cisplatin, it is subject to a systemic analysis with an ensemble of diverse machine learning methods. Though these methods are characterized by their unique algorithms, they collectively identified several molecular players that can sensitize tumor cells to cisplatin-induced apoptosis (sensitizers). All these identified sensitizers are supported by relevant experimental observations, indicating that the model indeed serves as a faithful representation of the cells under investigation. Hence, we applied the model to predict the response of cells to a combined therapy of cisplatin and the TNF-related apoptosis-inducing ligand (TRAIL).
Results: The model predicted that the killing effect of cisplatin would be enhanced when combined with TRAIL, meanwhile, the model also predicted a “two-wave killing” when TRAIL is combined with cisplatin. Both of these predictions were then validated by measuring the dynamics of p53 accumulation, cell fate, and cell death times in single cells following the combined treatment.
Conclusions: Overall, we have successfully expanded and experimentally validate a comprehensive framework to faithfully describe the chemotherapy response of single tumor cells, we believe that the further improvement and board application of this comprehensive framework will be able to aid us with optimizing combination therapies in multiple types of cancers.
W-048
A combined machine learning and mechanistic PBPK model to link chemical structure to brain penetration in support of rational drug design
Tristan S. Maurer, Patrick E. Trapa, Chris Keefer, Jennifer Liras, John Umland, Matt Troutman, Bo Feng, Dennis Scott, David Rodrigues
Pfizer Global Research and Development, 610 North Main Street, Cambridge MA 02139
Objectives: To develop an approach to predict the brain penetration of PgP and BCRP efflux transporter substrates from chemical structure alone.
Methods: A PBPK model was used to link efflux ratios (ER) measured in vitro to steady-state unbound brain-to-unbound plasma concentration ratios measured in vivo. Both a bottom-up (relative expression) and middle out (ML-based estimation of unified scaling factors) approach was taken to associate ER values measured in PgP and BCRP transfected cells to measures of brain penetration in vivo. Model qualification was based on the ability to characterize in vivo data on over 100 compounds across 3 species (mouse, rat and monkey). Translation to chemical structure was achieved using a machine learning method which employs recursive partition with linear regression in order to form associations between hundreds of chemical descriptors and > 100,000 measures of efflux ratios made in vitro. Finally, the 2 models were merged into a unified application which provides prediction of human brain penetration from chemical structure alone.
Results: Both the bottom-up and middle out approach to associating in vitro ER measures to in vivo brain penetration were reasonably successful, with a fraction of model-based values and observations being within 2-fold between 65 and 93% depending on species and approach. The machine learning model provided strong associations to chemical descriptors. Examples of the utility of the combined model have been generated and will be provided in the poster.
Conclusions: The combination of mechanistic, physiologically based translational models and machine learning techniques can provide powerful context into drug design whereby chemical design can be elevated beyond optimization of simple physiochemical properties to optimization against the desired clinical outcome.
References
Trapa PE, Belova E, Liras JL, Scott DO, Steyn SJ. Insights From an Integrated Physiologically Based Pharmacokinetic Model for Brain Penetration. Journal of Pharmaceutical Sciences. 2016;105(2):965–971.
W-049
A population pharmacokinetic/pharmacodynamic model of C4 antigen concentrations and C1-Esterase inhibitor functional activity in hereditary angioedema patients
Van Anh Nguyen1, Dipti Pawaskar2, Michael Tortorici2, Jagdev Sidhu3
1Department of Pharmaceutical Sciences, University at Buffalo - SUNY, Buffalo, New York, USA; 2Clinical Pharmacology and Early Development, CSL Behring, King of Prussia, Pennsylvania, USA; 3Clinical Pharmacology and Early Development, CSL Limited, Parkville, Australia.
Background: Hereditary angioedema (HAE) is a rare autosomal dominant disease caused by deficiency or dysfunction of C1 esterase inhibitor (C1-INH) leading to attacks of subcutaneous and/or submucosal swelling. In HAE patients, uncontrolled activation of the classical complement pathway leads to low serum concentrations of complement 4 (C4), which serves as a useful laboratory biomarker of HAE disease.
Objectives: To quantify the relationship between C1-INH functional activity and serum C4 antigen concentrations in HAE patients using a population pharmacokinetic/pharmacodynamic (PK/PD) model.
Methods: C1-INH functional activity and serum C4 antigen concentrations from two clinical trials (ClinicalTrials.gov Identifier: NCT01912456, NCT01576523) were included in the analysis. A population PK/PD model was developed using NONMEM (Version 7.3). Previously, a one-compartment model with first order elimination and body weight effect on clearance was used to describe the PK of C1-INH functional activity after subcutaneous administration of C1-INH to HAE patients. Several PD models were tested to describe the relationship between C1-INH functional activity and C4 antigen concentrations. Final model was selected based on %RSE, goodness-of-fit plots, individual fits, and visual predictive checks. Covariate testing was performed to explore the effects of age, body weight, sex, and HAE type on PD parameters.
Results: The C4 antigen concentrations increased with increasing C1-INH functional activity in both type I and type II HAE patients. The indirect response model with inhibition of kout showed best performance in characterizing data. Baseline C4 concentration was estimated at 6.94 mg/dL (27.9% inter-individual variability), IC50 was estimated at 49.1% C1-INH functional activity. Covariate analysis did not reveal significant covariate effects on any PD parameters.
Conclusions: The relationship between C1-INH functional activity and C4 antigen concentrations in HAE patients was adequately described by indirect response model with inhibition of removal process. No covariates were found to be significant to describe the variability in the parameters.
W-050
Network-based systems pharmacology model to identify novel treatment strategies for non-Hodgkin lymphoma
Van Anh Nguyen1 and Donald E. Mager1
1Department of Pharmaceutical Sciences, University at Buffalo - The State University of New York, Buffalo, NY 14214, USA
Objectives: To (i) evaluate how distinctive protein expression patterns of select types of B-cell non-Hodgkin lymphoma (B-NHL) affect B-cell signaling dynamics and proliferation; and ii) identify candidate protein targets for developing single and combination treatment strategies capable of causing cell death across three diverse yet representative B-NHL types.
Methods: A B-cell signaling Boolean network model was constructed from an extensive literature and database search to incorporate biochemical pathways regulating B cell survival and death. Graph-theoretical analyses were conducted to identify system elements of high importance. The network was modified to accommodate protein abnormalities for each B-NHL type. A minimal intervention analysis (MIA) was performed in CellNetAnalyzer to identify single and combination treatment strategies that can induce cell death and prevent cell growth in different types of B-NHL. An attractor analysis was conducted with BoolNet to evaluate the effectiveness of potential single agent and multidrug therapeutic interventions.
Results: A B-cell signaling network was constructed containing 146 nodes and 299 regulatory interactions (Figure 1). Betweenness centrality and connectivity measures revealed that NFκB, c-Myc, Bcl-6, and proteins in the PI3K-AKT axis have an impact in mediating information flux in the system. MIA suggested that no single agent targeted intervention was capable of achieving cell death in follicular lymphoma or activated B cell-like subtype of diffuse large B-cell lymphoma (DLBCL). In contrast, Burkitt’s lymphoma and germinal center B cell-like DLBCL were found to be more susceptible to targeted monotherapies. Attractor analysis identified NFκB, Bcl-2, HDAC, and proteasome as promising candidates for distinct combination strategies across different B-NHL types.
Conclusions: The construction and analysis of a network-based systems pharmacology model of B-cell signaling led to the identification of potential treatment strategies for various B-NHL. Boolean network modeling can aid in qualifying potential therapies within the context of molecular complexity and heterogeneity of B-NHL.
W-051
Exenatide effects on gastric emptying and oral glucose appearance in plasma: A quantitative assessment using an integrative systems pharmacology model
Veronika Voronova1, Kirill Zhudenkov1, Robert C. Penland2a, David W. Boulton2b, Gabriel Helmlinger2a, Kirill Peskov1
1M&S Decisions, Moscow, Russia; 2Quatitative Clinical Pharmacology, Early Clinical Development, IMED Biotech unit, AstraZeneca; 2aBoston, USA; 2bGaithersburg, USA.
Objectives: Exenatide is a synthetic glucagon-like peptide-1 receptor ((GLP-1) R) agonist with a complex mechanism of action, used in the treatment of type 2 diabetes. Exenatide immediate release (IR) has been shown to decrease the gastric emptying rate (GER), thereby slowing exogenous glucose appearance in plasma (GluRA); this may contribute to a stabilizing drug effect on postprandial glycemia. The aim of this study was to quantify the exenatide IR effect on GER and GluRA following the ingestion of food with varying carbohydrate content, using a quantitative systems pharmacology (QSP) model.
Methods: The model is described as a system of ordinary differential equations, developed in R version 3.4.1. using the IQR software (http://www.intiquan.com/), and qualified in a step-by-step fashion against published data. Firstly, GLP-1 and exenatide IR plasma levels under intravenous GLP-1 infusion or subcutaneous exenatide IR administration were reproduced, and the effect of GLP-1R occupancy on GER was quantified. Secondly, the link between GER and GluRA under intake of different food types was evaluated. The full model considers interconnections between the exenatide IR pharmacokinetics, GLP-1R occupancy, GER and GluRA, and was used to simulate daily GluRA dynamics under the recommended 10-μg twice-daily drug administration, with thrice-daily food intake.
Results: Under the recommended regimen, exenatide IR flattens postprandial GluRA peaks; this reduction is less pronounced after mid-day meal intake vs. morning and evening meals (5–30% vs. 48-49%), due to lower plasma exenatide concentrations at mid-day. Treatment effect is dose-dependent and influenced by food carbohydrate content but not by the lag-time between exenatide administration and meal intake.

Conclusions: The QSP model allowed for a comprehensive study of exenatide IR effects on GluRA. Model-based simulations support the recommended exenatide administration regimen and demonstrate the importance of dietary counselling.

Reference
Voronova et al. Diabetes Obes Metab. 2018. https://doi.org/10.1111/dom.13326
W-052
Quantifying immune effects of FOLFOX therapy with mathematical models
Victoria Gershuny1, Ardith El-Kareh2, Tim Secomb3
Department of Mathematics, The University of Arizona
Objectives: FOLFOX (5-fluouracil, leuvcovorin, and oxaliplatin) is in wide clinical use for colorectal adenocarcinoma. In addition to direct cytotoxic effects, this chemotherapy is now known to have immune effects, including stimulation of natural killer (NK) cells by oxaliplatin and elimination of myeloid derived suppressor cells (MDSCs) by 5-fluorouracil. This study aims to quantify the relative magnitudes of direct cytotoxicity and these two immune effects. Increased understanding of the immune system’s role may lead to improved therapeutic design.
Methods: A mathematical model is developed, consisting of 17 nonlinear coupled ordinary differential equations, accounting for the tumor as well as CD4+ and CD8+T cells, Tregs, NK cells, dendritic cells, MDSCs, and both immunostimulatory (IL-2, IFN-gamma) and immunosuppressive (IL-10, TGF-beta) molecules. Tumor cell kill results from direct cytotoxicity as well as NK-cell- and effector T-cell-induced lysis. All parameters are estimated from experimental data, and predicted cell counts and plasma levels are checked against values in human patients.
Results: Whereas direct FOLFOX cytotoxicity and elimination of MDSCs by 5-FU both contribute significantly to tumor growth delay, oxaliplatin enhancement of NK cells has a negligible effect. The model is consistent with experimental studies showing that NK cells have less effect on tumor control than CD8+T-cells, primarily because of low recruitment to the tumor site. In the case without surgery where 12 cycles of FOLFOX extend survival by 191 days, immune effects account for 23 days. In the case with surgery where FOLFOX extends survival by 128 days as compared to surgery alone, the immune effects account for 7 days.
Conclusions: The immunologic effects of FOLFOX are a significant component of its success in delaying tumor growth, suggesting additional immunotherapy might be beneficial. Targeting immunosuppressive effects appears to be a more promising strategy than attempting to enhance immune tumor cell lysis.
W-053
Ebola viral dynamics in nonhuman primates: insights into virus immuno-pathogenesis and antiviral strategies
Vincent Madelain (1), Sylvain Baize (2), Frédéric Jacquot (3), Caroline Carbonnelle (3), Hervé Raoul (3), Xavier de Lamballerie (4), France Mentré (1), Jérémie Guedj (1).
(1) IAME, UMR 1137, INSERM, Université Paris Diderot, Sorbonne Paris Cité Paris, France; (2) UBIVE, Institut Pasteur, Centre International de Recherche en Infectiologie, Lyon, France; (3) Laboratoire P4 Inserm-Jean Mérieux, US003 Inserm, 69365 Lyon, France; (4) UMR “Emergence des Pathologies Virales” (EPV: Aix-Marseille University - IRD 190 - Inserm 1207 - EHESP), Marseille, France; Institut Hospitalo-Universitaire Méditerranée Infection, F-13385 Marseille, France
Objectives: In absence of therapeutics in Ebola virus disease, our group has focused since 2015 on the assessment of polymerase inhibitor favipiravir. Part of this evaluation, this work aimed to:
-
Develop a mechanistic host–pathogen of Ebola pathogenesis in macaques.
-
Predict the effect of treatment efficacy and timing of initiation on survival.
Methods: 44 macaques were infected with Ebola virus, including 16 receiving various doses of favipiravir initiated in prophylaxis. Mechanistic models of increasing complexity were fitted to pharmacokinetic, virological and immunological data to incorporate the respective effects of favipiravir, innate and adaptive immune responses on viral replication and control of the infection. Next the viral dynamics model was extended to a joint model. A forward procedure was used to select the model variables included in the hazard function providing the best improvement of BIC. Finally, simulations were performed to extrapolate the impact of treatment potency and timing of initiation on viral load and survival. Model estimations were performed using the SAEM algorithm (Monolix 2016R1).
Results: Capture of the viral dynamics required to incorporate the effect of the innate response mediated by IFNα (Figure). Treatment with favipiravir, inducing a 50% decrease of the viral replication for the highest evaluated dose, was sufficient to reduce viral replication and cytokine storm, while still conferring cell protection. A joint model assuming that hazard rate was related to inflammatory cytokines provided the best description of time to death. Using the model we predicted that favipiravir initiation up to D2 post challenge would maintain similar survival rate of 60% compared to prophylaxis initiation, and treatments of higher potency could maintain 100% protection only if administered before D4.
Conclusion: The model showed that mortality is primarily driven by the inflammatory reaction, and can be reversed by the early administration of a potent direct antiviral.

W-054
Evaluating sex differences in methylprednisolone pharmacokinetics and pharmacogenomics: A quantitative systems pharmacology approach
Vivaswath S. Ayyar1, Debra C. DuBois1,2, Richard R. Almon1,2, William J. Jusko1
1Department of Pharmaceutical Sciences; 2Department of Biological Sciences, University at Buffalo, NY, USA
Background/Objectives: Corticosteroids (CS) are immunosuppressive agents that act via genomic mechanisms. We hypothesize that elevated E2 during the pro-estrous stage of the female estrous cycle will antagonize CS-enhanced GILZ biomarker expression [1] in tissues. Our studies aim to i) explore sex differences in methylprednisolone (MP) PK/PD, ii) connect PK/PD responses of MP to female estrous cycle, and iii) establish a model that links molecular-level interactions of MP and E2 to MP response.
Methods: Model Development. The quantitative model (Fig. 1A) describes: i) rodent estrous cycle, ii) disposition of MP in both sexes, and iii) receptor-mediated actions of MP and its interaction with free E2. The model was implemented on ADAPT5. Experimental. Male and estrus and pro-estrus staged female rats were dosed IM with 50 mg/kg MP. Blood and tissues were collected over 24 h after MP. Plasma E2 was measured via ELISA. Drug PK was measured using HPLC. In vitro assessments of MP protein binding and intrinsic clearance were made in both sexes. The GILZ and glucocorticoid-receptor mRNA were quantified using qRT-PCR.
Results: Plasma E2 was elevated in pro-estrus compared to estrus, and inversely related to baseline GILZ in the uterus (Fig. 1B). Plasma and liver MP exposure was 3-fold higher in females. MP-enhanced GILZ was higher in livers of estrus-staged females compared to males, attributable to higher drug exposure. The AUC0→24h (post-MP) of GILZ in the uteri from estrus-females was 2-fold higher than in pro-estrous-females, supporting our hypothesis of CS antagonism by E2. The developed model successfully predicted PK as well as GILZ dynamics.
Conclusions: The developed model offers a mechanistic platform to integrate determinants of sex- and tissue-specificity in CS actions. This mechanistic model may also explain interactions of E2 with other drugs acting via nuclear receptors.

Reference
-
1.
Ayyar VS et al. JPET 363: 45–57 (2017).
W-055
Dose and exposure response relationship in combination therapy: a case study in HCV therapy
Wei Gao1, *, Bhargava Kandala1, Matthew Rizk1, Nancy Kim2, Heather Platt3, Rebeca Plank3, Wendy W. Yeh3, Michael Robertson3
1Pharmacodynamics, Pharmacokinetics and Drug metabolism, 2Translational Pharmacology, 3Clinical Research, Merck & Co., Inc
Objectives: To demonstrate how to leverage dose–response and exposure–response modeling to inform dose selection and interpretation of clinical results for the combination therapy development for HCV.
Method: Various regimens of four antiviral agents: uprifosbuvir (UPR), grazoprevir (GZR), ruzasvir (RZR) and elbasvir (EBR) were evaluated (Table 1). Dose- and exposure–response modeling were conducted using clinical data.
Results: Dose–response analysis of phase 1 studies suggested that, as monotherapy, 300 to 450 mg of UPR or a ≥ 10 mg dose RZR was at the plateau of viral load decline. Therefore, 300 or 450 mg UPR and 60 mg RZR was selected to be evaluated with GZR as a 3-drug regimen in Ph2. UPR dose–response was observed, especially in GT2 patients (94% vs. 71% for 450 vs. 300 mg UPR/GZR/RZR arms). Since RZR regimens demonstrated higher SVR12 than EBR regimens, 450 mg UPR/100 mg GZR/60 mg RZR was then selected for further evaluation. This 3-drug, 12-week regimen resulted in high SVR12 rates with a flat exposure–response relationship for all three components. In order to develop an effective 2-drug regimen, 60 and 180 mg RZR with 450 mg UPR were evaluated. The two doses of RZR were selected based on the exposure–response analysis of 3-drug regimen data. The exposure–response analysis of 2-drug regimen demonstrated that both UPR and RZR were not at the plateau, suggesting that the exposure–response relationships of UPR and RZR were shifted in the presence of GZR.
Table 1 Clinical Trials Evaluating Various regimens of UPR, GZR, RZR and EBR
Clinical Trials | Mechanism of Action | Phase 1 Monotherapy | Phase 1 Monotherapy | Part A of C-CRESTa 3-Drug Regimen | Part A/B of C-CRESTb 3-Drug Regimen | C-BREEZE-1 2-Drug Regimen | C-BREEZE-2 2-Drug Regimen | ||
|---|---|---|---|---|---|---|---|---|---|
Regimen | NS3/4A protease inhibitor | GZR 100 mg* | GZR 100 mg* | GZR 100 mg* | GZR 100 mg* | ||||
non-structural protein 5A (NS5A) replication complex inhibitors | RZR 10–120 mg | EBR 50 mg* | EBR 50 mg* | RZR 60 mg | RZR 60 mg | RZR 60 mg | RZR 180 mg | ||
non-structural protein 5B (NS5B) polymerase inhibitor | UPR 50–450 mg | UPR 300 mg | UPR 450 mg | UPR 300 mg | UPR 450 mg | UPR 450 mg | UPR 450 mg | ||
Duration | 7 days | 5 days | 8 wks | 8 wks | 8 wks | 8–16 wks | 12 wks | 12 wks | |
Efficacy endpoint | HCV RNA reduction from baseline | SVR12: sustained virological response 12 weeks after the end of the therapy | |||||||
Conclusion: The critical question during combination therapy development is to select the right dose for each component, which depends on constitution of the regimen. For the same component, the optimal dose identified in one regimen may not hold for another regimen. Robust dose/exposure–response analysis together with results from properly designed clinical program would enable understanding of optimized dosing for various regimens.
W-056
Development of virtual population database from real world data
Hwa-ping Feng1, Akshita Chawla1, Susan Zhou1, Gerly van der Vleuten2, Li Qin2, Wei Gao1
1Pharmacodynamics, Pharmacokinetics and Drug metabolism, Merck & Co., Inc 2Certara Strategic Consulting
Objectives: To develop virtual population databases from real-world data to support clinical trial simulations.
Method: Existing QCed Population PK datasets from Merck clinical programs were used to obtain key baseline demographics (e.g. age, race, gender, body weight) and laboratory data (e.g. serum creatinine, ALT) of individual subjects. The clinical programs were from various therapeutic areas, such as infectious disease, diabetes and oncology. Clinical studies conducted in healthy subjects and patients with indicated diseases were included. A pediatrics database and an adult database including subsets of renal impairment and geriatric subjects were developed.
Results: The pediatric database included 10 clinical programs (N = 1499); the adult databases included 12 programs: subjects with renal impairment (eGFR < 90 ml/min/1.73 m2, calculated by MDRD function; N = 7030) and geriatric subjects (> 65 years of age; N = 6747). There was a general agreement in the weight distribution by age of the internal pediatric database compared to that of the pediatric subjects in the NHANES 2015–2016 release (N = 3799), with a trend of slightly lower body weight in oncology subjects. Distribution of laboratory values, including serum creatinine, in pediatric subjects could not be compared between the two databases as they were not collected for subjects < 12 years of age in NHANES. Despite the relatively large N, one limitation of the current virtual pediatric population database is that patient level data were included only for those with PK measurements, as population PK datasets were the source data, and represents a small subset of the overall population in the clinical studies.
Conclusion: Here, we describe the development of virtual population databases from real world data, where the important correlations between key demographic and other patient characteristics are preserved. These databases can be utilized to enable a more realistic clinical trial simulation in most representative individuals with realistic variability in the intended treatment population.
W-057
A quantitative systems toxicology model for the gastrointestinal immune system
Seung-Wook Chung, Phillip Spinosa, Matteo Di Piazza, James Smith, Birgit Fogal, Warren Ku
Nonclinical Drug Safety US, Boehringer Ingelheim, Ridgefield, Connecticut, United States
Objectives: Numerous drugs induce subclinical to serious injuries in the gastrointestinal (GI) tract. However, the prediction of adverse drug reactions and clinical outcomes is poor due to complex toxicity mechanisms involving mucosal damage, immune responses, and the gut microbiota. To improve quantitative mechanistic understanding and prediction of drug-induced GI toxicity, a quantitative systems toxicology (QST) modeling framework for the GI-immune system was developed.
Methods: Our QST model was adapted from previously published computational models [1, 2], yielding a system of non-linear ordinary differential equations (ODEs) built mostly based on mass action kinetics and hill kinetics. The model describes inter-compartmental translocations of and dynamic interactions among diverse cell types in the gut, including commensal and pathogenic bacteria, dendritic cells, T cells, macrophages, neutrophils, and intestinal epithelial cells.
Results: The model was used to simulate the effect of drugs with a different mechanism of action on GI mucosal integrity and inflammation. The drugs tested in silico have one of the following modes of action: intestinal epithelial cell lineage damage, pro-inflammatory T cell suppression, or neutropenia induction; all modes of action with clinical relevance. The model can help identify drug doses which allow various degrees of recovery of the intestinal mucosal barrier. The model indicates that when drugs directly damage the epithelial layer, the recovery time of the intestinal mucosal barrier scales logarithmically with the drug dose. The model also predicts that in the presence of immunosuppressive agents, post-infection epithelial recovery time increases along with prolonged bacterial burden, increasing a sepsis risk.
Conclusions: Our model can serve as a sustainable and expandable platform to better understand and predict the complicated dynamic behavior of the drug-challenged GI-immune system, and to facilitate more rational preclinical study design and safety risk assessment.
References
-
1.
Carbo A., (2013) PLoS ONE 8(9): e73365.
-
2.
Wendelsdorf K. (2010) J Theor Biol 264:1225–1239
W-058
Exploring inductive linearization in population pharmacokinetic and pharmacodynamic models
Matt Fidler (1,5), Yuan Xiong (2,5), Rik Schoemaker (3,5), Justin Wilkins (3,5), Mirjam N. Trame (1,5), Teun Post (4,5), Richard Hooijmakers (4,5), Wenping Wang (1,5)
(1) Novartis Pharmaceuticals, USA, (2) Certara Strategic Consulting, USA, (3) Occams, The Netherlands, (4) LAP&P Consultants, The Netherlands, (5) The nlmixr team
Objectives: An inductive approximation which iteratively transforms systems of nonlinear ordinary differential equations (ODEs) to linear time-varying (“inductive linearization”, an iterative process to linearise nonlinear first order ODEs) has been proposed as a means to improve the speed and efficiency of fitting nonlinear mixed-effects models [1]. This work builds on the original work to explore the feasibility and performance of an inductive linearization in population pharmacokinetic (PK) and pharmacodynamics (PD) models.
Methods: Inductive linearization was coupled with the matrix exponential method in R (from ExpoRkit) to solve a simple nonlinear pharmacokinetic model with Michaelis–Menten (MM) elimination [2]. The inductive linearization approach and LSODA approach are compared in terms of speed and estimation precision with a population PK data with MM elimination.
Results: The inductive linearization coupled with the matrix exponential method improved the overall model fitting speed by 50–60% over the LSODA method. Parameter estimates were comparable between methods.
Conclusions: Inductive linearization coupled with the matrix exponential method is a fast and stable method for population PK and PD models described by sets of nonlinear differential equations. This method offers an alternative to typical ODE solving methods in population PK and PD modeling.
References
-
1.
Hasegawa C, Duffull SB (2018) J Pharmacokinet Pharmacodyn 45(1):35–47.
-
2.
Sidje RB (1998). ACM Trans. Math. Softw. 24(1): 130–1569.
W-059
Exploring inductive linearization in population pharmacokinetic and pharmacodynamic models
Matt Fidler (1,5), Yuan Xiong (2,5), Rik Schoemaker (3,5), Justin Wilkins (3,5), Mirjam N. Trame (1,5), Teun Post (4,5), Richard Hooijmakers (4,5), Wenping Wang (1,5)
(1) Novartis Pharmaceuticals, USA, (2) Certara Strategic Consulting, USA, (3) Occams, The Netherlands, (4) LAP&P Consultants, The Netherlands, (5) The nlmixr team
Objectives: An inductive approximation which iteratively transforms systems of nonlinear ordinary differential equations (ODEs) to linear time-varying (“inductive linearization”, an iterative process to linearise nonlinear first order ODEs) has been proposed as a means to improve the speed and efficiency of fitting nonlinear mixed-effects models [1]. This work builds on the original work to explore the feasibility and performance of an inductive linearization in population pharmacokinetic (PK) and pharmacodynamics (PD) models.
Methods: Inductive linearization was coupled with the matrix exponential method in R (from ExpoRkit) to solve a simple nonlinear pharmacokinetic model with Michaelis–Menten (MM) elimination [2]. The inductive linearization approach and LSODA approach are compared in terms of speed and estimation precision with a population PK data with MM elimination.
Results: The inductive linearization coupled with the matrix exponential method improved the overall model fitting speed by 50–60% over the LSODA method. Parameter estimates were comparable between methods.
Conclusions: Inductive linearization coupled with the matrix exponential method is a fast and stable method for population PK and PD models described by sets of nonlinear differential equations. This method offers an alternative to typical ODE solving methods in population PK and PD modeling.
References
-
1.
Hasegawa C, Duffull SB (2018) J Pharmacokinet Pharmacodyn 45(1):35–47.
-
2.
Sidje RB (1998). ACM Trans. Math. Softw. 24(1): 130–1569.
W-060
Use of a PK/PD modeling and simulation approach to bridge efficacy and safety between the lesinurad/allopurinol fixed dose combination (FDC) product and the co-administration of mono-products
Xiaofeng Wang*, Renu Singh*, Jiang Liu, Anshu Marathe, Bhawna Saluja, Chandrahas Sahajwalla, Yaning Wang
Office of Clinical Pharmacology, FDA, Silver Spring, MD
*Equal contribution
Background and Objective: Recently, the FDA approved a FDC that consists of two previously approved uric acid (UA) lowering agents (lesinurad and allopurinol) for the treatment of hyperuricemia associated with gout. This is the first FDC for gout. The approval of the FDC tablets was under the 505(b)(2) pathway with predicted efficacy and safety supported by previous studies that evaluated the co-administration of these two agents and a bioavailability/bioequivalence (BA/BE) study in the fasted state and modeling and simulation in support of a PK/PD bridge. Both the FDC and mono-products are recommended to be taken with food.
Bioequivalence between the FDC and the co-administered mono-products in the fasted state was adequately demonstrated by the BA/BE study. However, the PK bridging between the FDC and the co-administrated mono-products in the fed state, which is more relevant due to the requirement of administration of the FDC tablets with food, cannot be established based on available food effect information of the FDC. In the presence of food, Cmax of lesinurad and allopurinol was reduced (by 46% and 18%, respectively) and Tmax was extended for the FDC, while AUC of lesinurad was unchanged. This contrasted with the approved lesinurad mono-product where only 18% reduction in Cmax was observed in the presence of food. The objective of this work was to evaluate the impact of PK changes on UA lowering in hyperuricemic patients using modeling and simulation.
Methods: A PK/PD model was developed to characterize the physiology of UA and the pharmacological effect of lesinurad and allopurinol on UA disposition. Simulations in various PK scenarios were performed to evaluate the impact of food-induced PK changes on the UA lowering in hyperuricemic patients.
Results: The established PK/PD model adequately characterized the lesinurad and allopurinol PK data and UA PD response and was externally validated. Simulation results demonstrated that there are no clinically meaningful differences in the UA lowering effect of the FDC in hyperuricemic patients over a range of lesinurad and allopurinol absorption rate and bioavailability changes (Figure 1), suggesting the UA lowering effect is not affected by the changes in Cmax for lesinurad and allopurinol in the fed state given AUCs remain unchanged.
Conclusions: Although the food-induced lesinurad Cmax reduction of the FDC was significant, modeling and simulation indicated that such PK changes would not result in clinically meaningful differences in the UA lowering and thus not compromise the efficacy of the FDC. PK/PD modeling and simulation played a pivotal role in the approval of the lesinurad/allopurinol FDC product.

Fig. 1 Simulated Concentration Time Profiles of Serum Uric Acid in Hyperuricemic Patients under Different PK Scenarios. Note: Lines represent model prediction. Black dots represent mean observed baseline and on treatment of serum uric acid levels. Columns show subsets of subjects by creatinine clearance. Rows show subsets of subjects by treatment group: 301 and 302 refer to Studies RDEA594-301 and 302; L200 refers to lesinurad 200 mg daily dose; A300 refers to allopurinol 300 mg daily dose.
W-061
Concentration-effect analysis of the relationship between plasma concentration of epacadostat and/or major metabolites and QTc prolongation in healthy volunteers during a thorough QT study
Xiaohua Gong, Naresh Punwani, Noam Epstein, Ryan McGee, Phillip Wang, Xuejun Chen, and Swamy Yeleswaram
Incyte Research Institute, Wilmington, DE 19803, USA
Objectives: Epacadostat is an IDO1 inhibitor in clinical development for malignant diseases. A multiple-dose thorough QT study was conducted to evaluate the potential of epacadostat and/or its major metabolites to prolong the QTc interval in healthy volunteers.
Methods: This study was a double-blind, randomized, 4-way crossover of epacadostat, placebo, or open-label moxifloxacin (positive control). It evaluated the effects of multiple doses of epacadostat 100 mg BID or 700 mg BID for 7 days on the QTc interval in 50 healthy volunteers. A 7-day washout was scheduled between treatment periods. Serial pharmacokinetic sampling and time-matched triplicate ECG measurements were performed on Day 7.
Results: The categorical analysis found no trend of QTcF prolongation (> 30 ms and/or > 60 ms). Analysis of the pharmacokinetics of parent and metabolites revealed that one of the major metabolites, M12, had a long half-life such that there was carryover in plasma concentration after the 1-week washout. Three types of linear or nonlinear mixed-effects models of the concentration-QTcF relationship (C-ΔΔQTcF, C-ΔQTcF and C-QTcF) were developed. At 700 mg BID, all the model- predicted 90% CI upper bound for the ΔΔQTcF were < 8.4 ms. Utilizing the C-QTc model, the potential effect of M12 plasma exposure on baseline QTcF after washout was conservatively estimated as the product of the maximum observed M12 carryover concentration and the 95% CI upper bound of the estimated slope parameter for the M12 concentration term in the C-QTc model, which equals 1.55 ms. For all three types of the concentration-effect (Cp-ΔΔQTcF/ΔQTcF/QTcF) models assessed, adding 1.55 ms to the model-predicted 90% CI upper bounds of ΔΔQTcF did not exceed 10 ms.
Conclusions: In this study, 100 mg (therapeutic) and 700 mg (supratherapeutic) doses of epacadostat administered BID for 7 days had no clinically significant effect on the QTc interval.
W-062
Physiologically-based pharmacokinetics model application for epacadostat to estimate starting doses for pediatric clinical evaluations
Xiaohua Gong1, Alice Ke2, Tao Ji1, Qiang Zhang1, Jason Boer1, Yan Zhang1, Sharon Diamond1, Naresh Punwani1, Xuejun Chen1, Swamy Yeleswaram1.
Incyte Research Institute, Wilmington, DE, 2 Certara, Princeton, NJ
Background: Epacadostat is being developed for the treatment of malignant diseases. It is of interest to further the development of epacadostat in pediatric patients with various tumor types. The intended pediatric age range is 6 months to < 18 years old.
Methods: A minimal adult PBPK with ADAM absorption model with an assigned fmUGT1A9 value of 46% for epacadostat has been developed and verified using clinical pharmacokinetic and DDI data. It was applied to estimate an appropriate pediatric starting dose by matching the equivalent systemic exposures in adult patients receiving 100 mg BID and 300 mg BID. The UGT1A9 ontogeny function derived from mRNA and activity data was applied in pediatric population. In addition, a medium ontogeny function which was based on known CYP ontogeny functions was applied to the undefined liver metabolism component (> 50%) in the populations of < 6 years old. The metric was that the predicted systemic exposure (AUC) falls within 1.5-fold of the observed values for AUC.
Results: In terms of body weight-based dosages, doses of 0.8, 0.9, 1.1, 1.33 and 1.33 mg/kg BID for the age groups of 0.5- < 1, 1- < 2, 2- < 6, 6- < 12 and 12- < 18 years old, respectively, were predicted to yield systemic exposures equivalent to 100 mg BID dosing in adults. Doses of 2.4, 2.8, 3.3, 4 and 4 mg/kg BID for the same age groups were predicted to yield systemic exposures that are equivalent to 300 mg BID dosing in adults.
Conclusion: The final adult epacadostat PBPK model was prospectively applied to estimate an appropriate starting dose for pediatric clinical evaluation. Lower doses of epacadostat were projected in infants and children. Sparse PK collection in paediatric clinical trials will allow further refinement of the pediatric PBPK model(s) and validation/adjustment of pediatric dose(s).
W-063
A population pharmacokinetic model of buprenorphine following sublingual administration of ALKS 5461 in patients with major depressive disorder
David McDougall1, Fran Stringer1, Hong Lu2, Marjie Hard2, Bruce Green1, Lisa von Moltke2
1Model Answers, Brisbane, Australia, 2Alkermes, Inc., MA, USA
Objectives: ALKS 5461 (a fixed-dose sublingual (SL) combination of buprenorphine (BUP) and samidorphan) is an opioid system modulator intended for the adjunctive treatment of major depressive disorder (MDD) in patients who have an inadequate response to standard therapies.[1] The objective of the analysis was to characterize the PK of BUP following SL administration of ALKS 5461.
Methods: Data from 10 studies (healthy volunteers (HV), adult subjects with MDD, renal and hepatic impairment) were included in the analysis. A non-linear mixed effects model was developed in NONMEM v7.3. Diagnostics, numerical, and prediction-corrected visual predictive checks were used to evaluate the model.
Results: The PK of BUP in healthy and MDD subjects following single and multiple doses of SL ALKS 5461 was described by a 3-compartment disposition model, linear elimination, and absorption via a series of transit compartments. Population estimates of CL/F and Vc/F were 182 L/h and 1250 L, respectively. Inter-individual variability estimates on CL/F and Vc/F were 35.2% and 33.2%, respectively. An additive residual error model on log transformed data was included with a time dependent weight applied to account for the increased variability observed during the absorption phase.[2] Patient intrinsic factors such as age, gender, race, and the concomitant administration of anti-depressant therapy (ADT) had no effect on the PK of BUP. Subjects with severe renal impairment and hepatic impairment showed increased BUP exposure and were accounted for by the covariate model.
Conclusions: A population PK model for BUP following SL administration of ALKS 5461 was developed which demonstrated that no dose adjustment of BUP in ALKS 5461 is needed in patients based on age, gender, race, or concomittant treatment of ADTs.
References
-
1.
Fava M. Am J Psychiatry. 2016 May 1;173(5):499–508.
-
2.
Chan PLS. Br J Clin Pharmacol, 65 Suppl1:76–85,Apr2008.
W-064
Physiologically-based modeling of cisplatin pharmacokinetics
Xiaowei Zang and Leonid Kagan
Department of Pharmaceutics, Ernest Mario School of Pharmacy, Rutgers University, Piscataway, NJ, 08854
Objectives: To develop whole-body disposition model of cisplatin following intravenous administration of cisplatin at different dose levels in mice and rats.
Methods: Plasma and tissue concentration–time profiles of cisplatin following single intravenous administration at a dose range of 3–10 mg/kg for mice (12 data sets) and 2–5 mg/kg for rats (4 data sets) were extracted from the literature. A whole-body physiologically-based pharmacokinetic model (PBPK) was constructed, and included plasma, kidneys, liver, lungs, spleen, gut, heart, skin, muscle, and brain compartments. In this model, cisplatin (parent drug) undergoes conversion to mobile (Pt bound to molecules that can easily traverse cell membranes, k1i) and fixed (Pt bound to any macromolecules, k2i) metabolites in all compartments (Figure 1). The biotransformation rate constant for conversion of fixed to mobile metabolite k3 was assumed to be equal in all tissues. Renal clearances were fixed to GFR. Estimation of the rate constants (k1i) for formation of mobile metabolite was based on a series of assumption, which results in a simplified estimation of k1i = R * k2i, where R and k2i were individually estimated. Physiological parameters, such as organ volumes and plasma flow rates were fixed to literature values.
Results: The PBPK model allowed for a good simultaneous description of plasma and tissues data for cisplatin and parameters were estimated with sufficient precision. The estimate for k2i ranged from 0.11 (brain) to 70.60 (kidney). Plasma and tissue k3 values were estimated as 0.021 and 0.0024. The ratio of k1i and k2i was estimated as 1.22.
Conclusions: PBPK modeling framework for evaluating cisplatin biodisposition has been developed and allowed for capturing prolonged half-life of total Pt in all tissues. The model will be further utilized for investigation of efficacy and toxicity of cisplatin formulations in animals and for predicting tissue disposition in humans using interspecies scaling approaches.

Fig. 1 Schematic presentation of the biotransformation and elimination pathways of Pt complexes in kidney
W-065
Clinical regimens of Favipiravir (FAV) inhibit Zika virus (ZIKV) replication in the Hollow Fiber Infection Model (HFIM)
Xun Tao* (1), Camilly P. Pires de Mello* (2), Tae Hwan Kim (1), Michael Vicchiarelli (2), Jürgen B. Bulitta (1), Ajeet Kaushikc (3), Ashley N. Brown# (2)
(1) Center for Pharmacometrics and Systems Pharmacology, Department of Pharmaceutics, College of Pharmacy, University of Florida, Orlando, Florida, USA, (2) Institute for Therapeutic Innovation, Department of Medicine, College of Medicine, University of Florida, Orlando, Florida, USA, (3) Center for Personalized Nanomedicine, Institute of Neuroimmune Pharmacology, Department of Immunology, Herbert Wertheim College of Medicine, Florida International University, Miami, Florida, USA
Objectives: Our primary goal was to investigate FAV activity against ZIKV on human origin host cells with a traditional plate (static FAV) and latest HFIM (static and dynamic FAV) system. As the second objective, we sought to develop a mechanism-based mathematical (MBM) model using static FAV assay data, and then prospectively validate the model by predicting the results from the dynamic FAV PK scenario in the HFIM.
Methods: HUH-7 cells were used as host cells in plate and HFIM systems. Two fold escalation of FAV from 31.25 µM to 500 µM were studied. A translational MBM utilizing SADAPT-TRAN was developed to characterize the time course of ZIKV burden in both assay formats. The MBM was then utilized to predict virologic outcome when PK profiles associated with clinically FAV regimens simulated in HFIM.
Results: Favipiravir displayed substantial inhibition on ZIKV replication in both assays. The clinical achievable concentration of 250 µM suppressed viral burden by at least 99%, and 500 µM suppressed by at least 99.9%. Our MBM successfully described the viral dynamics data under static FAV condition (r = 0.970, population fits). PK profiles associated with clinically relevant FAV regimens were simulated in HFIM. The anti-viral activity was predicted by our MBM model and then studied in HFIM. Predicted viral burden profiles excellently matched the observed data. The maximum extent of inhibition was 99.9% for the low (Influenza) and 99.99% for the high (Ebola) dose regimens.
Conclusions: We have demonstrated that clinically utilized FAV regimens hold great promise as a therapeutic strategy to treat ZIKV. Moreover, to our knowledge, the developed MBM is the first to successfully characterize the drug effect in the plate and HFIM assays while considering the virus and host cell dynamics. The novel MBM model will facilitate future studies for FAV against ZIKV.

W-066
Meta-analysis of non-compartmental PK parameters to evaluate the effect of UGT1A9 polymorphism on ertugliflozin exposure
Yali Liang1, Vaishali Sahasrabudhe1, Thomas Tensfeldt1, Daryl James Fediuk1, Susan Zhou2, Rajesh Krishna2, Vikas Kumar Dawra1*, Jean-Claude Marshall1, Kevin Sweeney1
1Pfizer, Inc, Groton, CT, USA; 2Merck & Co Inc, Kenilworth, NJ, USA.
*At the time when the analysis was conducted.
Objectives: Ertugliflozin is a selective and potent inhibitor of sodium glucose co-transporter 2 (SGLT2) that was recently approved in the USA and EU for the treatment of patients with type 2 diabetes mellitus (T2DM). Metabolism via glucuronidation (mainly by UGT1A9) is the major clearance pathway for ertugliflozin. The effects of three UGT1A9 polymorphisms—UGT1A9*3, UGT1A9*1b (also referred as UGT1A9*22) and UGT1A9-2152 on ertugliflozin exposure were evaluated.
Methods: AUC results from 417 healthy subjects who participated in 20 Phase 1 studies were included in the analysis. A structural model was developed to describe the relationship between ertugliflozin AUC and dose, with UGT1A9 genotype information added as covariates to the model multiplicatively to construct the full model. The effects of UGT1A9 polymorphism on AUC were evaluated using the full model approach and the estimated effects were used to simulate the range of resultant exposures for different genotypes of UGT1A9.
Results: Ertugliflozin AUC increased about 10% [95% confidence interval (CI): 3, 17] for subjects expressing the UGT1A9*3 heterozygous variant, and decreased about 6% [1, 11] for subjects expressing the UGT1A9*1b heterozygous variant relative to UGT1A9 wild type subjects. The UGT1A9-2152 heterozygous variant and UGT1A9 *1b homozygous variant did not have a significant effect on ertugliflozin AUC. The largest change in ertugliflozin AUC was observed in the subjects expressing the UGT1A9*3 heterozygous variant with population predicted AUC [90% CI] of 485 ng.hr/mL [458,510] and 1560 ng.hr/mL [1480,1630] for the 5 and 15 mg ertugliflozin dose, respectively, relative to the UGT1A9 wild type subjects with population predicted AUC of 436 mg.hr/mL [418, 455]. Overall, the mean effects of these allelic variants on ertugliflozin AUC were within ± 10% of the wild type.
Conclusions: UGT1A9 polymorphism did not have any clinically meaningful effects on ertugliflozin AUC in healthy subjects.
W-067
Bayesian pharmacometric analysis for dose recommendation in edoxaban pediatric program
Yaming Su, Michael Melino, Brigitte Lebeaut and Ophelia Yin
Daiichi-Sankyo Inc., Basking Ridge, NJ, USA
Objectives: Edoxaban as a direct inhibitor of FXa has been approved for the prevention of stroke and systemic embolism in adult patients with atrial fibrillation and for the treatment of venous thromboembolism. This analysis is to establish a population pharmacokinetics (PopPK) model for edoxaban in patients at age 2 to < 18 years, and to conduct simulations for dose selection in pediatric trials.
Methods: The ongoing edoxaban pediatric trials contain 5 cohorts (12 to < 18; 6 to < 12; 2 to < 6 years; 6 months to < 2 years; and 38 weeks gestation to < 6 months) that are sequentially enrolled from the oldest to youngest age groups. Due to the sequential design, limited sample size and sparse PK samples, a Bayesian based approach (implemented in Stan® with R package Torsten) was used. Briefly, a PopPK model established in adults was modified to fit edoxaban PK data in 12 to < 18 years; the resultant model was then extrapolated for dose simulations in 6 to < 12 years. These modeling and simulation steps were repeated in an iterative manner using emerging PK data from each age cohort. Currently evaluation of the first 3 cohorts was completed.
Results: A two-compartment model with first-order absorption with lag time and linear elimination adequately describe edoxaban PK profiles in pediatrics. Apparent clearance and volume of distribution are associated with body weight by allometric exponents of 0.75 and 1, respectively. To achieve similar edoxaban exposure in adults receiving edoxaban 60 mg QD, the proposed dose regimen is fixed dose (45 and 60 mg for body weight of 30 to < 60 and ≥ 60 kg, respectively) for 12 to < 18 years, 1.2 and 1.4 mg/kg for 6 to < 12 and 2 to < 6 years, respectively.
Conclusions: A Bayesian based approach was successfully implemented for PopPK analysis and dose selection in edoxaban pediatric trials.
W-068
Preclinical PK/PD modeling of tumor growth inhibition for a first-in-class Porcupine inhibitor WNT974 and translation to patients
Yan Ji, Tao Ji, Youzhen Wang, Margaret McLaughlin, Chun Li and Andrea Myers
Novartis Pharmaceutical
Objectives: To characterize the PK/PD relationship of tumor growth inhibition for WNT974, a first-in-class Porcupine inhibitor targeting the Wnt pathway, in xenograft mouse tumor models and evaluate the translatability to advanced cancer patients.
Methods: PK and tumor growth inhibition of WNT974 were evaluated following oral administration of 5–40 mg/kg in nude mice harboring KRAS: RNF43-mutant HPAF-II pancreatic cancer xenografts, or 0.1–5 mg/kg in nude mice harboring MMTV-Wnt1 mammary tumor allografts. PK was described by one-compartment models with Michaelis–Menten or linear clearance. Tumor growth inhibition was described by exponential models with first-order growth inhibited by WNT974 concentration and first-order killing. PK and antitumor activity of WNT974 was evaluated in a Phase I trial in advanced cancer patients.
Results: The tumor growth and death rate in HPAF-II and MMTV-Wnt1 tumors were estimated to be 0.0166 and 0.0118 h−1, and 0.0212 and 0.0071 h−1, respectively, and IC50 of tumor inhibition by WNT974 was 880 and 48.6 ng/mL, respectively, and the tumor stasis concentration (TSC) was 36.5 and 9.94 nM unbound WNT974, respectively. The mean steady-state average concentation (Cavg,ss) in patients following oral administartion of 10 mg QD (recommended dose for expansion) was 9.80 nM unbound WNT974.
Conclusions: The tumor growth inhibition was reasonably described by tumor kinetic PK/PD models. The higher sensitivity of MMTV-Wnt1 tumors to WNT974 (4-fold lower TSC than HPAF-II) is likely due to the fact that the primary driver of tumorigenesis in this model is overexpression of Wnt1, whereas HPAF-II tumors have an oncogenic KRAS mutation in addition to a Wnt pathway mutation in RNF43. Cavg,ss at 10 mg QD in patients is approximately 4-fold lower than the TSC in the HPAF-II model, suggesting that 10 mg QD WNT974 may not result in significant tumor shrinkage in human tumors harboring oncogenic MAPK pathway alterations in addition to Wnt pathway alterations.
W-069
Quantitative systems pharmacology model of glucocorticoid-induced TNFR-Related protein (GITR)-mediated T cell dynamics in mouse tumor micro environment
Yan Ji1, Deborah A Knee1, Kumpal Madrasi2, Joshua Apgar2, Lore Gruenbaum2 and Bruce Gomes1
1Novartis Pharmaceutical; 2Applied Biomath
Objectives: To develop a quantitative systems pharmacology (QSP) model of the anti-GITR agonist antibody, murine DTA-1 (mDTA-1), to describe the kinetics of intratumoral regulatory T cells (Tregs) and effector T cells (Teffs) in Colon26 and A20 syngeneic mouse tumor models.
Methods: Serum mDTA-1 exposure and sGITR levels were measured in Colon26 tumor bearing mice following a single intravenous (iv) dose of 0.3, 1, 3, 10 or 15 mg/kg of mDTA-1, and intratumoral Treg and Teff profiles were determined at 5 mg/kg. In A20 tumor bearing mice, serum mDTA-1 exposure and sGITR levels were measured at a single intraperitoneal (ip) dose of 15 mg/kg of mDTA-1, and Treg and Teff profiles were determined at 1 and 5 mg/kg. The mDTA-1 pharmacology and T cell physiology were described by ordinary differential equations based on the numbers and characteristics of tumor infiltrating lymphocytes and the composition of the tumor microenvironment (TME). The model was developed based on published data and validated by comparing with observed data. Modeling and simulation were conducted using MATLAB SimBiology.
Results: A QSP model was developed that adequately described the time profiles of intratumoral Treg and Teff, serum mDTA-1 and sGITR in Colon26 and A20 tumor models. It contained 3 compartments (plasma, peripheral tissue and tumor ISF), 52 species, 104 reaction equations and 190 parameters. It captured Teff immune checkpoint, Treg depletion by ADCP induced by binding of mDTA-1 Fc to FcγRIV on macrophages, and Teff proliferation and differentiation into cytotoxic T lymphocytes (CTLs). The model was able to describe the response differences between the two tumor models.
Conclusions: A QSP model was developed to predict Treg and Teff dynamics in TME in two syngeneic mouse models following adiministration of anti-GITR agonist antibody. It provides a quantitative understanding of the trade-off between maximizing Treg depletion vs. Teff agonism.
W-070
Longitudinal exposure–response analysis of CDAI score in rheumatoid arthritis patients treated with sirukumab
Yan Xu, Ph.D.1, Chuanpu Hu, Ph.D.1, Yanli Zhuang, Ph.D.1, Benjamin Hsu, M.D.2, Zhenhua Xu, Ph.D.1, Amarnath Sharma, Ph.D. 1, and Honghui Zhou, Ph.D.1
1Global Clinical Pharmacology; 2Immunology Clinical Development, Janssen Research and Development, LLC, Spring House, PA USA
Objective: To characterize the exposure–response (E-R) relationship of sirukumab, an anti- interleukin-6 human monoclonal antibody, in the treatment of rheumatoid arthritis (RA), a longitudinal exposure–response modeling analysis was conducted using clinical disease activity index (CDAI), a composite score measuring RA disease activity.
Methods: Analysis was conducted using pooled data from two pivotal phase 3 trials of sirukumab in RA patients who were inadequate responders to non-biologic disease modifying antirheumatic drugs (DMARD-IRs) or anti-tumor necrosis factor α (anti-TNF-IRs). A total of 26,095 CDAI observations from 2176 patients who received subcutaneous administration of either placebo or sirukumab 50 mg every 4 weeks or 100 mg every 2 weeks were included in the analysis. CDAI was defined as the sum of Swollen 28-Joint count, Tender 28-Joint count, Patient Global Disease Activity and Evaluator’s Global Disease Activity. A sequential PK/PD modeling approach was employed leveraging results from a population PK analysis. A semi-mechanistic indirect response model with an inhibition of disease production rate by serum sirukumab concentrations was used to describe the time course of CDAI.
Results: Diagnostic plots indicated that the model fitted the data well. External model validation using phase 2 data demonstrated reasonable model performance. The IC50 estimate was 0.294 µg/mL. The model indicated a lower baseline CDAI in Asian patients or patients with methotrexate use, and a greater maximum sirukumab effect on CDAI in DMARD-IRs compared to anti-TNF-IRs, and in Asians compared to non-Asians. Other covariates, including body weight, were not found to significantly influence the CDAI change. These results were consistent with the sirukumab E-R modeling for American College of Rheumatology (ACR) response criteria and 28-joint disease activity score (DAS28).
Conclusions: A population E-R model characterized the CDAI response of sirukumab in RA patients and supported the dose recommendations in RA patients.
W-071
Population pharmacokinetics of interferon-γ 1b in children and young adults with Friedreich’s ataxia disorder
Ye Xiong1, Min Dong1,3, Tsuyoshi Fukuda1,3, Amy Grahn2, Julie Ball2, Alexander Vinks1,3
1Division of Clinical Pharmacology, Cincinnati Children’s Hospital Medical Center, Cincinnati, OH, USA 2Horizon Pharma, Inc, Deerfield Lake Forest, IL, USA 3Department of Pediatrics, University of Cincinnati College of Medicine, Cincinnati, OH, USA
Background: Interferon (IFN)-γ 1b has been investigated in a Phase III trial for treating Friedreich’s Ataxia (FA), an autosomal recessive neurodegenerative disorder. IFN-γ 1b is an 18 kDa protein dosed TIW at 100 μg/m2 subcutaneously. On subcutaneous administration, small proteins (< 20 kDa) are taken up by nearby blood and lymphatic capillaries, and often exhibit non-linear absorption and restricted distribution. This study intended to develop a population pharmacokinetic (PK) model to describe IFN-γ 1b disposition in FA patients.
Methods: PK analysis of IFN-γ 1b using nonlinear mixed effects modeling was performed based on 171 concentrations from 26 subjects (age 10–25 years) in the trial (ClinicalTrials.gov: NCT02415127). Different absorption models (transit, empirical, mechanistic pathways) were explored. Demographic and laboratory information was included in the covariate analysis. Different body metrics including body surface area (BSA), total body weight (TBW), fat-free mass (FFM) using allometric scaling were compared to identify the best predictive descriptor.
Results: A one-compartment model with first-order and zero-order parallel absorption best described the IFN-γ 1b data in FA patients. BSA, TBW, and FFM significantly decreased (19%) between-subject variability in clearance and volume of distribution (Vc/F). FFM, which accounts for sex differences in body composition, was a slightly better predictor (0.01 < p<0.05) of variability in Vc/F. As a clinically available covariate, BSA was selected in the final model. This choice was supported by model validation which showed comparable predictive performance without bias compared to FFM as a covariate.
Conclusion: A model with parallel first-order and zero-order absorption processes mechanistically portrays the collateral entry of IFN-γ 1b into the central compartment via a direct uptake into the blood and a slow drainage from the lymph. BSA was selected as the body metric by both model validation and clinical applicability. Our analysis is an example of PK modeling considerations for a small protein drug administered subcutaneously.
W-072
The development of population pharmacokinetic model and a R shiny app for CSL689 in subjects with FVII deficiency
Ying Zhang1, John Roberts1, Ly Minh Nguyen2, Michael A Tortorici1, Ronish B Desai3, Sachin Sanduja3, Jagdev Sidhu4
1Clinical Pharmacology and Translational Development, CSL Behring, King of Prussia, PA, USA; 2Department of Pharmaceutical Sciences, SUNY at Buffalo, Buffalo, NY, USA; 3Rudraya Corporation, North Brunswick, NJ, USA; 4Clinical Pharmacology and Translational Development, CSL Limited, Parkville, Australia.
Objectives: rVIIa-FP (CSL689) is a recombinant fusion protein, linking coagulation factor VIIa with albumin, for the treatment and prophylaxis of bleeding in subjects with congenital FVII deficiency, including perioperative settings. A population PK (popPK) model was developed from the Phase I studies in adult FVII deficiency subjects, to simulate and select appropriate on-demand/surgery/prophylactic dose regimens in adults and adolescents for the Phase II study. An R Shiny application (app) was also developed, which generates and displays the simulation results for various dosing scenarios in real-time, facilitating more rapid and well-informed decision-making.
Methods: A popPK analysis was performed in NONMEM using data with a total of 38 PK subjects from studies CSL689_1001 and CSL689_1002. Goodness of fit and visual predictive check was used for model evaluation. An interactive Shiny app was created using R packages (Shiny and mrgsolve) to simulate and plot the simulation results for FVIIa activity level for different dose levels and frequency of administration. The simulation results in Shiny were validated using NONMEM for selected regimens.
Results: The PK of CSL689 following IV administration was adequately described by a two-compartment model. Body weight was a significant covariate on both clearance and volume of distribution. The final popPK model was implemented in R Shiny app, which can efficiently simulate FVIIa activity in a population of subjects in a dynamic, real-time fashion. Dose, frequency, patient population, PK parameters and body weight distribution were included as readily adjustable inputs to the simulation.
Conclusions: FVIIa activity was well-described by a 2 compartment PK model and is appropriate to conduct single and multiple dose simulations for dose selection in future studies. The R Shiny app supported performing those simulations quickly and dynamically, facilitating more efficient decision-making.
W-073
Population pharmacokinetics of vixotrigine in healthy volunteers (HV) and patients with trigeminal neuralgia (TN), painful lumbosacral radiculopathy (PLSR) and erythromelagia (EM)
Yuan Zhao1, Ivan Nestorov1, Howard Bockbrader2, Fiona Forrestal3, Simon Cleall3, Sunny Chapel4, Himanshu Naik1
Clinical Pharmacology and Pharmacometrics, Biogen, Cambridge, MA 2 BEPanalyses, Ann Arbor, MI 3 Biostatistics, Biogen, Cambridge, MA4 Ann Arbor Pharmacometrics group, Ann Arbor, MI
Objectives: Vixotrigine is a voltage- and use-dependent Nav1.7 channel blocker currently under development for treatment of various neuropathic pain. The objective of this work was to develop a population pharmacokinetic (PK) model for vixotrigine and assess effects of various covariates on PK of vixotrigine.
Methods: Plasma concentration–time data from 12 Phase 1 and 2 studies obtained following administration of single (75–825 mg) or multiple doses (150–450 mg BID or TID) of vixotrigine in HV (9 studies) and patients with TN, PLSR or EM were included in the analysis. A two-compartment PK model was evaluated as the base structural model. The inclusion of selected covariates was assessed using stepwise backward elimination approach (α = 0.001) once base model was developed. The predictive ability of the model was evaluated using a posterior predictive check (PPC). The final model was used to evaluate the effect of statistically significant covariates on exposure of vixotrigine.
Results: A total of 10,263 PK samples from 465 individuals were included in the analyses. The PK of vixotrigine was adequately described by a two-compartment model with two transit absorption compartments and linear elimination. The predictability of the model was also established by PPC whereby most of the observed concentrations were within 90% prediction interval. The final model included covariates of age, body weight (WT) and carbamazepine co-administration on clearance (CL/F), WT on central volume of distribution (V2/F), food on absorption rate constant (Ka), and formulation and Japanese race on bioavailability (F). None of the covariates identified had clinically relevant effect as the change in exposure (AUC and Cmax) was within ± 25%. There are no notable differences between the exposure of vixotrigine in HV and patients with TN, PLSR and EM.
Conclusions: Developed PK model well characterizes PK of vixotrigine in HV and patients with TN, PLSR or EM.
W-074
Receptor binding informed QSP modeling to design and rationally optimize synergistic, oral double β-lactam combination therapy against resistant Escherichia coli
Yuanyuan Jiao, Xun Tao, Bartolome Moya, Dhruvitkumar S. Sutaria, Stefanie K. Drescher, Jürgen B. Bulitta*
Center for Pharmacometrics and Systems Pharmacology, Department of Pharmaceutics, College of Pharmacy, University of Florida, Orlando, FL, USA
Objectives: There is an urgent need for oral therapy against common, community-onset infections by extended spectrum β-lactamase (ESBL) producing E. coli. This approach allows us to spare valuable intravenous carbapenem antibiotics. We hypothesized that simultaneous inactivation of multiple penicillin-binding proteins (PBP) can yield synergistic killing and evaluated novel drug combinations involving three oral β-lactam antibiotics.
Methods: In vitro static concentration time-kill studies (SCTK) were conducted in the multidrug-resistant, ESBL-producing E. coli strain ST131. The PBP2-binding mecillinam (MEC) and two PBP1a/1b targeting cephalosporins (including cefaclor, CEF; and another cephalosporin, Ceph), as well as their 2- or 3-drug combinations were systematically studied. A quantitative and systems pharmacology (QSP) model was developed based on experimental PBP binding affinities in the S-ADAPT software (v1.57, importance sampling algorithm) using SADAPT-TRAN.1 The QSP model was combined with the published clinical pharmacokinetic models in Berkley Madonna (v8.3.18). This allowed us to in silico predict the antibacterial effect of clinically relevant dosage regimens.2,3
Results: All 2- and 3-drug combinations exhibited synergistic bacterial killing and minimized regrowth in SCTK; while monotherapies showed none or little effect. The MEC + Ceph combination achieved more killing and better suppressed regrowth than the MEC + CEC combination. The QSP model well captured the bacterial killing and regrowth for the treatment groups (Figure). Monte-Carlo simulations at clinical relevant doses suggested that the proposed oral combination regimen (MEC + Ceph, 200 mg/200 mg, q8 h) exhibited 3 log10 bacterial killing within 8 h and inhibited bacterial regrowth until 24 h.
Conclusion: Informed by molecular receptor binding data, QSP modeling and simulation facilitated the design and optimization of oral combination therapy. The oral combination of MEC + Ceph (200 mg/200 mg, q8hr) holds great promise to treat multidrug-resistant E.coli infections which are common in the community setting and warrants further evaluation.

W-075
Comparison of different approaches to modeling early tumor size dynamics for accurate prediction of survival in non-small cell lung cancer (NSCLC) clinical trials
Yuri Kosinsky1, Ivan Azarov1, Lulu Chu2, Gabriel Helmlinger2, Kirill Peskov1, Sergey Aksenov2
1M&S Decisions LLC, Moscow, Russia; 2IMED Biotech Unit, AstraZeneca Pharmaceuticals
Objectives: A standard measure of tumor size in oncology trials is the sum of longest diameters (SLD) of pre-identified target lesions. We investigated predictive accuracy of different modeling approaches for linking tumor size dynamics and patient survival in NSCLC trials.
Methods: Gefitinib studies IPASS and INTEREST data were used as a training dataset to develop joint models comprised of a nonlinear mixed-effects model of tumor size dynamics and Weibull model for overall survival, including contribution from the longitudinal covariate SLD. Estimation of model parameters was conducted using the SAEM algorithm of Monolix 2016R1. Prediction of survival was performed for additional study data (IFUM, IMPRESS, IDEAL1). Study-level simulated survival probability distributions were compared to observed survival data using the long-rank test Z-score.
Results: The empirical dependence between individual values of the growth rate parameter and the decline rate parameter in the “exponential-linear” SLD model was constructed from individual estimates in the training dataset. Using this “prior” information significantly improved accuracy of SLD dynamics prediction based on limited early SLD data (up to 3 months). We simulated survival under 3 scenarios: (1) model with only baseline covariates: line of treatment, ECOG state, baseline SLD, EGFR mutation status and the joint model using SLD as a longitudinal covariate, without (2) or with (3) “prior” information about the growth rate parameter. The scenario 3 showed the best predictive accuracy along the additional studies (Figure 1).
Conclusions: Modeling of tumor size dynamics improves predictivity of survival models by accounting for prognostic information above and beyond baseline patient covariates. Using information about rate of tumor growth from prior studies improved extrapolation accuracy of SLD models fitted to limited early longitudinal SLD data, and thereby improved accuracy of survival predictions.

Fig. 1 Overall survival simulations of IFUM study under 3 scenarios.
W-076
Direct activation of CD8+T cells in the context of amodiaquine-induced liver injury advances groundwork for mathematical representation of idiosyncratic drug-induced liver injury (iDILI)
Zackary Kenz1, Christina Battista1,2, Lisl K.M. Shoda1
1DILIsym Services, Inc., a Simulations Plus Company, Research Triangle Park, NC, 2UNC Eshelman School of Pharmacy, The University of North Carolina at Chapel Hill, Chapel Hill, NC
Objectives: Idiosyncratic DILI (iDILI), or rare reactions developing independent of drug dose, is poorly understood and thus difficult to avoid. Some iDILI events appear immune-mediated based on delays between treatment initiation and DILI onset and more rapid injury with drug re-challenge. We are developing a mathematical representation of immune-mediated DILI to synthesize available data into a quantitative framework for improved understanding of contributing mechanisms and potential identification of mitigation strategies.
Methods: We utilize a quantitative systems toxicology (QST) approach to develop a mechanistic model (Figure 1) of well-characterized CD8+T cell responses to hepatocyteexpressed ovalbumin (OVA) [1]. This model was then adapted to represent amodiaquine administration in order to reproduce CD8+T cell mediated DILI in an animal model [2].
Results: Simulated hepatocyte OVA expression leads to activation of naïve OVA-specific CD8+T cells. Activated T cells undergo regulated differentiation to effector, memory, or exhausted T cells. T cell cytotoxicity induces apoptosis in antigen-presenting hepatocytes, with resultant ALT release. Total CD8+T cell counts and ALT profiles are consistent with data. Simulated amodiaquine administration leads to amodiaquinederived neoantigen presentation and activation of AQ-specific CD8+T cells. ALT profiles are matched to the animal model data, providing insight into the regulators that control the underlying AQ-specific T cell response, relative to the better characterized OVA-specific T cell response.-
Conclusions: The mechanistic model provides the groundwork for quantitative insight into the role of antigen and other key regulators on T cell mediated liver injury. These findings set the stage for further systematic investigation of immune-mediated DILI.

Fig. 1 Diagram indicating the life cycle model for CD8+T cells. Circulating T cells can distribute to an aggregate “other” tissue compartment or to the liver. T cells in the liver follow blood vessels (sinusoids) through the liver acinus (i.e., functional unit of the liver), which is divided into periportal (PP), midlobular (ML) and centrilobular (CL) zones. Antigen-driven activation and sequelae can occur in any zone. For clarity, only the PP zone is depicted. Naïve T cells which are not activated in the liver return to the greater blood pool.
References
-
1.
Ochel A, et al. Cell. and Mol. Immun. 2016;13(6):805–815.
-
2.
Alastair Mak and Jack Uetrecht. Chem Res Toxicol. 2015 Aug 17; 28(8):1567–73.
W-077
A platform physiologically based pharmacokinetic (PBPK) model for different-size protein therapeutics
Zhe Li1 and Dhaval K. Shah1
Department of Pharmaceutical Sciences, School of Pharmacy and Pharmaceutical Sciences, The State University of New York at Buffalo, Buffalo, NY
Objectives: A priori predicting plasma PK of different-size protein therapeutics remains challenging. Traditional modeling strategy requires model fitting to the data on drug-by-drug basis. Here we have developed a bottom-up platform PBPK model to a prior predict plasma PK of different size protein therapeutics in mice. More importantly, all parameters used in the model were a priori derived and no data fitting was performed.
Methods: The structure of the PBPK model was based on our previously published antibody PBPK model. The effect of molecular size on tissue extravasation and renal elimination were quantitatively described in the model using the “two-pore theory” and previously published relationship between GFR and protein size. Model predictions were compared with literature reported plasma PK profiles of 8 different proteins in mice (i.e., IgG, scFv-Fc, F(ab)2, minibody, scFv2, Fab, scFv and nanobody), which had molecular weights ranging from 13 kDa to 150 kDa.
Results: The model predicted plasma PK profiles of all 8 classes of proteins agreed well with literature data. The relationship between protein size and several important “two-pore theory” related parameters (i.e., reflection coefficient, Peclet number, permeability-surface area product) were simulated using the model. The relative contribution of diffusive and convective transportation across vascular endothelial membrane for different-size proteins was simulated. Model predicted clearance of all 8 classes of proteins agreed well with NCA calculated CL values from the literature.
Conclusion: The bottom-up protein PBPK model was able to a priori predict plasma PK of 8 different size proteins without the need of model fitting. This model could serve as a platform for incorporating drug and system specific properties, and also for clinical translational of protein therapeutics.
W-078
Population pharmacokinetics (PopPK) guided dose selection of TAF in HIV-infected children
Sneha V. Gupta, Sophia R. Majeed, Ya-Pei Liu, Hiba Graham, Cheryl Pikora, Anita Mathias, Shringi Sharma
Gilead Sciences, Inc., Foster City, CA
Objectives: Both tenofovir alafenamide (TAF) and tenofovir disoproxil fumarate (TDF) are prodrugs of tenofovir (TFV). TAF however, provides higher intracellular concentrations of active metabolite TFV-diphosphate, and lower plasma TFV levels compared to TDF (approved in children ≥ 2 years for HIV treatment). TAF-containing fixed-dose combinations (FDC) have been examined in global pediatric clinical trials. PopPK was used to evaluate a simplified dosing regimen of emtricitabine/TAF 200/25 mg with boosted or unboosted third agents (F/TAF ± booster) for children ≥ 25 kg.
Methods: Pooled TAF and TFV data in HIV-infected children ≥ 25 kg (n = 172) from ongoing studies of TAF-containing FDCs were used for PopPK analyses. TAF and TFV exposures (AUC24h) were estimated based on PopPK models in NONMEM (v7.3) and R (v3.3.2). Simulations were conducted in children ≥ 25 kg receiving F/TAF 200/25 mg ± booster. TFV exposure versus safety relationships were evaluated for selected endpoints (change from baseline for height-age adjusted spine/total body less head Z-scores and eGFRschwartz).
Results: TAF and TFV PK were best described by a 2-compartment model with zero order input, first order absorption and elimination, and covariates of baseline creatinine clearance (BCLCRSW), weight on CL/F and Vc/F, effect of boosting agent on D1 and F1. For TFV, BCLCRSW was also included on Vc/F. Simulated TAF and TFV exposures following F/TAF 200/25 mg ± booster were within the range of exposures in adult HIV Phase 3 population and lower than median TFV (median AUC 2360 h*ng/mL) in HIV-infected children 6 to < 12 years receiving TDF. Further, exposure-safety (E-R) analysis showed a greater decline in the safety parameters at higher TFV exposures associated with TDF compared to TAF.
Conclusion: PopPK models adequately described TAF and TFV exposures in HIV-infected pediatric population across various TAF-based regimens. Simulations and E-R analysis support evaluation of a simplified F/TAF dosing regimen in children ≥ 25 kg.
W-079
Development of a multiscale model for heart failure focusing on cardiac myosin modulators
Spyros K Stamatelos1, Ruth Abrams1, Eric Sobie4, Laurence Lucats3, Howard Surks2, Xen Giannakoulopoulos2, Karim Azer1
1Quantitative Systems Pharmacology, Sanofi US, Bridgewater NJ, 2Translational Medicine and Clinical Pharmacology, Sanofi US, Bridgewater, NJ, 3Cardiovascular & Metabolism, Sanofi, Paris, France, 4Mount Sinai School of Medicine, New York, NY.
Objectives: Cardiac myosin modulation through small-molecule interventions is a novel approach to impact contractility in heart failure conditions without affecting calcium homeostasis. A multiscale clinical QSP modeling approach has been developed to describe the influence of drug intervention in the actin-myosin cycle and how it propagates across scales.
Methods: The multiscale model bridges numerous methodologies integrating sub-cellular, cellular, tissue and organ-level approaches. The complete model includes a system of coupled ordinary differential equations using mass action kinetics and a mechanical description of excitation and force transduction in the heart. Specifically, mass-action kinetics implementation is used to simulate the drug-induced actin-myosin modulation and its linking to an established electrophysiology model describing calcium dynamics in every heartbeat. Finally, the QSP heart failure platform is composed of established models to describe sarcomere/heart mechanics and to account for preload/afterload conditions of the heart.
Results: We have been able to describe physiological and pathophysiological conditions of the heart cycle focusing on dilated cardiomyopathy (DCM). The QSP model has been calibrated across scales and is able to simulate the effect of cardiac-myosin activation in contractility utilizing as an example the publicly available clinical trial data for omecamtiv mecarbil. Comparisons of efficacy and toxicity are provided across heart rates and variable preload/afterload conditions.
Conclusions: The wealth of scientific knowledge in the field of cardiology allows the generation of these multiscale mathematical models which can account for granularity which is sparse in other therapeutic areas. Thus, mechanistic heart failure QSP modeling can be utilized to simulate various in silico scenarios across cardiomyopathy conditions in order to assess the therapeutic index of pharmacological agents and compare drugs of similar mode of action.
W-080
Uridine diphosphate glucuronic acid is a potential rate-limiting factor in the metabolism of morphine during the first week of life
Tao Liu Ph.D.1, Tamorah Lewis M.D. Ph.D.2, Jason Moore Pharm.D.3, Walter Kraft M.D.3, Estelle Gauda M.D.2, David Sartori Ph.D.4, Jogarao Gobburu Ph.D. MBA FCP1, Vijay Ivaturi MS, Ph.D.1*
1Center for Translational Medicine, School of Pharmacy, University of Maryland, Baltimore, 2Department of Pediatrics, Division of Neonatology, Johns Hopkins Medical Institutions 3Department of Pharmacology and Experimental Therapeutics, School of Medicine, Thomas Jefferson University 4Department of Pathology, School of Medicine, Johns Hopkins University
Objectives: To quantify and explain the postnatal age (PNA) dependent metabolism of morphine in neonates after oral administration.
Methods: Morphine plasma concentrations were collected from three clinical trials in neonates with abstinence syndrome after oral administration of morphine for pharmacotherapy. Briefly, a three compartment PK model of morphine with body weight (WT) based allometric scaling (AS) and developmental ontogeny (post menstrual age (PMA) effect on CL and PNA effect on volume of distribution) was developed in neonates after intravenous administration of morphine. Further, based on the data collected from the three clinical trials, bioavailability and CL were estimated simultaneously with an additional PNA-dependent maturation effect.
Results: Totally, 397 morphine plasma samples were collected in 81 neonates from the three clinical trials. With the WT and PMA effect on morphine clearance, model evaluation further suggested a PNA-dependent (not PMA-dependent) 50% lower glucuronidation activity in neonates during the first week of life. At the same time, we also observed bilirubin (UGT 1A1 substrate) concentration was increasing during the first week of life, and then decreasing. Coincidentally, propofol (UGT 1A9 substrate) and zidovudine (UGT 2B7 substrate) were all reported a 50% reduction in clearance during the first week of life. Across different substrates and UGT enzymes, uridine diphosphate glucuronic acid (UDPGA) is the only common factor in the glucuronidation activity. UDPGA concentration-dependent glucuronidation activity in human hepatocytes has been reported based on an in vitro study.
Conclusions: UDPGA might be responsible for the lower glucuronidation activity during the first week of life.
References
Liu, T et al. J. Clin. Pharmacol. 1009–1018 (2015).
Allegaert, K. et al. Br. J. Anaesth. 99, 864–870 (2007).
Moodley, D. et al. J. Clin. Pharmacol. 41, 732–41 (2001).
W-081
Quantitative analysis of the relationship between CSF asparagine and whole blood asparaginase in elderly patients with acute lymphocytic leukemia with philadelphia chromosome-negative that received GRASPA and polychemotherapy.
Tina Checchio1, Iman El Hariry2, Cecilia Fosser1, Frank Hoke2
1Cytel, Inc., Cambridge, MA, USA; 2Erytech Pharma, Inc., Cambridge, MA, USA.
Objectives: L-asparaginase (ASNS) is a component of multi-agent chemotherapy for the treatment of acute lymphoblastic leukemia (ALL). GRASPA is a dispersion for infusion for ASNS encapsulated in red blood cells. The mechanism of action is the depletion of asparagine (ASN). However, ex vivo degradation of plasma ASN limits its usefulness as an indicator of activity thereby preventing an understanding of the relationship between ASNS and ASN and clinical relevance. Therefore, ASN concentrations in cerebral spinal fluid (CSF) were explored as a surrogate endpoint of activity enabled by the equilibrium between CSF and plasma ASN levels.
Methods: A model was constructed to describe the relationship between whole blood ASNS (WBC ASNS) and CSF ASN. Data from a Phase IIa trial in 26 ALL patients were modeled with a decreasing linear relationship between WBC ASNS and log-transformed CSF ASN. The model was used to determine how increasing concentrations of WBC ASNS reduce CSF ASN.
Results: Model-estimated, population mean CSF ASN levels were 7.1 IU/L (90% CIs: 5.81, 8.58 IU/L) at baseline. The predicted WBC ASNS needed to reduce CSF ASN by 50% and 90% were 615 IU/L (90% CIs: 526, 752 IU/L) and 1107 IU/L (90% CIs: 947, 1353 IU/L), respectively. Furthermore, the data contained several WBC ASNS concentrations of approximately 500 IU/L, and above, that were associated with CSF ASN concentrations that were below detection.
Conclusions: There is a quantifiable decreasing relationship between WBC ASNS and CSF ASN, suggesting that CSF ASN may be an appropriate surrogate endpoint of GRASPA activity. Targeting ASNS concentrations ≥ 500 U/L are expected to yield clinical activity.
W-082
Population pharmacokinetic modeling of MEDI8897, an extended half-life monoclonal antibody (mAb), and dose prediction in preterm and full-term infants to prevent lower respiratory tract infection due to respiratory syncytial virus (RSV)
Vadryn Pierre, M. Pamela Griffin, Kathryn Shoemaker, Therese Takas, Manasa Tatipalli, Xuyang Song, Rajesh Narwal, Anis A. Khan
MedImmune, Gaithersburg, MD, USA
Objectives: MEDI8897 is being developed as an extended half-life mAb to protect infants through an entire RSV season with a single intramuscular (IM) dose. This analysis aims to determine the recommended dose which could maintain serum MEDI8897 levels above the 90% effective concentration (EC90) target (6.8 μg/mL from a preclinical cotton lung rat model) in infants for a 5-month RSV season.
Methods: Two single-ascending dose studies [1, 2] (Phase 1, healthy adults: 18–60 years, n = 102; Phase 1b/2a, premature infants: gestational age [GA] 32 to < 35 weeks, n = 71) with IM/IV (Phase 1) or IM (Phase 1b/2a) doses ranging from 10 to 3000 mg provided N = 1716 serum PK concentrations for a pooled analysis using NONMEM. Dense (adults) and sparse (preterm infants) PK samples were collected for up to 360 days. Model performance and qualification was performed using bootstrap, numerical and visual predictive checks approaches. The final population PK model was used to simulate MEDI8897 PK exposures in virtual preterm and term infants up to 8 months old and weighing up to 10 kg encountering their first RSV season.
Results: A two-compartment linear model including allometrically-scaled clearance and volume, and the impact of maturation and growth on PK adequately described MEDI8897 PK. A modest between-subject variability of 26, 31, and 50% was observed for clearance, central volume of distribution and rate of absorption, respectively. Following a single 50 mg IM dose, over 80% of virtual infants are predicted to have sustained 5-month serum PK exposure above the target EC90.
Conclusion: Accounting for the effects of age, maturation, and body weight on PK, this analysis supports 5-month sustained exposure of MEDI8897 following a single fixed 50 mg IM dose in the simulated population of infants for anti-RSV prophylaxis entering their first RSV season.
References
-
1.
Griffin, MP (2017). AAC, 61(3).
-
2.
Domachowske, JB (2018). PIDJ, 1. doi:10.1097
W-083
Generalizable systems pharmacology model of bispecific T-cell engager (BiTE®) antibody constructs: case study of blinatumomab (CD19/CD3) in non-Hodgkin lymphoma (NHL) patients
Vaishali L Chudasama1, John M Harrold2, Cedric Dos Santos3, Dan Rock2, Roman Kischel4, Matthias Klinger4, Murad Melhem1
1CLINICAL PHARMACOLOGY, MODELING AND SIMULATION, 2PHARMACOKINETIC, AND DRUG, METABOLISM (PKDM), 3CBDD, 4PKDM ARM
Introduction: The objective of the current work is to develop a Quantitative Systems Pharmacology (QSP) platform model that integrates mechanism of action for BiTE® antibody constructs using phase 1 clinical data from NHL patients treated with blinatumomab (CD19/CD3 BiTE®).
Methods: A mathematical model (Figure 1) based on BiTE® mechanism of action and target tumor cell death upon treatment was developed to describe dynamics of key players: CD3+ T-cells, CD19+ (tumor) B-cells, and T-cell activation. The model incorporated the hallmarks of BiTE mechanisms: synapse formation, T-cell activation, T-cell margination, T-cell recycling and serial killing, and target cell death. Synapse formation was assumed to be the driver for the downstream cascade in the model leading to efficacy and/or safety events while T-cell margination was modulated by activated T-cells. Data from a Phase 1 dose range-finding blinatumomab study (n = 74) in NHL were used to calibrate and validate the model. All modeling and simulations were performed using MATLAB®.
Results: The model reasonably described the observed data. Parameters associated with T-cell margination (e.g., demargination rate constant: 1.54 d1), T-cell activation (e.g., T-cell activation amplification: 0.72), and synapse threshold (EC50: 500 synapses/cell) were comparable across different patients and consistent with reported physiological values. Sensitivity analysis revealed that 2–3 fold change in synapse threshold has a minor impact on T-cell and target cell dynamics. As expected, parameters associated with target cell and T-cell proliferation were identified as most sensitive parameters among patients. The model assumes 80% of T-cells recycle following synapse separation.
Conclusions: The current model based on BiTE® pharmacology reasonably characterized temporal profiles of CD3+ T-cells, CD19+ B-cells, and T-cell activation. This model will be further extended to integrate a population modeling framework which then can be utilized to optimize dosage regimens, understand cytokine release syndrome, and potential combination therapies.

Fig. 1 Model Schematic
W-084
Incorporating cell cycle inhibition and cytokine stimulation to inform the construction of a neutropenia systems model
Wenbo Chen1, Britton Boras2, Jenny Zheng2, Yanke Yu2, Diane Wang2, Mary E. Spilker2, David D’Argenio1
1Department of Biomedical Engineering, University of Southern California, Los Angeles, CA, USA; 2Pfizer, Inc., San Diego, CA, USA.
Objectives: Neutropenia is a dose-limiting hematological toxicity associated with a number of anti-cancer therapies, including cell cycle inhibitors. To better predict neutropenia, we report a physiologically-based model that incorporates the neutrophil maturation process, the mechanism of action (MOA) of a neutropenia support therapy, and the MOA of anti-cancer agents.
Methods: The model was constructed through a ‘top-down’ elaboration of a previously published model of pegfilgrastim’s granulopoietic effects [1]. A target-mediated drug disposition model was added to allow for the competitive interaction of pegfilgrastim and endogenous granulocyte colony stimulating factor (G-CSF). Palbociclib, a representative cell cycle inhibitor was used for model development. To represent the action of palbociclib, a cell cycle model including G1, S, G2/M phases was added to the mitotic hematopoietic progenitor cells. Finally, to mechanistically account for neutrophil loss from circulation, a vascular margination component was incorporated. Model development used measurements from a subset of previously published palbociclib patient data [2], plasma neutrophils following pegfilgrastim [1], and parameter values derived from various literature sources.
Results: The final model described the concentrations of pegfilgrastim in the serum as well as band and segmented neutrophils in whole blood with various doses of pegfilgrastim as reported in [1]. Additionally, the cell cycle components in the model described the time course of the absolute neutrophil counts (ANC) in the patients during treatment with palbociclib. The model was used to simulate ANC time profiles for patient subpopulations following palbociclib, with and without G-CSF therapy.
Conclusions: A systems model of neutropenia has been developed and evaluated using previously reported literature data together with the ANC response in patients receiving palbociclib. This model can serve as a framework for investigating neutropenia under different therapy combinations and dosing regimens.
References
-
1.
Roskos et al. J Clin Pharmacol 2006; 46:747–757.
-
2.
Sun et al. J Clin Pharmacol 2017; 57:1159–1173.
W-085
Population pharmacokinetics of eliglustat in patients with Gaucher Disease Type 1 (GD1)
Qiang Lu1, Yue Gao1, Jing Li1, Vanaja Kanamaluru1
1Sanofi, Bridgewater, NJ
Objectives: To develop a population pharmacokinetic (PopPK) model of eliglustat, a glucosylceramide synthase inhibitor approved as a first-line treatment for GD1 adults, and evaluate sources of PK variability in GD1 patients.
Methods: A Pop PK model was developed using data from healthy volunteers (HV) and GD1 patients who were CYP2D6 poor (PM), intermediate (IM), extensive (EM) or ultrarapid (URM) metabolizers and received oral (42 to 127 mg) or intravenous (42 mg) eliglustat. Potential covariates (age, weight, sex, creatinine clearance [≥ 26.6 mL/min], liver function tests such as albumin [33–54 g/L], AST, ALT and bilirubin [≤ 2 times the upper limit of normal], subject type, repeated dosing, CYP2D6 phenotype and concomitant CYP inhibitors) were evaluated using stepwise forward selection and backward elimination. The model was validated by visual-predictive check.
Results: Eliglustat PK was described by a 2-compartment model with a zero order input and a first-order absorption and linear elimination. The impact of CYP2D6 phenotype, repeated dosing, and coadministration of CYP2D6 or CYP3A inhibitor on eliglustat bioavailability (F) was significant. Compared to CYP2D6 EMs, F was higher in PMs and lower in CYP2D6 URMs, the magnitude being greater after repeated dosing than first dose. F was higher after coadministration with paroxetine or ketoconazole. CYP2D6 phenotype impacted eliglustat clearance (CL), with higher CL in EMs and URMs compared to PMs. CL was 37% higher in HV compared with GD1 patients. Eliglustat central volume increased with increasing body weight. Other tested covariates had no effect on eliglustat PK.
Conclusions: The PopPK model described eliglustat PK in GD1 patients and allowed prediction of eliglustat exposure after first administration and steady state by CYP2D6 phenotype. Consistent with its metabolic pathway, eliglustat bioavailability increases with decrease in CYP2D6 metabolizing capacity, repeated dosing, and coadministration of CYP2D6 or CYP3A inhibitor, reflecting the effect on first-pass metabolism.
Disclosures: This study was sponsored by Sanofi. Qiang Lu, Yue Gao, Jing Li, and Vanaja Kanamaluru are employees of Sanofi and may hold stock and/or stock options in the company.
W-086
Population pharmacokinetic (Pop PK) analysis of sargramostim to support dose recommendation for hematopoietic syndrome of acute radiation syndrome (H-ARS) in adults
Yue Gao1, Qingxiang Lin2, Eileen Doyle1, Gary Emmons1, Vanaja Kanamaluru1, Qiang Lu1
1Sanofi, Bridgewater, NJ; 2University at Buffalo, Buffalo, NY
Objectives: To develop a Pop PK model of sargramostim (a recombinant human granulocyte macrophage colony-stimulating factor, Partner Therapeutics, Inc., Lexington, MA) to support dose recommendation in adults with H-ARS under the Animal Rule1.
Methods: A Pop PK model was developed using pooled data from 99 healthy adult subjects in 2 single subcutaneous (SC) dose studies with intensive sampling. Potential covariates (sex, age, weight, body surface area [BSA], race) were evaluated using stepwise forward selection,backward elimination and the final model was validated by visual predictive check. Sargramostim exposures were simulated in a virtual population of 500 adults after a single SC dose of 7 µg/kg equivalent to 250 μg/m2 (70 kg adult with 1.96 m2 BSA) approved for other indications and compared to observed efficacious exposures in total body-irradiated non-human primates (NHPs), the H-ARS animal model. Based on the pattern of neutrophil response in irradiated NHPs and in humans receiving sargramostim after myelosuppressive chemotherapy, sargramostim exposures greater than the efficacious exposures in NHPs were targeted for adults with H-ARS.
Results: Sargramostim PK was described by a one-compartment model with linear elimination and first-order absorption with delay. The main source of intrinsic PK variability was body weight, with lower body weight associated with higher PK exposure. Simulations indicated that sargramostim exposures arising from a 7 µg/kg dose in adults exceed the efficacious Cmax (97.6% of patients) and AUC (100% of patients) in NHPs, and are therefore expected to provide sufficient pharmacodynamic activity to treat humans exposed to myelosuppressive doses of radiation.
Conclusions: A Pop PK model was developed to describe sargramostim PK in adults. Model-based simulations supported the recommendation of a 7 µg/kg sargramostim SC dose in adults with H-ARS under the Animal Rule.
Acknowledgements: This project has been funded with Federal funds from the Office of the Assistant Secretary for Preparedness and Response, Biomedical Advanced Research and Development Authority, under Contract No. HHSO100201300005I.
Disclosures: Eileen Doyle, Yue Gao, Gary Emmons, Vanaja Kanamaluru and Qiang Lu are employees of Sanofi and may hold stock and/or stock options in the company. Qingxiang Lin is a student at the University at Buffalo.
Reference
-
1.
21 CFR 601.90–601.95 (Subpart H): Approval of Biological Products when Human Efficacy Studies are Not Ethical or Feasible
W-087
Development of guidelines to efficiently choose and diagnose target-mediated drug disposition models
Geraldine Ayral (1), Jonathan Chauvin (1)
(1) Lixoft, Antony, France
Objectives: A large variety of TMDD models have been proposed in the literature, corresponding to different modeling assumptions [1,2]. Yet, it is often difficult to decide which TMDD approximation is the most appropriate for a given data set. In this poster, we present guidelines to choose an appropriate model in a minimal number of iterations, using both a priori information and a posteriori diagnostic plots.
Methods: To identify a priori information, we performed an exhaustive sensitivity analysis of the most common TMDD models. To identify a posteriori information, data sets simulated from several TMDD models where fitted with the correct and alternative models to determine the most informative diagnostic plots and how to interpret the observed patterns.
Results: Besides prior information on parameter values (such as the KD), the shape of the free ligand concentration is a key element to a priori determine which parameters are identifiable and which not. We provide a summary scheme with clear guidelines to choose a first model. Concerning model diagnosis, the following plots/outputs have been found especially informative: underparametrized models often display trends in the residuals and the random effects versus dose covariate scatterplots. On the opposite overparametrized models can be detected thank to a high condition number and large correlations between population parameter estimates. Interactive simulation applications, such as Mlxplore, help to visually understand the non-identifiability and guide the choice of another model.
Conclusion: With the development of TMDD model libraries, the testing of several TMDD models to model a data set has been simplified. Using a combination of model simulations, parameter sensitivity analysis and fits on simulated data, we have developed guidelines to efficiently choose and diagnose TMDD models.

Reference
-
1.
Mager & Jusko (2001). JPP, 28(6).
-
2.
Dua, Hawkins, & van der Graaf (2015). CPT, 4(6).
W-088
Exposure–response analysis of avelumab in patients with advanced urothelial carcinoma via a full-model approach
Yulia Vugmeyster1, Juliane Manitz1, Junyuan Xiong1, Galit Rosen1, Vishnu Sharma1, Ana Novakovic2, Berend Neuteboom1, Satjit Brar3, Carlo Bello3, Pascal Girard4, Akash Khandelwal2
1EMD Serono, Billerica, MA, USA; 2Merck KGaA, Darmstadt, Germany; 3Pfizer, La Jolla, CA, USA; 4Merck Institute for Pharmacometrics, Lausanne, Switzerland.
Objectives: Avelumab is an anti–PD-L1 IgG1 antibody approved in the United States and other countries for treatment of platinum-treated advanced urothelial carcinoma (UC) and metastatic Merkel cell carcinoma. We present an exposure–response (E-R) analysis of avelumab in patients with UC.
Methods: The analysis included 249 patients with post-platinum/cisplatin-ineligible UC who received avelumab 10 mg/kg every 2 weeks (q2w) and had ≥ 6 months of follow-up. To derive exposures (e.g., area under the curve [AUC]) for E-R analysis and minimize impact of posttreatment effects on the derived exposures,1 a population PK model was developed using first-cycle data only from 1827 avelumab-treated patients. Logistic regression was used to assess the relationship between AUC and best overall response (BOR). Cox proportional hazard models were used to assess the relationships between AUC and progression-free survival (PFS) or overall survival (OS). Covariate modeling (including demographic, laboratory, and disease-specific factors) was performed via a full-model approach.
Results: Imbalance of covariates was observed across the exposure quartiles (e.g., baseline hemoglobin and PD-L1 expression levels). A shallow E-R relationship was observed for BOR, PFS, and OS vs AUC (g h/L). The odds or hazard ratios for BOR, PFS, and OS models were 1.014 (1.013–1.205), 0.95 (0.92–0.99), and 0.91 (0.87–0.94), respectively. Sensitivity analysis after exclusion of 1 patient resulted in AUC being a nonsignificant covariate in the BOR model.
Conclusions: Although a shallow E-R relationship was observed, definite conclusions cannot be made on the impact of avelumab exposure and identified covariates on efficacy due to covariate imbalance and single-dose regimen data used to develop the model. Importantly, the exposure achieved with the approved avelumab dosing of 10 mg/kg q2w is associated with a manageable safety profile as well as clinically meaningful and durable responses in patients with UC.
Reference
-
1.
Liu C, et al. Clin Pharmacol Ther. 2017;101:657–666.
W-089
A mechanism-based model to describe the emergence of resistance in response to treatment with polymyxin B (PMB), fosfomycin, and meropenem against carbapenem-resistant Klebsiella pneumoniae (CRKP) using an in vitro dynamic infection model (IVDIM)
John K. Diep1, Estefany Garcia1, Ahmed O. EL-Sheikh1, Gauri G. Rao1*
1UNC Eshelman School of Pharmacy, Chapel Hill, NC
Objectives: The emergence of multi-drug resistant pathogens, such as CRKP, necessitates optimizing antibiotic therapy to preserve the utility of our last-line agents. The objective of this study was to develop a mechanism-based model capable of describing the effect of PMB, fosfomycin, and meropenem on bacterial killing and emergence of resistance.
Methods: A one-compartment IVDIM [1] was employed to evaluate clinically relevant regimens of PMB (1.5 mg/kg q12 h), fosfomycin (8 g q8 h), and meropenem (2 g q8 h) as mono- and combination therapy against CRKP (initial inoculum ~ 107cfu/mL). Bacteria were quantified at various time points over 72 h. Population analysis profiles (PAPs) were conducted to evaluate resistance by quantifying viable bacteria grown on antibiotic-containing plates (PMB 2, 8, and 32 mg/L; fosfomycin 16, 32, and 128 mg/L) daily. All data (total population and subpopulation) were co-modeled using maximum likelihood estimation in ADAPT5 [2].
Results: The model (Fig. 1) incorporates four bacterial subpopulations: one susceptible (CFUS) and three with differing resistance levels (CFUR1, CFUR2, CFUR3; resistance of R3 > R2 > R1) determined by PAPs. Bacterial replication was described by a saturable function. Antibiotic effect was described by linear stimulation of the natural bacterial death rate (kd) with reduced drug effect on more resistant subpopulations. The model well-captured the data (overall r2 = 0.97). Parameters were estimated with good precision (SE < 25%). The model predicted the total bacterial population to become resistant to all monotherapies beyond 24 h and to combination therapy (fosfomycin plus PMB or meropenem) beyond 48 h, and suppressed resistance over 72 h with PMB plus meropenem.
Conclusions: This model describes the time-course of bacterial killing and emergence of resistance by utilizing quantified subpopulation data from PAPs. This model will assist in the design of future in vitro and in vivo experiments aimed at optimizing therapy to suppress resistance over longer durations.

References
-
1.
Diep J.K. et al. Antimicrob Agents Chemother.2017Jan 24;61(2)
-
2.
D’Argenio D.Z. et al. BMSR. 2009.
W-090
Comparison of two population pharmacokinetic models characterizing letermovir pharmacokinetics separately in healthy subjects and patients
Craig Fancourt1, Carolyn Cho1, Anders Viberg2, Marita Prohn2, Kevin Dykstra2, Sreeraj Macha1
1Merck & Co., Inc., Kenilworth, NJ, USA; 2qPharmetra, Andover, MA, USA.
Objectives: Letermovir is indicated for prophylaxis of cytomegalovirus (CMV) infection and disease in adult CMV-seropositive recipients of an allogeneic hematopoietic stem cell transplant (HSCT). The population pharmacokinetics (popPK) of letermovir in healthy subjects and HSCT patients were characterized using separate models: a Phase 1 popPK model [1] described letermovir non-linear and time-varying PK in healthy subjects for doses of 30–960 mg SD/MD PO/IV, using a 4-compartment model with saturable clearance and induction, saturable distribution, and transit-compartments for absorption; a Phase 3 popPK model [2] described letermovir PK at steady-state in HSCT recipients at the clinical dose of 480 mg QD (240 mg with cyclosporin) using a 2-compartment model with linear elimination and lagged absorption. We compare the PK parameters estimated with these two models for both populations, at the Phase 3 dose at steady-state.
Methods: Steady-state PK in healthy subjects following 480 QD IV/PO dosing was simulated using the Phase 1 model. NCA was used to summarize CL and F and compared to the Phase 3 final model parameters. In addition, letermovir PK in healthy subjects were estimated using the Phase 3 structural model.
Results: The table shows that the post-absorption clearance and distribution PK parameters estimated using the Phase 1 model or the Phase 3 model for healthy subjects are similar to the output with the final Phase 3 model.
Conclusions: The Phase 1 and 3 popPK models sufficiently explained letermovir PK in healthy subjects and HSCT patients, respectively. This sensitivity analysis showed that these models performed similarly when evaluated at the clinical dose at steady-state, indicating that the post-absorption distribution profiles and absolute clearance were similar in both populations.
Table Comparison of letermovir PK parameters estimated using different models and populations
Parameter* | Phase 1 Pop PK Final Model Simulation** Healthy Subjects with 480 mg IV/PO MD | Phase 3 Pop PK Model Parameters Development Phase 1 Healthy Subjects Steady-State Subset (n = 37) | Phase 3 Pop PK Model Parameters Final Phase 1 Healthy Subjects (n = 37) and Phase 2/3 Patients (n = 363) |
|---|---|---|---|
F healthy | 0.89 (0.88–0.91)*** | 1**** | 1**** |
F patient | – | – | 0.346 (0.278–0.42) |
ka healthy (1/h) | – | 1.53 (1.00–2.06) | 1.26 (0.933–1.71) |
ka patient (1/h) | – | – | 0.150 (0.104–0.215) |
CL (L/h) | 5.02 (4.95–5.10) | 4.32 (3.76–4.88) | 4.84 (4.30–5.45) |
Q (L/h) | – | 1.48 (1.07–1.89) | 1.54 (1.17–2.04) |
V1 (L) | – | 18.0 (16.34–19.66) | 19.7 (17.6–22.1) |
V2 (L) | – | 16.3 (11.67–20.93) | 25.8 (19.1–34.9) |
References
-
1.
Prohn M, et al. J Pharmacokinet Pharmacodyn. 2017;44:S106.
-
2.
Viberg A, et al. ASM Microbe 2017.
W-091
A Comparison of Pharmacometrics Simulation Platforms
Craig Fancourt*, Pratik Bhagunde, Wei Gao
Merck & Co., Inc., Kenilworth, NJ USA
Objectives: A growing number of pharmacometric simulation software platforms are available [1, 2]. We aim to identify, evaluate, and compare the features of widely used simulation platforms for advanced pharmacokinetic (PK) and pharamacodynamic (PD) models, identifying key features for addressing relevant questions in drug development.
Methods: A search was conducted for simulation platforms under active development, including beta versions, that can be purchased or licensed (including proprietary, free, and/or open source licenses). Their key features were identified by searching the documentation, exploring the software, and querying the developers. The features were divided into three classes: basic, intermediate and advanced. Basic features include the capability of simulating arbitrary PK/PD models, with structural specification of an analytical or ordinary differential equation (ODE) model, with arbitrary dosing and sampling schedules from any compartment. Intermediate features include the capability of simulating non-linear mixed effects models, including inter-individual, residual, and inter-occassion variability, covariates, and parameter uncertainty. Advanced features include built-in functions for importing models or parameters, results visualization, parallelization, advanced modeling, and clinical trial simulations.
Results: Seven widely-used PK/PD simulation platforms were identified and evaluated: Berkeley Madonna, mrgsolve, NONMEM, PKPDsim, RxODE, Simulx, Simulo. The evaluation results are summarized in the Table.
Conclusions: Different simulation platforms have different strengths, and no single platform encompasses all possible features. Therefore, in selecting a platform, its set of features should be matched to the intended use and the questions to be answered. Other factors include the future development of both the model and the platform, financial constraints, and subjective factors including individual preferences and the expected learning curve. This comparison could help pharmacometricians select the most appropriate platform(s) for their projects.
Table Comparison of pharmacometric simulation platforms
Features | Berkeley Madonna | mrgsolve | NONMEM | PKPDsim | RxODE | Simulx (mlxR) | Simulo |
|---|---|---|---|---|---|---|---|
Platform | |||||||
License | PTY | GLP 2/3 | PTY | MIT open | GLP 2/3 | PTY | PTY |
Shell Language | GUI | R | OS | R | R | R | GUI |
Model Language | STELLA | R/C ++ | NM-TRAN | R string | R/C | MlxTran R | R |
Simulator Engine and Language | C | ODEPACK LSODA C ++ | F | Boost C ++ | DOP853/C LSODA/F | C ++ | deSolve R |
Basic | |||||||
Std PK Models | P | 1–2 CPT | 1–3 CPT, MM | 1–2 CPT, MM | 1–3 CPT, TC | 1–3 CPT MM, TC | LIB |
Std PD Models | P | LIB | P | P | P | S, P | LIB |
CL/Rate Switch | P | P | Y | P | Y | Y | Y |
Dose Schedule | P | Y | Y | Y | Y | Y | Y |
Sample Schedule | P | Y | Y | Y | Y | Y | Y |
Intermediate | |||||||
IIV | P | Y | Y | Y | Y | Y | Y |
RV | P | Y | Y | Y | Y | Y | Y |
IOV | P | P | P | P | Y | Y | Y |
Covariates | P | Y | P | Y | Y | Y | Y |
Uncertainty | S | S, P | P | P | Y | Y | Y |
Advanced | |||||||
Model Import | N | Y | Y | N | S | Y | Y |
Visualization | Y | Y | S | Y | Y | Y | Y |
Parallelization | N | P | Y | P | Y | Y | Y |
Modeling | P | P | Y | S | S | Y | Y |
Clinical Trial | N | P | N | N | N | Y | Y |
References
-
1.
Park. Transl Clin Pharmacol. 2017 Sep;25(3):125–133.
-
2.
Penzenstadler et al. ACOP7. W-42. 2016.
W-092
Bayesian Methods – A Comparison of Stan, NONMEM NUTS, and NONMEM BAYES
Casey Davis
Merck & Co., Inc.
Objectives: Bayesian methods provide an infrastructure to coherently incorporate information from previous experiments and/or expert knowledge and a natural probabilistic interpretation of uncertainty. Despite these advantages, Bayesian methods are not commonly used in PK and PK/PD modeling partially as an artifact of the computational difficulties present in the past. With the increase in computational power and software available to implement Bayesian methods, implementation is easier and more efficient than ever. Stan and NONMEM are two of the most powerful softwares available to the PMX community. In the last few years, Stan has implemented the No U-Turn Sampler (NUTS) to perform MCMC sampling. This samples from the posterior more efficiently than the Gibbs samplers and Metropolis–Hastings algorithms that NONMEM’s BAYES method uses. The release of NONMEM 7.4 brings the ability to use NUTS into NONMEM. The goal here is to compare the results and efficiency of Stan, NONMEM NUTS, and NONMEM BAYES.
Methods: Population data from a two-compartment model with oral absorption and inter-individual variability was simulated, with identical models fit with each of the three methods. Results from the analysis of a real world dataset were also compared. Analysis of convergence of the MCMC algorithms and accuracy and precision of the estimates were also compared.
Results: The convergence to and sampling from the posterior distribution of the NUTS algorithm in both NONMEM and Stan is more efficient than the Gibbs sampler and Metropolis–Hastings algorithm implemented by NONMEM BAYES. The root mean squared errors (RMSEs) for NONMEM NUTS and Stan are similar, with slightly higher RMSEs for NONMEM BAYES.
Conclusions: Both NONMEM NUTS and Stan provide a solid platform to perform Bayesian inference on PopPK models. Stan has a more flexible environment for incorporating prior information, with more distributions available to specify the priors.
References
mc-stan.org, NONMEM Users Guides
W-093
a SimBiology-based GUI tool for QSP modeling and simulation in drug development
Iraj Hosseini1,*, Justin Feigelman1,*, Anita Gajjala2, Saroja Ramanujan1, and Kapil Gadkar1
1Genentech Inc., South San Francisco, CA 2Mathworks Inc., Consulting Services, Natick, MA
*IH and JF are co-first authors.
Objectives: To introduce a graphical-user-interface (GUI) platform to perform various QSP modeling and simulation (M&S) capabilities for SimBiology-built models.
Methods: We developed gQSPSim, a comprehensive GUI-based Matlab app to perform QSP M&S capabilities. The building blocks in gQSPSim include 1) Task: an experimental condition corresponding to a particular treatment, dose, schedule and species, 2) Virtual Population: a set of parameter values and initial conditions, 3) Acceptance Criteria: a pre-specified range that virtual patients must satisfy, 4) Optimization Dataset: data used to estimate parameter values, and 5) Parameter file: a list of model parameters with their initial estimates and bounds. The capabilities include 1) simulating a combination of tasks and virtual populations, 2) generating a virtual cohort satisfying the acceptance criteria and 3) estimating parameter values using the optimization datasets. QSP models are developed simultaneously in SimBiology for building the model structure, doses, variants, rules, and reactions and in gQSPSim for simulation, parameter optimization and virtual cohort generation.
Results: The application and features of gQSPSim are demonstrated using 1) a standard target-mediated drug disposition (TMDD) model, and 2) ERK Signaling pathway for BRAF V600E-mutant colorectal cancer [1]. We showcase how the modeler can define tasks according to experimental conditions and run simulations using virtual populations. We perform parameter estimation using Scatter Search and Particle Swarm Optimization methods and use gQSPSim to compare calibrated model outputs with those from the initial parameter estimates. Then we use acceptance criteria to generate virtual cohorts under different scenarios and provide visual diagnostic tools to evaluate virtual patients against the pre-specified range of measurements.
Conclusions: Our work provides a user-friendly GUI platform for co-development of QSP models in SimBiology and gQSPSim, which standardizes the methodology used in QSP model development and facilitates transfer and sharing of models.

Fig. 1 A screenshot of gQSPSim. The tree structure on the left shows the building blocks and QSP M&S capabilities saved in the session file. On the right, the outcome of an example virtual population generation is shown where the PK and PD profiles of virtual patients are compared with the range of measurements provided in the acceptance criteria file.
Reference
-
1.
Kirouac DC, et al. NPJ systems biology and applications. 2017; 3(1):14.
W-094
Comparison of parallel computing performance between NONMEM and NLMX library
Ji-Jin Lee MS1, Min-Gul Kim, MD PhD1,2
1Center for Clinical Pharmacology, Chonbuk National University Hospital, Jeonju, Republic of Korea; 2Department of Pharmacology, School of Medicine, Chonbuk National University, Jeonju, Republic of Korea.
Objectives: In nonlinear mixed effect modeling, objective function value (OFV) is just the sum of each individual OFVs. Because each individual OFV is independent of all other individual OFVs, individual OFV can be calculated using parallel processing. After NONMEM version 7.2, parallel computing was applied to OFV calculation step using MPICH2, which is a high performance and widely portable implementation of the Message Passing Interface (MPI) standard for parallel computing. We recently developed nlmx library, which is open-source fortran library for nonlinear mixed effect modeling. The nlmx library supports parallel processing using OpenMP. The aim of this research is to compare of parallel computing performance between NONMEM and nlmx library.
Methods: The test environment consisted of Intel(R) Xeon(R) CPU E5-2697 v2 @ 2.70 GHz (12 cores/24 threads) * 2 CPU with 64 GB DDR3 memory. GNU gfortran version 4.8.5 fortran compiler on CentOS 7.3 x86_64 was used for the computation of NONMEM 7.4.1 and nlmx library. In nlmx library, “OBJ” subroutine is parallelized. (“OBJ” subroutine is a function to calculate OFV (sum of each individual OFVs). To analysis of performance of parallel processing, one-compartment PK model with first-order absorption with THEO dataset, which has 132 observations from 12 subjects (11 observations per subject following an oral administration of 320 mg theophylline), was used. Since the amout of original data is small, we increased the number of data 100 times, 500 times for sufficient testing. To compare various estimation methods, FO, FOCE, FOCE inter, LAPLACE, and LAPLACE inter methods were tested. We evaluate the parallelization performance using Amdahl’s law.
Results: Amdahl’s law shows how estimation time decreases as number of processors increases. The results of this study show that parallelization performance is lower in NONMEM than nlmx library.
Conclusions: This finding suggest that parallel processing of NONMEM may be improved.
W-095
NLMX: Open-source Fortran library for nonlinear mixed effect modeling
Ji-Jin Lee MS1, Min-Gul Kim, MD PhD1,2
1Center for Clinical Pharmacology, Chonbuk National University Hospital, Jeonju, Republic of Korea; 2Department of Pharmacology, School of Medicine, Chonbuk National University, Jeonju, Republic of Korea.
Objectives: The use of nonlinear mixed effect modeling in the drug development process help identify differences in drug safety and efficacy among population subgroups. NONMEM is most-widely used for nonlinear mixed effect modeling and is regarded as the gold standard pharmacometrics tool. Various estimation methods implemented in NONMEM remain a mystery for most users due to the complex statistical and mathematical derivations underlying the algorithm used in NONMEM. Moreover, it is not open-source software, so it is difficult to understand the algorithm of NONMEM. The objective of this research is to develop the open-source fortran library for nonlinear mixed effect modeling and to help to understand nonlinear mixed effect modeling algorithm.
Methods: The nlmx library was developed in the FORTRAN 90. OBJ subroutine calculates the objective function value based on first-order approximation (FO), first-order conditional estimation (FOCE/FOCEI), and LAPLACE methods. Lbfgsb.3.0 FORTRAN library, which is limited-memory quasi-Newton code for bound-constrained optimization developed by J.L. Morales and J. Nocedal, was used to minimize the objective function value. To validate the nlmx library, one-compartment PK model with first-order absorption with THEO dataset, which has 132 observations from 12 subjects (11 observations per subject following an oral administration of 320 mg theophylline), was used for comparing with the results of NONMEM.
Results: Results of NONMEM performed using FO, FOCE, FOCEI, and LAPLACE methods was used to compare to results of nlmx library. There was no difference between the estimates in nlmx library and NONMEM. There was no significant difference in estimation time between nlmx and NONMEM.
Conclusions: The nlmx library provides a convenient way of performing nonlinear mixed effect modeling. Moreover, it helps pharmacometricians to understand algorithm of nonlinear mixed effect modeling.
W-096
Interactive simulation and modeling software developed for identification and design of novel biotheraputics
Thomas Carpenter, Alice Zong, Songmao Zheng, Aman Singh, Chao Han, Weirong Wang, Donald Heald
Biologics Development Sciences, Janssen Biotherapeutics (JBIO), Janssen Research & Development, LLC
Objectives: Develop a software tool that can extend the utility of modeling and simulation towards real time exploration and communication of quantitative modeling, to empower identification of key biological characteristics to facilitate design of novel biotherapeutics.
Methods: Software tool developed in R using R-Shiny user interface. Mechanistic models are coded into multiple modules of the application describing how biotherapeutics might interact with targets and carry out their biological functions (e.g. biotherapeutics targeting membrane bound and soluble targets, multivalent biotherapeutics, CD3 redirecting bispecific agents). The interactive program allows users to define simulation parameters, execute multiple runs of simulations and review results in real time.
The software tool provides an efficient way to quantitatively explore the impact of drug molecular design. Simulation parameters, such as the biological target abundance and kinetics, antibody binding affinity to target and potency related parameters can be specified through a graphic user interface. The tool’s analytic routine iteratively solves the numeric model, tabulates simulation results and displays interactive tabular/graphical output.
Results: A software tool was developed which utilizes R and Shiny software packages to interactively explore the impact of key parameters relating to the design and development of biologic therapies.
Conclusions: R shiny based software tool was developed allowing for interactive simulation of models for exploration of drug-specific and system-specific parameters to guide biologic drug design and development. The simulation software provides important insights to identify and developed the best assets for advancement of our biologics pipeline.

W-097
Evaluation of the utility of a MATLAB and R-based workflow for the development of quantitative systems pharmacology (QSP) models
Victor Sokolov1, Artem Dolgun1, Kirill Zhudenkov1, Henning Schmidt2, Kirill Peskov1
1M&S Decisions, Moscow, Russia; 2IntiQuan, Basel, Switzerland
Objectives: The growing need for QSP modeling in the industry and in communication with regulators necessitates a standardized and seamless QSP workflow for data structuring, model development and assessment, and reporting [1]. We selected four packages in MATLAB and R environments and evaluated their utility through a comparison of the corresponding workflows, for three QSP models.
Methods: We evaluated the performance and capabilities of four packages: the MATLAB-based IQM toolbox; R-based mrgsolve; RxODE; and IQR. Three different QSP models with mechanistic details and nonlinear features were developed in all these packages, using study-level data.
Results: All packages use a highly flexible syntax and handle standardized ‘.csv’ datasets as inputs, to perform simulations of population and QSP models with varying degrees of complexity and design. The RxODE package was more than 10x faster in terms of solver speed, vs. the other four. However, lag times could not be incorporated in RxODE-type models, and only mrgsolve and IQR were able to incorporate regression parameters from the datasets. Both IQM and IQR packages incorporate parameter estimation tools which provided robust fitting against heterogeneous and complex study-level datasets, and automatically provide common model diagnostics, e.g., plots of observed vs. predicted, residuals, time profiles. IQR enables calculation of point-wise finite sample confidence intervals through likelihood profiling or via the Fisher Information Matrix.
Conclusions: The four packages could handle identical model structures and dataset files, as well as script-based workflows. While RxODE featured the fastest solver, only IQR provided robust parameter estimations with simultaneous analysis of structural identifiability and estimation of CI.

Fig. 1 QSP model development workflow
Reference
-
1.
Gadkar K, et al. CPT Pharmacometrics Syst Pharmacol. 2016 May;5(5):235–49. https://doi.org/10.1002/psp4.12071.
W-098
Immune system modeling deepens our knowledge on the role of regulatory T cells in humoral immunity to therapeutic proteins
Anisur Rahman1, Jatin Narula2, Timothy Hickling1
1Pfizer Inc., Andover, MA; 2Pfizer Inc., Cambridge, MA
Objectives: The goal of this study is to investigate the effect of regulatory T cells (Treg) on overall immunogenicity of therapeutic protein products. A framework for the prediction of immunogenicity using a mathematical model of the adaptive immune system has been published [1, 2] and in this study, we expanded the model by incorporating Tregs. The mechanism by which Tregs exert inhibition to humoral immunity is still debated and there are several possible mechanisms proposed in the literature [3] that we were able to test with the mechanistic model.
Methods: The multiscale mathematical model was constructed using Matlab Simbiology platform. For population simulation a) the MHCII allele frequency of North American population was obtained from the ‘dBMHC’ database b) pharmacokinetics parameters are obtained from a separate PK model and c) the model was run for 100 virtual patients.
Results: The mathematical model was setup for a proprietary monoclonal antibody, with or without considering the regulatory T cells in the system. Two types of Treg were considered: natural Treg (nTreg) and induced Treg (iTreg), and four different types of inhibition mechanisms by Treg were considered: inhibition by competition mechanism, inhibition by suppression of T cell activation, inhibition by increased DC death and inhibition by suppression of DC activation. Clinical trial ADA incidence data were used for model validation. Without considering the regulatory T cells contribution, the overall ADA incidence was predicted to be higher than the clinical incidence. After considering the Treg contributions, the model simulated ADA incidence was closer to the clinical data. The amount of ADA produced from either single or multiple doses of the drug shows that the inhibition is higher when the regulatory T cells increase the DC death or suppress the DC activation respectively.
Conclusions: This study shows that consideration of the regulatory T cells into the immunogenicity model can improve the model prediction and identify the important mechanism by which Treg may exert inhibition into the immune system and mediate immune tolerance. An important finding of the analyses is that the Treg mediated inhibition of the immune response is strongest when the contribution of Treg action on dendritic cells (DC) functions is included. This finding enables formation of hypotheses that can be tested using human PBMC in vitro assays.
Reference
-
1.
Chen X et al., (2014) CPT Pharmacometrics Sys. Pharmacol., 3, e133.
-
2.
Chen X et al., (2014) CPT Pharmacometrics Sys. Pharmacol., 3, e134.
-
3.
Vignali DAA et al., (2008) Nature Reviews: Immunology, 8, 523–532.
Change history
11 June 2021
A Correction to this paper has been published: https://doi.org/10.1007/s10928-021-09767-8
Additional information
The original online version of this article was revised: Table 1 and last paragraph below table 1 under the heading T-029 has been corrected.
Rights and permissions
About this article

Cite this article
Abstracts for the Ninth American Conference on Pharmacometrics (ACoP9). J Pharmacokinet Pharmacodyn 45 (Suppl 1), 3–134 (2018). https://doi.org/10.1007/s10928-018-9606-9
Published:
Issue Date:
DOI: https://doi.org/10.1007/s10928-018-9606-9