
Abstract
Liquid phase sintering (LPS) is a process for forming high performance, multiple-phase components from powders. It involves sintering under conditions where solid grains coexist with a wetting liquid. Many variants of LPS are applied to a wide range of engineering materials. Example applications for this technology are found in automobile engine connecting rods and high-speed metal cutting inserts. Scientific advances in understanding LPS began in the 1950s. The resulting quantitative process models are now embedded in computer simulations to enable predictions of the sintered component dimensions, microstructure, and properties. However, there are remaining areas in need of research attention. This LPS review, based on over 2,500 publications, outlines what happens when mixed powders are heated to the LPS temperature, with a focus on the densification and microstructure evolution events.
Introduction
Packed particles heated near their melting temperature bond together by sintering. As diffusion accelerates at higher temperatures, sintering is manifested by bonding between contacting particles. Sintering occurs over a range of temperatures, but is accelerated as the particles approach their melting range. It takes place faster as the particle size decreases, since diffusion distances are shorter and curvature stresses are larger. For solid-state sintering, it is appropriate to think of sintering with respect to the melting temperature. Snow sinters to form ice at temperatures near −15 °C, while alumina requires temperatures in excess of 1000 °C.
A widely applied variant relies on forming a liquid during the sintering cycle. Liquid phase sintering (LPS) is applied to alloys and composites that melt over a range of temperatures. In the typical situation, the solid grains are soluble in the liquid. This solubility causes the liquid to wet the solid, providing a capillary force that pulls the grains together. At the same time, the high temperature softens the solid, further assisting densification. High-diffusion rates are associated with liquids, giving fast sintering or lower sintering temperatures. Since the final product is a composite with customized properties, LPS is the dominant commercial sintering process.
Early uses of LPS involved firing ceramics with a glass bond. At high temperatures, the glass turns into a viscous liquid; early porcelain was a widely valued example. In some ceramic compositions, the liquid phase is a viscous glass, but for this treatment we refer to it as a liquid.
Important technical advances in LPS came in the 1930s with the development of several materials; cemented carbides (WC–Co), porous bronze (Cu–Sn), tungsten heavy alloys (W–Ni–Cu), copper steels (Fe–Cu–C), and cermets (TiC-Fe). Over the next 70 years, LPS processing spread to a diverse range of applications—oil well drilling tips, porcelain jacketed dental crowns, automotive valve seats, wire drawing dies, high-temperature bearings, electrical contacts, electronic capacitors, radiation shields, diesel engine turbochargers, electronic insulator substrates, golf clubs balance weights, ultrasonic transducers, electronic solders, and grinding abrasives, as examples.
The LPS mechanistic conceptualization started with the work of Price et al. [1]. Qualitative models emerged over the next 20 years based on observations from a variety of systems [2–7]. Cannon and Lenel [8] provided a qualitative conceptualization, while Kingery [9, 10] provided a quantitative treatment. A decade later Eremenko et al. [11] published a brief book on the subject and a more detailed treatment followed in 1985 [12]. The publication rate accelerated as applications emerged, and today articles on LPS and liquid phase sintered products exceed 100,000 contributions.
From these efforts emerge a conceptual view of the events taking place, as sketched in Fig. 1 for the case of two mixed powders. The solid grains undergo solid-state sintering during heating. Depending on the solid–liquid solubility relations, different microstructure evolution pathways are possible. The common situation is for the liquid to wet the solid. In this case, the newly formed liquid penetrates between the solid grains, dissolves the sinter bonds, and induces grain rearrangement. Further, because of solid solubility in the liquid, the liquid improves transport rates responsible for grain coarsening and densification. The surface energy associated with pores leads to their annihilation, while there is progressive microstructure coarsening and bonding to increase rigidity.

A schematic of the microstructure changes during LPS, starting with mixed powders and pores between the particles. During heating the particles sinter, but when a melt forms and spreads the solid grains rearrange. Subsequent densification is accompanied by coarsening. For many products there is pore annihilation as diffusion in the liquid accelerates grain shape changes that facilitates pore removal
The LPS events are ideal for densifying hard materials that cannot be fabricated using other manufacturing approaches. The WC–Co system is a prime example, where the eutectic at 1310 °C enables the bonding of micrometer size WC grains into a dense component, such as a drill or cutting insert.
Besides mixed powders, LPS is possible using alloy powders that partially melt to form a semisolid structure. This approach is used to sinter tool steels. In another variant, a transient liquid forms and dissolves into the solid over time. This is how mixed copper and tin powders are used to fabricate porous bronze bearings. Finally, there are systems where the solid and liquid are insoluble, such as W–Cu, so solid-skeleton sintering determines the densification rate. However, the common form of LPS is persistent LPS, where at the sintering temperature the solid is soluble in the liquid. On cooling, the liquid solidifies to produce a composite microstructure with tailored properties.
Microstructures and microstructure development
Typical microstructures
Microstructure is a signature of the material’s processing. The LPS microstructure is constantly evolving. After an initial transient, the overall scale of the microstructure increases with time, while the relations between phases vary only by a time-dependent scaling parameter. Indeed, a “final” microstructure is not seen in liquid phase sintered materials, so what is reported is a glimpse of the slowly evolving structure. With prolonged sintering, the terminal condition would consist of a single grain with an associated liquid, such as illustrated in Fig. 2 for 20 vol.% liquid and a 20° contact angle. Prior to reaching this terminal condition, the LPS microstructure is characterized by porosity, pore size, grain size, and distributions in most features.

An example of the terminal microstructure for LPS based on a minimum energy configuration. This simulation is for 80 vol.% solid (left) and 20 vol.% liquid (right) and a contact angle of 20°, where the liquid partially coats the solid crystal. The degree of coating depends on the contact angle. Another low energy terminal configuration consists of a liquid sphere located inside the solid sphere
During LPS, initial densification occurs because of the relatively rapid transport rates at the microstructure scale; solid interface motion is in the μm/s range [13], grain boundary penetration by liquids is in the μm/s range [14], and solid coarsening in the liquid is in the μm3/s range [15]. However, years are required to transform micrometer-sized particles into millimeter-sized grains, times much longer than used in practice. Even so, during a typical LPS cycle, hundreds to thousands of initial particles coalesce to form each final grain. After LPS, the microstructure consists of the solid grains with a solidified liquid network, and possibly residual pores. In some cases, the pores are retained for lubrication, frangibility, or filtration attributes. Thus, liquid phase sintered microstructures exist in several variants, as illustrated in Fig. 3, with differences in the amount, size, shape, and distribution of the phases. Accordingly, substantial performance differences result, especially in properties such as hardness, strength, and elastic modulus. This is especially true for the WC–Co cemented carbides [16, 17].

Three example microstructures after LPS: a tool steel, b cemented carbide, and c molybdenum disilicide–copper composite
Each phase in the LPS microstructure is characterized by shape and size distributions, and variations in the degree of connection. The greatest attention is devoted to the solid grain size. Coarsening gives a steady-state morphology that changes length scale as time progresses, as illustrated in Fig. 4. These two micrographs at the same magnification show a W–Ni–Cu composition after LPS for two times. The structures appear similar except for the difference in magnification.

These two micrographs of a 88 wt.% W heavy alloy with 15.4 wt.% Ni and 6.6 wt.% Fe were taken after two different hold times at 1500 °C, a 0 min and b 30 min. The structure is well developed by the time the sintering temperature is reached and the structures are similar except for a longer length scale with the longer time
The study of LPS focuses on linking composition, processing, and properties, with recent attention to improved dimensional precision. The glue between these factors is in the microstructure. A homogeneous green structure greatly improves the LPS response [18]. The amount and placement of the liquid phase have significant impact on the sintering trajectory. Most effective is placement of the liquid phase on the interface between the solid grains [19–21]. As a consequence, coated powders are an ideal starting point [22]. Further, the identification of additives that improve wetting, accelerate diffusion, or harden the composition are linked to interfacial energy and phase relations [23–25]. Beyond additives, research also considers processing factors such as particle size, green density, heating rate, peak temperature, hold duration, and cooling rate. During heating, the mixed particle compositions interact due to diffusion driven by the chemical composition gradients between the powders. Although there is much pre-liquid densification, still rapid densification occurs when the liquid forms. If there is no solubility between the liquid and solid, then densification occurs at the rate associated with sintering the solid skeleton and the liquid is simply a pore filling agent [26, 27]. Accordingly, understanding and controlling the microstructure evolution is of great practical importance.
Contact angle and dihedral angle
When the liquid forms in LPS, the microstructure consists of solid, liquid, and vapor. Liquid spreading on the solid replaces solid–vapor interfaces with liquid–solid and liquid–vapor interfaces. Figure 5 contrasts good and poor wetting based on the contact angle. In the horizontal plane, the contact angle θ is associated with the balance of three interfacial energies, γSV, γSL, and γLV as follows:
where the subscripts S, L, and V represent solid, liquid, and vapor, respectively. The lack of vertical balance has been the subject of concern in understanding microgravity microstructures [28]. Rearrangement of Eq. 1 gives the contact angle as a function of the relative surface energies,

Contrast of wetting behavior for a liquid on a horizontal plane showing how a low-contact angle supports wetting while a high-contact angle resists wetting. Densification requires a low-contact angle to ensure that the grains are pulled together
The contact angle is altered by factors that change solubility or surface chemistry. For example, the addition of Mo to the TiC–Ni system decreases the contact angle from 30° to 0° [29]. Also, surface chemistry depends on the processing atmosphere, but often this is not intentionally controlled [30].
As shown in Fig. 6 for a constant solid–vapor surface energy, the contact angle depends on the relative interfacial energies. A low-contact angle induces liquid spreading over the solid grains, providing a capillary attraction that helps densify the system. For small grains, contact stress can rival that seen in pressure-assisted sintering techniques, such as hot isostatic pressing [31]. In practice, a broad range of capillary conditions exist, since the microstructure is composed of a range of grain sizes, grain shapes, pore sizes, and pore shapes, each with a different capillary condition. A wetting liquid moves to occupy the lowest energy configuration, so it preferentially flows to the smaller grains and pores. This gives rise to rearrangement densification [32]. Rearrangement takes a few minutes, since heat flow from the furnace determines the rate of melt formation, and compacted powders are poor thermal conductors [33].

This plot show the relation between the three surface energies and the contact angle during LPS, the plot is normalized by assuming the solid–vapor surface energy is 1 J/m2
A high-contact angle indicates poor wetting, so the liquid retreats from the solid. This results in compact swelling and liquid exuding from pores, as evident in Fig. 7. Thus, depending on the contact angle, liquid formation causes either densification or swelling. The magnitude of the capillary effect depends on the amount of liquid, particle size, and contact angle [31].

A scanning electron micrograph showing the surface of a sample where the non-wetting liquid exuded to the compact surface to form small spheres
The solid–vapor dihedral angle is observed where a grain boundary intersects the vapor phase, but in LPS more concern is given to the intersection of the grain–grain contacts with the liquid phase, as illustrated in Fig. 8. The assumption is that the two solid–liquid surface energies are equal and oppose the grain boundary energy γSS. The vertical force rationalization relies on the dihedral angle φ as follows:

The dihedral angle for a solid–liquid system is evident by the grain boundary groove that forms where the boundary emerges into the liquid. The lower portion of the figure shows the vector equilibrium used to link surface energies to the dihedral angle
Rearrangement gives the dihedral angle as a function of the ratio of the liquid interfacial energies. If the ratio of the solid–solid to solid–liquid surface energy is relatively high (>1.8), then the dihedral angle approaches 0° and liquid separates contacting grains. There is no dihedral angle if the solid is amorphous.
In some situations, the solid–solid contacts form low energy grain boundaries, resulting in large dihedral angles. These grain contacts rotate to give grain growth by coalescence. More typically, the grain boundary energy varies with crystallographic misorientation and chemical segregation. Although the dihedral angle tends to be reported as a single value, it is not single valued. Further, because of the distribution in contact situations, disagreement exists as to the presence of liquid on the grain boundaries after sintering. What is observed in transmission electron microscopy depends on several factors, such as impurities, grain misorientation, and cooling rate after sintering—factors often not properly controlled.
Using Eq. 3, the dihedral angle sensitivity to changes in solid–liquid surface energy is [14],
The relative change in dihedral angle is proportional to the solid–liquid surface energy change associated with solvation of the solid into the liquid. Penetration of a grain boundary requires the change in dihedral angle such that dφ = –φ, giving,
Small changes in the solid–liquid surface energy are sufficient to give liquid penetration of grain boundaries. For example, a dihedral angle of 30° requires only a 7% decrease in the solid–liquid surface energy to enable grain boundary penetration. Solid dissolution into the liquid reduces γSL to enable liquid penetration of grain boundaries. Figure 9 captures this behavior in the Fe–Cu system using microstructures quenched from just below and just above the copper melting temperature, showing preferential melt penetration along the iron grain boundaries at velocity ranges from 0.1 to 2 μm/s.

An example of the grain boundary penetration by liquid for the case of compacted iron and copper powders with a concentration of 8 wt.% Cu; after heating to 1075 °C is shown on the left and after heating to 1110 °C is shown on the right. When the copper melts, it rapidly penetrates along the iron grain boundaries
Newly formed wetting liquid spread to fill small pores and preferentially penetrate grain boundaries [34]. Dissolution reactions during spreading decrease the solid–liquid interfacial energy below the equilibrium value [35]. This causes a dihedral angle variation as illustrated in Fig. 10. After liquid formation and spreading, the solid–liquid system approaches equilibrium. With a low liquid content, the liquid fills pockets between grains, as illustrated in Fig. 11 [36]. However, during the liquid flow the reduction in skeletal strength leads to component distortion [37]. In some cases, the liquid forms lenticular islands on the grain boundaries to give a necklace microstructure, as shown in Fig. 12 [38–40].

The wetting transient on melt formation leads to a temporary drop in the equilibrium solid–liquid surface energy as solvation of the solid occurs. This momentary change gives a transient decrease in the dihedral angle that enables liquid penetration of the grain boundaries

At low liquid contents, the liquid forms pockets at the triple points where three grain boundaries meet. The shape of that liquid pocket depends on the dihedral angle

A necklace microstructure resulting from liquid penetration along the solid grain boundaries on first melt formation, followed by a pinching off of the liquid film into discrete islands on the grain boundary. This micrograph is from a Fe–7% Ti product after sintering
Parameters such as the dihedral angle have a natural distribution that reflects the grain boundary energy variation between different grain–grain contacts. The dihedral angle distribution tends to stabilize eventually. It is common to report typical values, such as the mean or median. Figure 13 plots the two-dimensional (2D) distribution taken from a tungsten heavy alloy [41]. Note the value measured on 2D micrographs is about 93% of the actual dihedral angle [42–44].

The cumulative dihedral angle distribution as measured for a LPS W–Cu–Ni microstructure giving a median (50% point on the cumulative distribution) dihedral angle of 62° [41]
Low dihedral angles and contact angles promote densification in LPS. Accordingly, solid solubility in the liquid is critical to LPS. In a wetting situation, a high-liquid content ensures rapid densification. However, if there is too much liquid, then distortion occurs. Densification is also influenced by the scale of the microstructure (measured by the grain size) and the relative quantity of liquid phase.
Volume fraction
The liquid content in LPS usually is from 5 to 15 vol.%. Figure 14 provides an illustration of the microstructure changes expected as the solid to liquid varies [45]. The grains are less spherical with more solid–solid contacts at the higher solid contents. The conceptual lowest value is 20 vol.% solid, near the percolation limit [46, 47].

Examples of the microstructure variation with composition changes, where the white corresponds to copper (liquid) and the dark corresponds to cobalt (solid) ranging from 30 to 80% cobalt [45]
Assuming the solid is denser than the liquid, gravity causes the solid volume fraction to increase with depth in the body. The lowest solid contents are created using free-settling solid grains. This is illustrated in Fig. 15 by plotting the solid fraction versus depth in free-settled Fe–Cu [48] and W–Ni [49]; the latter has a much higher solid–liquid density difference (7.8 g/cm3) that gives more solid grain compression with depth. The lowest solid content measured in both systems is about 35 vol.%, corresponding to about two contacts per grain.

Plots of the solid volume fraction versus height from the top surface for dilute LPS systems of Fe–Cu [48] and W–Ni [49]. These results show grain packing over the relative height of the compact gives self-compression to the denser solid phase. Starting near 35 vol.% solid, the degree of compression depends on the solid–liquid density difference (7.8 g/cm3 in W–Ni versus 0.8 g/cm3 in Fe–Cu)
In most LPS systems, the solids content exceeds 50 vol.%, so the coordination number is over six contacts per grain. Haller [50] predicts the three-dimensional (3D) grain coordination NC variation with solid volume fraction VS as follows:
Further, the distribution of contacts in the body is not single valued, but follows a Poisson distribution,
where P(n) is the probability of finding n contacts when the average is NC. In Fig. 15, the Fe–Cu system has a dihedral angle near 40° while the W–Ni system has a dihedral angle near 28° and both show a minimum solid content near 35 vol.% [49]. Since the solid grains compress the skeletal structure, there also is a concomitant increase in grain size with depth [51]. Thus, in low solid content systems, the microstructure varies with position, and by implication the properties are not uniform within the component.
In persistent LPS, the solid and liquid contents converge to constant values while the pores are annihilated, giving densification, but this is not always the case. In some LPS systems, the sintered density peaks and then decreases as evaporation or reaction occurs [52]. A key indication of an unstable situation is a progressive mass loss. On the other hand, time-dependent volume fraction changes occur in reactive systems; often these prove difficult to control.
In LPS systems characterized by multiple solid phases, the grains often exhibit core-rim gradients [53]. This is because the two solids have differing solubility–temperature relations that result in preferential dissolution of one solid during heating. Subsequent solvation of the second solid at a higher temperature reduces the solubility of the first solid in the liquid. Accordingly, the stepwise solvation and precipitation events influence grain growth and densification. As a consequence, grain growth inhibitors exhibit temperature ranges where they are most effective [54]. From a practical standpoint, control of these events allows manipulation of the sintered microstructure for property optimization [55–57].
Porosity, pore size, and pore location
Pores are initially present as interparticle voids, but might also arise from inhomogeneous particle packing (for example large liquid forming particles in a matrix of small solid particles), or volatile phases (such as polymers) in the green body. In sintered bronze bearings, the creation of pores for oil storage is achieved by intentional selection of the tin and copper particles sizes.
In most situations, it is assumed the pores are smaller than the grains, as evident in Fig. 16. Pores collect between the grains and are wetted by the liquid. Capillarity drives the liquid to preferentially fill smaller pores [58]. As the smaller pores fill, the mean pore size increases while the porosity and number of pores decrease. Further, because of pore buoyancy, there is progressive migration of the pores to the top of the component. Beere [59] describes the idealized microstructure based on surface energies; but inhomogeneities cause nonuniform liquid formation and spreading in the component [60].

A quenched microstructure taken during LPS, showing the pore placement at the solid–liquid interface during densification
Large melt-forming particles generate pores when they form a liquid [61]. Figure 17 is a micrograph that shows a rounded pore left behind by outward liquid flow. In cases where the melt-forming particles are large and the compact has a low porosity, this spreading leads to swelling, but densification still occurs at longer times [62].

Pore formation due to additive melting and flow into the neighboring capillaries. This micrograph of Cu–10% Sn shows dark pores where the tin grains were prior to melting, surrounded by molten tin, with a reaction layer at the copper interface (photograph courtesy of Tim Smith)
Pores larger than the grain size prove difficult to eliminate. Compact swelling due to pore formation at prior particle sites is observed if the liquid forming particles have substantial solubility in the solid during heating [63, 64]. Swelling is reduced by use of small melt-forming particles, sized to be similar to the interparticle voids. Coated powders work best since they avoid pore formation [21, 22, 65–67]. Unfortunately, pore coarsening works against densification, especially in cases where a gas exists in the pores [68–70], since the pores will coarsen and enlarge.
Large pores can be filled over time by meniscus growth if there is no trapped gas in the pores [71, 72]. These large pores are stable up to a critical size. Grain growth eventually induces pore filling when the ratio of the grain size G to pore size dP is favorable,
where φ is the dihedral angle. Since grain size increases with sintering time, liquid filling of larger pores takes considerable time. Figure 18 is a micrograph of a refilled pore that now appears as a liquid lake in the sintered microstructure.

A liquid lake resulting from the delayed refilling of a large pore during LPS for a 90 W–7%Ni–3%Fe composition after sintering at 1470 °C for 30 min. Grain growth led to a condition that enabled liquid flow into the pore
Trapped gas in the pores acts to inhibit final densification [73]. Gas filled pores are spherical, since they balance the liquid–vapor surface energy against the pore pressure PG,
In some cases, the collapse of gas-filled pores requires an external pressure, such as by hot isostatic pressing [74]. Pore growth occurs in LPS, in part due to annihilation of the smaller pores, but also due to vapor production during sintering. In the extreme, enormous pores or blisters form as the gas accumulates inside the component to form a single large pore.
Initially the pores are irregular in shape. Later they form a rounded network of connected pores. At roughly 8% porosity, the pores close and spheroidize [75]. Unfortunately, several LPS systems exhibit delayed pore generation where a high-temperature reaction produces an insoluble gas [70, 73]. An example is shown in Fig. 19 for mullite sintering with an oxide liquid phase [76]. The peak density corresponds to elimination of the open pores at 1300 °C, followed by swelling of the gas-filled closed pores at higher temperatures.

Data on the sintered density versus sintering temperature for a mullite LPS with a zirconia–alumina additive [75]. The composition reaches the highest sintered density when the open pores disappear at about 1300 °C, but swells at higher temperatures due to expansion of trapped gas in the closed pores
Grain shape
Grain shape depends on the volume fraction of solid, dihedral angle, and surface energy anisotropy. Contacts between neighboring grains cause the grains to flatten. The effect is most pronounced at low liquid contents. Beere [59] solved for the equilibrium grain shape under various assumed conditions. As the dihedral angle increases over 30°, a proportionate increase in liquid content is required to sustain a connected liquid along the grain edges. For a dihedral angle over 60°, the liquid forms isolated pockets at the triple points between grains [34, 59, 77, 78], as given in Fig. 20. In a complimentary view, Fig. 21 shows the solid and liquid phases when the other phase is dissolved.

As full density is reached during LPS, the solid grains form flat faces for the contact zones, yet retain a rounded overall shape. The liquid phase stretches along the edges of this rounded polyhedron

Scanning electron micrographs of the constituent parts to the LPS microstructure, a the solid grains after dissolution of the liquid, and b the liquid network after dissolution of the solid (a and b are not taken from the same material)
At high-solid contents, the grains take on a shape that helps eliminate pores [51]. For isotropic solid–liquid surface energy and liquid contents over about 30 vol.%, the grains are spherical except for the contact faces. At lower liquid contents, the grains are prismatic and the liquid conforms to the spaces between the grains. With lower liquid levels, there is insufficient liquid to fill all pores, so densification requires the grains to undergo shape accommodation. Because of coarsening, the particle shape prior to LPS has no significant effect on the sintered grain shape.
The liquid shape and grain shape are related. Wray [77] isolated the six structures shown in Fig. 22, assuming isotropic surface energies and no porosity. These correspond to the six regions on the dihedral angle–volume fraction liquid map in that figure. A dihedral angle below 70.53° gives a concave liquid. The liquid forms discrete pockets for low liquid contents and large dihedral angles, independent of grain size. Calculations for grain shape have been extended to gradient compositions [79].

Liquid shape and connectivity changes (for the condition of no pores) as a function of the liquid content and dihedral angle. The configuration is dictated by the liquid content and dihedral angle [77]. The upper drawings correspond to the liquid shape at a grain junction for the six regions marked on the lower plot
As part of pore elimination, the grains undergo both size and shape changes by solid dissolution into the liquid, diffusion of that dissolved solid through the liquid, followed by reprecipitation of dissolved solid onto lower energy solid surfaces. This process is called solution-reprecipitation. This process allows the larger grains to grow at the expense of the smaller grains. Accordingly, the dissolving small grains are spherical [80], while the growing large grains are flat faced [81]. Warren [82] determined how grain shape varied due to anisotropic solid–liquid surface energy. Figure 23 plots his calculated grain shape as a function of the relative surface energy. The grain shape changes to a flat-faced structure with a relatively small change in orientation-dependent surface energy. Faceting indicates low energy crystallographic orientations are favored, as evident in the LPS WC–Co structure. The micrograph in Fig. 3b is from a random cross section, so a variety of grain sections result. Chemical additives segregated to the interface provide one means to adjust either grain size or shape in the sintered product [83].

Grain shape variation with surface energy anisotropy [82]. These two-dimensional drawings illustrated how the grain shape depends on the interfacial energy of the right-facing face as a ratio to the mean interfacial energy, which determines the sharpness of the corner radius r with respect to the a flat face separation distance a
Grain size distribution
Grain size in LPS materials is usually reported as the mean intercept length. Other measures include the number of grains per unit area or the diameter of a grain with equivalent projected area. Models for the LPS grain size distribution predict the 3D sizes while most experimental data give the 2D random intercepts. Two transformations are required to go from the 2D random intercepts to true grain sizes; the first transforms the intercepts into equivalent circles, and the second transforms the circles into equivalent spheres. Due to the randomness of the section plane with the grain, few grains are sliced at their largest diameter. Even for the case of monosized spheres, the 2D grain size is smaller than the actual size. Accordingly, as outlined in Table 1, attempts to isolate a grain growth mechanism from random intercepts are flawed. Further, most models assume isolated spheres while the actual microstructures consist of connected nonspherical grains [84]. Grain agglomeration is inherent to LPS, even in dilute systems [85]. Accordingly, coalescence must be included in the grain size distribution models [86]. Another problem relates to the assumed diffusion field around each grain [87]. Observations show each grain exhibits a growth or shrinkage trajectory that depends on its local environment, not on the mean field [88].
In spite of these several difficulties, LPS grain size converges to a self-similar distribution, independent of the starting particle size distribution [89]. A two-way mathematical technique allows extraction of the 3D grain size distribution [90]. When the median 2D intercept is known, the cumulative distribution is given by a Raleigh distribution [91]:
where L50 is the median intercept size. The mean is 1.06 times the median while the mode is 0.85 times the median. The intercept size at 99% on the cumulative distribution is about 2.6 times the median. On the other hand, Ostwald ripening models predict a narrower distribution. Cumulative grain intercept distributions are shown in Fig. 24 for several LPS materials, where the largest grains are nearly threefold larger than the median.

Cumulative grain size distributions based on two-dimensional intercepts for several LPS materials showing the self-similar character of the distributions when normalized to the median size as described by an exponential function [90]
In three-dimensions, the cumulative grain size distribution is given by a similar function [92];
where G is the true grain size, c is a scale parameter related to the median grain size, and m is a shape parameter. The median of this distribution, G50, is given as follows:
The cumulative 3D distribution gives a form similar to Eq. 10,
where G/G50 is the grain size normalized to the median size. Since the median of the normalized grain size distribution is unity, selecting the shape parameter m determines the scale parameter c. For the 2D intercept distribution, the shape parameter m = 2 and Eq. 13 reduces to Eq. 10. Experimentally, the shape parameter for the 3D distribution is 2.76. Intuitively a value of m = 3 might be expected, but coalescence acts to broaden the distribution.
Grain separation, population, and surface area
The grain separation is important to mechanical behavior, since often the matrix phase resists crack propagation. The grain separation depends on grain size, liquid content, and dihedral angle [23, 82, 93]. The average grain separation λ is based on measures of the phase thickness between grains [94],
where VL is the volume fraction of liquid and NL is the number of grains per unit line length. Some reports ignore solid–solid grain contacts (a zero grain separation) in calculating the mean, so they are skewed to higher values. Since the grain separation only depends on the number of grains per unit measurement length, it should include the zero separation instances. The mean grain intercept size L (proportional to the true 3D grain size) is related to the mean grain separation for zero porosity as follows:
Thus, when measured versus sintering time, the grain separation scales with the grain size. Usually, grain size increases with the cube-root of sintering time, so the grain separation increases with the cube-root of LPS time.
Similarly, the number of grains decreases over time. The number density of grains (grains per unit volume) times the grain volume gives the solid content per unit volume. If the solid volume remains constant, then as the grain size increases the number density of grains must decrease. For most LPS materials, the grain size increases with the cube-root of time, so the number of grains per unit volume declines with inverse time [12]. The solid–liquid interface area per unit volume is inversely proportion to the grain size. Grain coarsening causes the grain-liquid interface area to decrease with the inverse cube-root of time.
Neck size and shape
Contacts grow between grains and eventually reach a stable size determined by the neck diameter X and dihedral angle φ as follows:
where G is the grain size, as drawn in Fig. 25. Because there is a distribution to the grain contact orientations and grain boundary energies, LPS microstructures exhibit a distribution in contact sizes. Further, the contact shape is often not a circle. Simultaneous measurements of the neck size and grain size in two dimensions leads to an estimate of the dihedral angle. Figure 13 plots the dihedral angle distribution taken this way in a W–Ni–Cu composition [41].

Two spherical grains of diameter G with a bond of diameter X. This combination gives a neck size ratio of X/G that is set by the dihedral angle. Once this neck size ratio is achieved, neck growth occurs only by grain growth
Similar to the neck size, the distance between contacting grain centers δ depends on the grain size G and dihedral angle φ as follows:
Assuming a circular contact gives the solid–solid contact area ASS as,
The contact between grains is not always circular, as seen in Fig. 26. There are instances where very different contact shapes are evident, including half-moon and doughnut shapes.

This fracture surface shows a rounded but not circular neck. The neck size and shape are varied throughout a LPS material. Note also the discrete islands of former liquid phase located on the grain boundaries between the grains
Many solid–solid contacts involve grains of differing sizes. In such cases the grain boundary is curved and favors grain coalescence, with the large grains absorbing the small grains, often evident as elongated grains in the microstructure. Makarova et al. [95] suggests coalescence is favored at shorter sintering times, but in some systems there is evidence of coalescence even after long sintering times, as illustrated in Fig. 27.

A W–5%Ni microstructure sintered at 1550 °C for 180 min to induce a high degree of grain coalescence as evident by grain fusion without a grain boundary at several points in this microstructure
Since the terminal neck size depends on the grain size, X/G remains constant. Thus, late-stage LPS exhibits neck growth proportional to grain growth. Typically the mean grain size increase with the cube-root of time, so the neck size shows a similar dependence (X ~ t 1/3), which is the same as seen for early stage neck growth [96].
Grain coordination, contiguity, and connectivity
The grain coordination is the number of touching grains it has in three dimensions. At the lower typical solids content of 50 vol.% solid, the coordination number ranges from 3 to 6, and it reaches a high range of 12–14 at full density with no liquid. For low dihedral angles, there are approximately 8–12 contacts per grain at 75% solid. Alternatively, for a high dihedral angle, there will be 4–6 contacts per grain at 75% solid. In the absence of pores, the 3D coordination number NC relates to the solid volume fraction VS and the dihedral angle φ by an empirical relation;
where A = NC cos(φ/2).
Three-dimensional grain coordination is hard to measure, so the convention is to use 2D measures such as contiguity or connectivity. Contiguity CSS is the relative solid–solid interface area in the microstructure. It is defined by the solid–solid contact surface area as a fraction of the total microstructure interfacial area,
where the solid–solid surface area per grain is SSS and the solid–matrix surface area per grain is SSL. Usually contiguity is measured in two dimensions by quantitative microscopy based on the number of intercepts per unit length of test line N,
The subscript SS denotes the solid–solid intercepts and SL denotes the solid–matrix (solidified liquid) intercepts. The factor 2 is necessary since the solid–solid grain boundaries are only counted once by this technique, but are shared by two grains.
Contiguity initially varies in LPS due to liquid penetration of the grain boundary followed by subsequent neck growth between contacting grains. After a few minutes, it tends to stabilize at a value that depends on the solid volume fraction and dihedral angle, independent of the grain size. For monosized spherical grains, Fig. 28 plots the relation between these factors and includes data from three carbide systems for comparison [39]. The VC–Co system has a low dihedral angle, so it has a lower contiguity trace. In the absence of pores, a parametric relation between contiguity CSS, volume fraction of solid VS, and dihedral angle φ is given as follows:

Contiguity versus solid volume fraction for dihedral angles ranging from 15° to 75°. In this case, the two contacting grains (G1 and G2) are assumed to be the same size. For comparison, the experimental results for three carbide systems are included
This relation is less accurate at high-solid contents since it does not include a grain shape effect. Figure 29 plots the contiguity variation with dihedral angle for a solid volume fraction of 0.8 with the effect from a typical grain size distribution. For nonspherical grains, the grain contacts are variable in size and shape, but contiguity exhibits a similar variation with solid content [17, 97].

Contiguity variation with dihedral angle at 0.8 volume fraction solid, with two curves shown corresponding to monosized grains and random contacts for a distributed grain size
Connectivity is a related parameter based on the average number of grain–grain connections per grain as observed on a random 2D cross-section. It is effective in explaining the resistance to distortion during LPS [98]. Grain connectivity CG depends on the 3D grain coordination number NC and dihedral angle φ as [99]:
For example, a typical 3D grain coordination number is 6 for a solid content near 60 vol.% with a dihedral angle of 60°, giving two contacts per grain in 2D, in agreement with experiment.
Early in LPS the bonds between solid grains grow so contiguity increases over time. Any change in interfacial energies changes the dihedral angle and contiguity [39]; thus, contiguity drops on first melt formation, with a subsequent time-dependent behavior, as illustrated in Fig. 30 [38].

The solid contiguity versus sintering time for a W–8Ni compact sintered at 1550 °C, showing how time-dependent surface energy changes are evident during initial LPS [38]
The formation of solid–solid necks leads to generation of a rigid solid skeleton. At a low solid fraction, grain settling induces contacts, but Brownian motion also induces contacts [85, 95]. Percolation refers to the formation of a continuous chain of solid–solid bonds in the microstructure. At the percolation limit, the grain connectivity is 1.5, while sufficient rigidity to resist distortion during LPS occurs near three contacts per grain [97].
Composite relations
Microstructure studies describe the amount of each phase, its distribution, and its composition. This requires descriptors of size (grain size, pore size, surface area, and grain separation), shape (grain shape, pore shape, and liquid shape), and relations between the phases (contiguity, coordination number, and grain orientation). In turn, microstructure governs properties.
Liquid phase sintering is a normalization process. Although the starting point in LPS depends on the green body porosity, particle size, and homogeneity, still the microstructure converges to a common evolution pathway. During LPS, porosity is usually decreasing, but since smaller pores are annihilated first the mean pore size increases while the grain size is increasing. Further, the dihedral angle and contiguity vary dramatically when the liquid first forms. After the transients, the microstructure takes on a self-similar aspect that largely varies with grain size. Thus, microstructures from many different materials look similar in spite of chemical differences. Examples from semisolid processing and geological materials exhibit these same characteristics [100, 101]. The features from a few LPS microstructures are compared in Table 2 to illustrate typical combinations.
Interfacial energies control much of the microstructure evolution during LPS. The interfacial energies change when the first liquid forms and are sensitive to segregation and temperature. Further, interfacial energies change due to reactions, diffusion, or solvation. Anisotropic surface energies change with minor chemical changes [102]. Thus, LPS microstructure parameters are distributed, time-dependent, temperature-dependent, impurity-dependent, and even change with location in the sintered body, facts that are often forgotten. Although initial microstructure transients have been emphasized here, cooling also changes the microstructure. Care is needed to properly freeze the microstructure from the sintering temperature since temperature-dependent solubility changes alter the microstructure during slow cooling. For this reason, reports on the LPS microstructure are only valid with respect to the “sintered” condition and are not relevant to the conditions existing during “sintering.” This is seen in disagreements on the grain boundary condition, such as for WC–Co [103]. Slow cooling induces segregation and precipitation, so experiments can be constructed to show either grain boundaries free of Co or grain boundaries with a Co segregated layer.
Preliquid stage
The evolution of the LPS microstructure takes place in several steps, starting from the consolidated powders and finishing with the cooling cycle. Here we take up the key steps associated with heating to the sintering temperature, initial liquid formation, and then the progressive coarsening and densification stages.
Microstructure evolution prior to liquid formation is equivalent to solid-state sintering of mixed powders. Factors favorable for densification in heating prior to liquid formation are also favorable for densification during LPS. Despite the prevalence of practical systems based on mixed powder sintering, only a few quantitative models predict densification and microstructure changes [104–106]. The parameters that influence densification include particle size and green density as found in solid-state sintering. However, added complications include temperature-dependent diffusivity and solubility characteristics, as well as concentration and spatial distribution effects associated with the powders. Savitskii [107] points out the important chemical gradients associated with mixed powders to show how they can dominate early sintering.
Microstructure evolution during heating is often ignored in LPS, since only a few applications exist for systems sintered to the pre-liquid state. None-the-less, this stage is important in understanding subsequent densification.
Chemical interactions
Mixed powders with different compositions represent a nonequilibrium condition. This microstructure continues to be out of equilibrium during the preliquid stage of sintering. Even so, equilibrium thermodynamics provides a good indicator of the sintering behavior, with solubility being a dominant factor. In the simplest case, the binary phase diagram provides a first estimate of the potential for densification of the mixed phases. Figure 31 is an idealized example of the solubility relations most typical to persistent LPS.

A schematic guide to the behavior expected during initial compact heating based on the relative solubility of the two phases. Densification is associated with the solid being soluble in the liquid with a low reverse solubility, which is the liquid is not soluble in the solid
Systems such as W–Cu with low mutual solubility (typically <10−3 at.%) are termed noninteracting. In such systems, particle size is a dominant factor with respect to densification. Chemical gradients play an important role in systems where the solubility exceeds about 0.1 at.%. On the other hand, systems with high solubility (>5 at.%) of solid in the additive phase, but little reverse solubility, are ideal for LPS. This is the most common situation, since substantial densification occurs, often prior to liquid formation, such as in the WC–Co system. On the other hand, a high solubility of the liquid forming additive in the solid leads to swelling during heating, and without LPS the resulting product is friable, as is the case for Cu–Sn.
Physical interactions
In LPS, particle size is important because it determines the curvatures, contact stress, and capillarity, thereby easing densification. Prior to liquid formation, the two particle sintering model gives the neck size to particle size ratio (X/D) and the sintering shrinkage (ΔL/L0) as follows [15, 108]:
where t is the sintering time and the constants m and n are mechanism dependent exponents, with m = 4 and n = 6 for grain boundary diffusion. An increase in particle size reduces the solid-state sintering shrinkage. This model, while strictly not applicable to mixed phase sintering, provides a first sense of the particle size role in sintering prior to liquid formation.
A high green density results in a higher-sintered density, but in mixed powder systems the behavior depends on the solubility. Solubility between the two powders determines the tendency toward swelling. Porosity change models generally are linear with composition, solubility, and initial porosity [107]:
where C is the volume fraction of the liquid forming phase, CL is the volume fraction of solid dissolved in that additive, f is the volume fraction of the additive reacting with the solid at any time, ε is the porosity after the dilution event, and ε0 is the initial porosity. In systems where the solid is soluble in the additive, then extensive swelling occurs during heating.
Often small particles prove difficult to handle in automated compaction equipment, so it is common to agglomerate the particles into clusters prior to compaction. However, if there is a bimodal pore size after compaction (small pores in the agglomerates and large pores between the agglomerates), then these treatments work against sintering densification. Depending on the packing characteristics, differential shrinkage between the agglomerates and inside the agglomerates leads to defects [109]. Once the liquid forms, LPS tends to homogenize the microstructure, eventually removing the inhomogeneities.
Microstructure changes
Microstructure changes such as densification, grain bonding, and grain growth occur before the liquid forms. Initially grain growth is restrained by pore drag, so grain growth accelerates as full density is reached. During liquid formation the grain size goes through a rapid change. In turn, a larger grain size leads to longer diffusion distances and a reduced rate of densification. Figure 32 plots quenched grain size during heating to show a slight regression on liquid formation with fast grain growth kinetics after liquid formation. The generalized relation between densification rate dρ/dt, fractional density ρ, grain size G, and grain growth rate dG/dt for persistent LPS systems is given as follows:
where the exponents k, l, and m depend on the densification and grain growth mechanisms, and K3 and K4 are material constants.

A plot of grain size versus cycle time obtained from quenched samples taken during heating W–5Ni–2Fe to 1500 °C at 10 °C/min (150 min). At 150 min or 1500 °C, time is extended while the temperature remains constant. Solid-state grain growth is slow and the grain size undergoes a small decrease on liquid formation, followed by rapid grain growth once the liquid exists
Depending on the grain size and solubility, near full densification is possible before liquid formation, while in the absence of solid solubility in the liquid, both densification and grain growth are retarded. During the heating stage, the grain size is pinned by the microstructure as follows:
where Gmax is the maximum grain size, Vd and dd are the volume fraction and size of the additive phase, K5 is a material constant, and q is a measure of the pinning effectiveness with values typically between 1 and 2. Thus, in LPS the small particles provide a steep diffusion gradient that promotes densification prior to liquid formation. Homogeneous green bodies promote densification and microstructure control.
Incipient liquid formation
Phase diagrams help explain the interactions observed in LPS. Wetting has a significant effect and traces to solubility relations evident in the phase diagram. Wetting systems have solid solubility in the liquid that induces liquid spreading to fill pores. The spreading parameter S is given as:
where the right side is composed of surface energies for the three interfaces. Liquid completely wets the solid for S > 0 and partially wets when S < 0. It is convenient to classify LPS systems as noninteracting or interacting based on how solubility determines initial densification.
Noninteracting systems
Systems such as W–Cu and Al2O3–Ni have low mutual solubility, so there is little sintering due to chemical gradients prior to liquid formation. A low-contact angle gives grain rearrangement and densification due to the capillary force exerted by the wetting liquid. Densification occurs within seconds after liquid formation [32, 33]. The capillary force arises from the liquid–vapor surface tension as shown in Fig. 33. For two spheres, the pressure difference ΔP across the curved liquid surface with radii of curvature of r and X/2 is [31, 110],

A schematic of two spheres of size D1 and D2 with a connecting liquid bridge. This geometry is used to calculate the capillary force responsible for rearrangement during LPS
The force between the two spheres is the sum of capillary force and surface tension contribution,
where r and X/2 are the principal radii of curvature, D is the particle diameter, d is the interparticle distance, and θ and ψ are angles depicted in Fig. 33. For a wetting liquid, the capillary force pulls the grains together and is especially important for smaller grains. If large additive particles generate the liquid phase, they will leave behind large pores that are difficult to remove. These pores eventually fill as the microstructure coarsens, but are easier to avoid by proper sizing of the initial particles. For a nonwetting liquid, the compact swells, as in the case with the Al2O3–Ni system.
Densification by grain rearrangement depends on the liquid content and the particle characteristics. More liquid means less grain shape accommodation is required to reach full density. Usually about 30 vol.% liquid is sufficient to give complete densification by rearrangement. Otherwise, grain shape accommodation and solid-state sintering are required for complete densification.
Nonspherical particles provide an additional inducement to rearrangement, since a wetting liquid generates a rearrangement torque to bring flat surface into contact [111]. This torque increases with the relative liquid content, resulting in more rearrangement as the particle shape departs from spherical. Note spherical and irregular particles have different sensitivities to the liquid quantity; irregular particles undergo less rearrangement at low liquid contents [112].
Interacting systems
Interacting systems have solubility relations that create intense diffusion fluxes during the early portion of LPS. There are two extremes based on the solubility ratio SR,
where SB is the solubility of the solid in the additive and SA is the solubility of the liquid forming additive in the base, both measured at the sintering temperature. Additives with a high solubility in the solid base (SR < 1) leave behind a pore. Prior to liquid formation, the porosity variation with additive concentration follows Eqs. 26 and 27.
A persistent liquid phase is most common, where there the amount of liquid exceeds its solubility in the solid. A wetting liquid penetrates grain boundaries to give densification by rearrangement, solution-reprecipitation, and solid-state sintering. A high-solubility ratio is ideal for LPS. In many instances, the mixed powders form a eutectic liquid that corresponds to a high-solubility ratio. In many cases, near full densification occurs with a small quantity of liquid. This is evident in Fig. 34, where liquid formation induces considerable microstructure change. These micrographs were taken just prior to and just after liquid formation. Note the material is almost dense prior to liquid formation, but substantial change occurs when the liquid forms.

Scanning electron micrograph of a mixed tungsten–nickel–copper powder compact a heated to just prior to liquid formation, showing near full densification during the heating process, and b just after liquid formation, showing a dramatic grain shape change
Similar behavior is seen in liquid metal embrittlement [113], reactive wetting [114], and diffusion induced grain boundary migration [115]. In LPS, liquid penetration of grain boundaries occurs because the initial melt is undersaturated with solid. The rapid dissolution of solid into the newly formed liquid dissolves the interface to momentarily lower the surface energy. For example, in the W–Ni–Fe system, the solubility of tungsten in the additive phase increases by about 16 at.% when the liquid forms. As a consequence, the newly formed liquid is chemically aggressive and penetrates the solid–solid interfaces, reducing the dihedral angle below the equilibrium value. The penetration rate depends on the reactivity of the liquid, its viscosity, and the contact angle. To model these events, Pejovnik et al. [116] used flow through a capillary tube of diameter dP to represent liquid penetration, where the depth of liquid penetration LL is estimated as,
where t is the time, η is the viscosity, θ is the contact angle. For an interacting system, Fredrickson et al. [117] gives the penetration depth versus time as follows:
where DS is the diffusion coefficient of the solid in the liquid, Ω is the molar volume of the liquid, X L is the mole fraction of solid in the liquid, X L,S is the mole fraction of the solid in the liquid at equilibrium, X S,L is the mole fraction of the solid in equilibrium with the liquid, respectively, η is the liquid viscosity, R is the gas constant, T is the absolute temperature, γSS is the solid–solid grain boundary energy, and t is the time. Factors that change the surface energies, such as impurities, alloying, or cold working, directly impact penetration rates.
Liquid penetration of the grain boundaries causes grain separation and a swelling on liquid formation as the dihedral angle changes. This is documented in the Fe–Cu system, where carbon additions increase the dihedral angle, leading to less swelling, as shown in Fig. 35. In this case, the iron particles were large so the swelling event far offset any sintering shrinkage. Had the experiment been performed with a micrometer-sized iron powder, then substantial densification would have followed the swelling event.

Swelling in Fe–10Cu after LPS with different carbon contents. The reduced swelling is because carbon decreases the penetration of iron grain boundaries by newly formed liquid copper
After liquid formation, a cascade of rearrangement and solution-reprecipitation events densify the compact. Rearrangement forces the solid grains pack to a higher coordination. Continued densification comes from solution-reprecipitation and solid skeleton sintering that work to eliminate residual pores while the solid grains change size and shape.
Solution-reprecipitation
Neighboring grains bond together after the first melt spreads between the solid grains [118]. A solid skeletal microstructure slows densification, since the system strengthens with neck growth. If there is insufficient liquid to fill all pores, then continued densification relies on solid diffusion through the liquid. If the solid is not soluble in the liquid, then densification occurs by the relatively slower solid-state skeletal densification [27, 119]. However, solution-reprecipitation is dominant when the solid is soluble in the liquid. It occurs in three steps:
-
(1)
solid dissolution into the liquid, preferentially from higher energy regions, including asperities, convex points in the microstructure, areas under compression, and small grains,
-
(2)
diffusion of the dissolved solid in the liquid, and
-
(3)
precipitation of the dissolved solid onto concave regions or larger grains in areas not under compression.
Figure 36 is a microstructure with pores isolated in the liquid, typical to solution-reprecipitation controlled densification. Pore elimination and microstructure coarsening are key features of solution-reprecipitation controlled densification. Both depend on the same diffusion steps, as do grain shape changes and the growth of intergrain bonds. For example, Fig. 37 plots data taken during LPS of Fe–20Cu at 1150 °C [120]. Solution-reprecipitation produces simultaneous changes in density, grain size, grain shape, and neck growth.

A microstructure typical to solution-reprecipitation stage densification, consisting of liquid films on the grain boundaries, residual pores, and grains undergoing shape accommodation. This structure is for a LPS steel alloy processed at 1200 °C for 30 min

Several changes take place in solution-reprecipitation controlled densification. These results are from Fe–20%Cu sintered at 1150 °C [120]. The plots show the changes in porosity, grain size, number of grains per unit volume, pore separation, neck size, and neck density
In most cases, the controlling solution-reprecipitation step is diffusion through the liquid, although interfacial reaction control is observed in some systems. Rounded grains are characteristic of diffusion control. A curved surface has a high density of atomic scale surface ledges that provide surface dissolution and precipitation sites. Flat-faced, prismatic grains indicate reaction control. The low population of defects on planar crystallographic faces slows the solution-reprecipitation rate. Most LPS microstructures evidence rounded grains, indicative of densification by diffusion-controlled solution-reprecipitation.
Grain shape accommodation
Conceptual models of solution-reprecipitation are shown in Fig. 38. Grain shape accommodation via solution-reprecipitation improves grain packing, releasing liquid to fill pores. Grain shape accommodation is favorable because the overall interfacial energy is reduced. The vapor interface energy reduction is greater than the penalty from an extended solid–liquid interface [121, 122].

A conceptual outline of the changes associated with solution-reprecipitation densification where both grain growth and grain shape accommodation act to release liquid to fill residual pores
For an isotropic surface energy, the excess energy associated with a nonspherical grain shape is termed the sphering force [123]. At full density, a low liquid content causes more grain shape accommodation, giving a larger sphering force. A dense compact with shape accommodation is not at the lowest energy condition. This is demonstrated by immersing a full density compact with grain shape accommodation into a liquid reservoir. Additional liquid wicks into the compact, allowing the solid–liquid interface to relax toward a lower energy spherical grain shape.
Densification
Usually pores remain in the compact after rearrangement, especially since the typical liquid content is below the 30 vol.% needed to fill all voids on liquid formation. Solution-reprecipitation is the most important means to reach full density during LPS. Three mechanisms are envisioned as means to densify the structure.
Contact flattening is the first mechanism and it is sketched in Fig. 39a. A compressive force at the grain contacts from the wetting liquid pulls the grains together. This capillary stress causes preferential dissolution of solid at the contact point with reprecipitation at regions away from the contact. Densification results from the grain center-to-center motion [124]. The key step is solid diffusion in the liquid to areas away from the contact zone. For small grains, the contact zone stresses are quite large, so contact flattening tends to dominate LPS [11]. However, contact flattening does not explain grain growth and the decrease in the number of grains. When grain growth is inhibited there is less grain shape accommodation [125, 126].

The three mechanisms of grain shape accommodation and neck growth during solution-reprecipitation controlled LPS densification; a contact flattening, b dissolution of small grains, and c solid-state bonding
The second densification mechanism involves dissolution of small grains with reprecipitation on large grains. Small grains disappear while large grains grow and undergo shape accommodation. Diffusion in the liquid is the controlling transport mechanism, as sketched in Fig. 39b. This mechanism does not involve shrinkage, so it is not an explanation for densification, except that grain shape accommodation enables better packing of the solid.
The third mechanism involves growth of the intergrain contact by diffusion along the liquid wetted grain boundary, as indicated in Fig. 39c [127, 128]. The contact zone enlarges to change the grain shape with simultaneous shrinkage of the grains. This does not involve grain coarsening, but it does require a cooperative redistribution process of the mass deposited where the grain boundary intersects the liquid [129].
These three mechanisms differ in the source of the solid and in the detailed transport path, but together they explain grain shape accommodation, grain growth, and densification. Grain growth occurs with densification. Indeed, grain size and density tend to follow a common trajectory for most LPS systems, showing more rapid grain growth as pores are eliminated. Although neck growth is initially active, it is not sufficient to explain all microstructure changes. On the other hand, contact flattening and small grain dissolution couple to fully explain the microstructure and density progression typical to LPS.
If transport is controlled by interfacial events, then it is reaction controlled. Reaction control is observed in mixed phase systems, such as complex cemented carbides from WC, VC, TiC, or TaC with a cobalt-based liquid [130–132]. Grain growth inhibitors slow interfacial reaction events. The most effective inhibitors reduce the number of reaction sites, leading to the emergence of flat-faced grains or core-rim grains, where the chemistry changes from the outside to the inside [133–136]. In diffusion-controlled growth, the grains remain rounded with an abundance of atomic steps, so there is no limitation from the population of interfacial sites available for dissolution or precipitation [9, 131, 137].
Early in LPS, Kingery [9] gave the sintering shrinkage ΔL/L0 (change in length divided by the initial length) by diffusion-controlled solution-reprecipitation as follows:
where δL is the liquid layer thickness between the grains, γLV is the liquid–vapor surface energy, Ω is the atomic volume of the solid, DS is the diffusivity of the solid in the liquid, C is the solid concentration in the liquid, t is time, R is the gas constant, T is the absolute temperature, G is the solid grain size which changes with sintering time (typically G 3 ~ t), and g1 is a geometric constant estimated as 192. Several of these parameters change with temperature. Subsequent treatments [124, 138–140] assume a liquid or viscous film on the grain boundary [109, 141–145], but it is missing when grains are coalescing [146]. Figure 40 plots two examples of solution-reprecipitation data for shrinkage versus time on a log–log basis [10, 147]. The slope fits that anticipated for diffusion-controlled solution-reprecipitation LPS. However, Eq. 40 is only accurate at small shrinkages.

For interface reaction control, a similar form from Kingery [9] is given as follows:
with κ being the reaction rate constant and g2 being a geometric constant that is about 16. There is no effect from the diffusion rate in the liquid since the reaction site availability determines the shrinkage rate.
In both cases, the sintered density ρS is calculated from the shrinkage and green density ρG,
These equations demonstrate the effects of the main process variables on shrinkage and density change; densification is faster with higher temperatures, smaller grains, and more solid solubility in the liquid. Small particles are beneficial, as demonstrated in Fig. 41 for LPS alumina–glass [148]. However, the above model fails to predict a dependence on the amount of liquid, but experiments show such an effect, as demonstrated in Fig. 42. Complex changes occurs in the interfaces during LPS, with grain growth decreasing the solid–liquid area, but grain shape accommodation and pore elimination increasing the solid–liquid area. No model accounts for this complexity. A similar treatment by Gessinger et al. [127, 128] assumed the liquid layer wets the grain boundary with a small dihedral angle, giving essentially the same sintering shrinkage as Kingery.

Fractional density for LPS alumina–glass with 10 vol.% glass sintered for various times, showing how particle size influences densification [148]

Fractional sintered density versus sintering time at 1600 °C for alumina–glass mixtures based on a 3.6 μm alumina particle size. Here the volume fraction of liquid phase was adjusted from a high of 20 vol.% glass to no liquid phase, showing a progressive detriment in sintering densification (from left to right the curves are 20, 10, 7.5, 5, 3, 1, and 0 vol.% glass) [148]
Solid-state diffusion by grain boundary diffusion in the grain contact is another densification mechanism. The predicted neck growth rate is the same as given by solid-state grain boundary diffusion models. Since solid-state diffusivities are low when compared to liquid diffusivities, solid-state sintering is only significant in those cases where there is no solid solubility in the liquid; for example, systems used in electrical contacts and electronic heat sinks (Mo-Ag, Mo-Cu, W–Cu, SiC-Al, and WC-Ag).
Densification during solution-reprecipitation correlates with grain growth, as demonstrated in Fig. 43 [125]. The porosity and percentage of small tungsten grains are plotted versus sintering time for a compact composed of 48% small W, 48% large W, and 4% Ni. Densification occurs in parallel with the elimination of the small grains. Likewise, grain shape accommodation occurs by dissolution of the small grains and reprecipitation on the large grains [126]. Letting Γ be the ratio of densification rates due to contact flattening versus that due to small grain dissolution gives [125]:
where δL is the width of the liquid layer between grains, and X is the diameter of the contact. If the liquid width is small, on the order of a few atomic diameters, then small grain dissolution and precipitation on the large grains is controlling [34, 149, 150]. For systems where the liquid film thickness is on the order of 1–3 μm, contact flattening dominates densification. This suggests contact flattening gives initial densification until solid bonds grow between contacting grains.

A demonstration of how small grain consumption and densification are coupled during diffusion-controlled solution-reprecipitation densification for W–4%Ni using a starting mixture of large and small tungsten particles [125]. The left axis of this log–log plot corresponds to the porosity change and the right axis gives the change in small grain population
The grain size distribution becomes self-similar during solution-reprecipitation, so even with different initial particle size distributions the compact converges toward a characteristic microstructure as full density is approached [151]. Accordingly, a few key parameters control densification kinetics [148]:
-
green density determines the initial number of neighboring grains for bonding,
-
temperature controls solubility, wetting, and diffusivity,
-
particle and grain size control the curvature, surface area, and diffusion distance, and
-
time determines the cumulative changes.
Neck growth
Neck growth by solution-reprecipitation occurs soon after newly formed liquid wets the grain boundaries [95, 124]. The resulting neck growth law is as follows:
where X is the neck diameter, G is the grain diameter, g3 is a geometric constant near 160, DS is the temperature-dependent diffusivity of the solid in the liquid, C is the solid concentration in the liquid, γSL is the solid–liquid surface energy, Ω is the atomic volume, t is the sintering time, R is the gas constant, and T is the absolute temperature. The amount of liquid does not significantly change the initial neck growth rate, as long as there is sufficient liquid to cover the neck. Neck growth models ignore the dihedral angle, so they are only useful for initial bonding. While there is a high porosity, grain growth is slow so a typical assumption is that neck growth occurs without a change in grain size.
Eventually, the neck size reaches a stable size dictated by the dihedral angle. For grains of size G with a bond of size X, the equilibrium neck size depends on the dihedral angle φ as given in Eq. 16. Once formed, the distributions in grain sizes, contact misorientation angles, and surface energy give a distribution to the neck sizes.
The grain size distribution leads to large–small grain combinations. The grain boundary between the grains must be curved to preserve the dihedral angle; the curvature increases with the grain size ratio. Plots of two-grain neck sizes are given in Fig. 44 for selected dihedral angles and grain size ratios. The neck size divided by the larger grain size decreases as the grains differ in size, while the neck size normalized by the smaller grain size increases. A curved grain boundary provides a driving force for grain coalescence [86].

The neck size ratio X/G (X = neck diameter, G = grain diameter) is fixed by the dihedral angle. This plot shows the change in neck size to grain size ratios for the two grains as a function of the grain size ratio, G2/G1
Associated with initial neck growth is shrinkage and densification. As a first approximation, the sintering shrinkage ΔL/L0 is proportional to the neck size ratio X/G,
In a LPS material with a dihedral angle of 60° the neck size ratio grows to a limiting value of X/G = 0.5, corresponding to a peak shrinkage of 6.25%. But at a dihedral angle of 23°, the corresponding shrinkage is just 1%. After the stable neck size ratio is formed, as dictated by the dihedral angle, X/G remains constant and further neck growth depends on grain growth. Since the number of necks per grain remains fairly constant, there is a decrease in the number of necks per unit volume as grains grow.
Coalescence
A wetting liquid induces particle contact due to an attractive capillary force. Amorphous particles will coalesce, since there is no grain boundary [146]. For crystalline solids, there is a 5–10% probability that a random grain contact will form with a low-angle grain boundary that favors coalescence. A sketch of grain coalescence is given in Fig. 45 and Fig. 27 shows a microstructure involved in coalescence. The driving force of coalescence is the grain boundary curvature. As shown in Fig. 46, this curvature r depends on the dihedral angle φ, and grain sizes G1 and G2 (G1 is larger than G2) as

Coalescence occurs as grains of differing size come into contact, resulting in growth of a neck with a grain boundary, and then migration of the grain boundary through the smaller grain to form a single large grain

The radius of curvature r of the grain boundary between contacting grains depends on the dihedral angle φ and the grain size ratio (G1/G2). A large ratio induces a high curvature that aids rapid grain coalescence during LPS
Large–small grain combinations naturally favor coalescence. Also, chemical gradients, where the solid grains have differing compositions, accelerate boundary motion and coalescence [152].
Grain coalescence contributes to densification and coarsening [12, 153, 154]. As illustrated in Fig. 47, four transport paths are possible: (1) grain boundary migration by solid-state diffusion, (2) grain boundary migration by diffusion across a thin liquid film on the boundary, (3) solution-reprecipitation from the small grain to the adjacent large grain, and (4) grain rotation into a coincidence condition. Experimental evidence confirms grain boundary migration with a thin liquid layer [155–157]. Grain rotation is favored by high-liquid contents because there are fewer bonds to retard rotation. At high-solid contents, boundary migration is the typical mechanism [158, 159]. As the small grains are absorbed, coalescence decreases [6, 94, 160].

Coalescence occurs between contacting grains by several possible mechanisms; a solid-state grain boundary motion of curved grain boundaries, b liquid film migration with diffusion across the film from the small to large grain, c solution-reprecipitation from the small grain to the large grain through the surrounding liquid, and d small grain rotation to a lattice coincidence orientation where there is no grain boundary
Another form of coalescence involves pores. Just as grains merge and grow, gas-filled pores also grow in size. Buoyancy-driven pore migration leads to stratification of larger pores near the top of the component. At the same time, Ostwald ripening of the pores leads to a decrease in the number of pores with a simultaneous increase in the average pore size. Unlike solid coarsening, where volume is conserved, gas-filled pores change volume as they grow since the internal pressure depends on the inverse of the pore size. Thus, as the pores grow the gas pressure decreases and the pore volume increases both due to coalescence and due to the declining pressure, resulting in long-term swelling as illustrated in Fig. 48 [68]. Gas diffusion in the liquid is one means for pore growth [73]. On the other hand, pore buoyancy results in a few large pores near the component top. These are sometimes evident as surface blisters. The best demonstration of pore coarsening is in microgravity experiments, where the absence of buoyancy led to pore coalescence into massive pores. Figure 49 is an example of such a pore in a W–9.6Ni–2.4Cu sample subjected to LPS in microgravity, showing the coalescence of two large pores.

An example of swelling during solution-reprecipitation for MgO–CaMgSiO4 at 1600 °C in nitrogen [68]. The porosity is increasing since pore coarsening occurs by gas diffusion through the liquid, decreasing the number of pores, increasing the size of the pores, and since pore pressure decreases as the pores enlarge the net effect is swelling instead of the desired densification

The cross section microstructure in a W–9.6Ni–2.4Cu alloy after LPS in microgravity for 180 min with evidence of pore coalescence into massive pores. The sample is about 10 mm across
Grain growth
Models for solution-reprecipitation controlled grain growth struggle with several difficulties in LPS, as outlined in Table 1. Early models assumed spherical, isolated grains, but LPS always gives grain contacts and often nonspherical grains. The Ostwald ripening treatments assumed an average dissolved solid content in the liquid. If this were true, then the growth or shrinkage rate for any given grain would simply be a function of its relative size as compared to the mean size. Smaller grains dissolve and larger grains grow. However, the local environment is important, as evidenced by the grain size versus time data in Fig. 50 [161]. Here a few of the size trajectories cross, meaning some of the larger grains shrink and some of the smaller grains grow. This complication, coupled with coalescence and absence of solution-reprecipitation over the interfaces coved by pores and solid contacts, makes prediction of grain growth behavior during solution-reprecipitation challenging.

Grain size traces versus LPS time for lead–tin coarsening, where some of the trajectories cross to show grain growth depends on the local grain environment [161]
From a practical standpoint, grain growth during LPS follows a simple power law,
where G0 is the initial grain size after the liquid formation transients, G is the grain size during LPS, and t is the sintering time [12]. Values of n near 3 indicate the mean grain volume increases linearly with time and the number of grains decreases with inverse time. However, for instances where the grains are flat faced, solution-reprecipitation is limited by a low population of interfacial sites and n is near 2. The grain growth rate constant K is related to the transport mechanism [12, 15]. Experimental data for diffusion-controlled grain growth generally show the cubic growth law, as illustrated in Fig. 51.

Grain size cubed versus LPS time for a W–15.4Ni–6.6Fe alloy LPS at 1507 °C
The grain growth rate constant is sensitive to temperature, since solubility, diffusivity, surface energy, solid–liquid ratio, and other parameters change with temperature. These changes are lumped into a single Arrhenius temperature dependence leading to an apparent activation energy. Various efforts have added the solid volume fraction to the rate constant. Ardell [162] added a diffusion geometry assumption that predicted a broad grain size distribution, but showed a greater sensitivity to volume fraction than seen experimentally. Davies et al. [163] included coalescence events, resulting in a broad grain size distribution. Other treatments have assumed separated spheres and ignored coalescence, leading to an abundance of models not relevant to LPS. However, DeHoff [164] developed a model that included interactions between neighboring grains while Takajo et al. [165] assumed all coarsening was by coalescence, resulting in a broad grain size distribution. German and Olevsky [91, 166] showed how contiguity alters the relative solid-state and liquid-phase contributions to coarsening and their model was later extended to include pores in LPS [167].
Simply stated, rounded grains grow with a rate that depends on diffusion in the liquid phase. The mean grain volume increases linearly with time. This is true for diffusion-controlled growth or coalescence, so little insight is gained by extracting n values from grain growth data. Indeed, often it is possible to fit experimental data with a range of n values with equal significance [168]. However, grain growth models vary significantly in their predictions of the effect of volume fraction on the grain growth rate constant. Thus, trials with changes in the solid volume fraction are useful for assessing the grain growth mechanism. In doing this, LPS data support a grain growth rate constant dependence on the liquid volume fraction raised to the −2/3 power [15, 91, 166]. Often the grain growth rate constant is normalized to the Ostwald ripening model where the grain growth rate constant is given as
where DS is the solid diffusivity in the liquid, C is the solubility of the solid in the liquid, Ω is the solid molar volume, γSL is the solid–liquid surface energy, R is the gas constant, and T is the absolute temperature.
For a material free of pores, the LPS grain growth rate constant is given as follows [15, 166]:
where VS is the solid volume fraction. This is valid for the range of solid volume fractions encountered in LPS. In the range from 5 to 15 vol.% liquid, the rate constant varies by a factor of 2.1. Consequently, a measurable grain size difference is seen from the top to bottom of LPS compacts because solid grain compression changes VS with position [51].
Flat-faced grains exhibit lower rates of grain growth. Indeed, the rate of grain growth shifts as the grain shape changes. Grain growth is rapid up to the point where the grains become faceted. Further shifts in grain growth are possible by adding species that segregate to the solid–liquid interface to lower the active site population. This is evident when VC is added to the WC–Co system prior to LPS [169]. Likewise, systems consisting of two different solid phases show inhibited grain growth, as demonstrated in Fig. 52 for the MgO–CaO–Fe2O3 system [170].

Inhibited grain growth during LPS for a mixture of MgO and CaO grain with 10% Fe2O3, showing how the mixture of solids reduces the sintered grain size [170]
Pore filling
Pore filling by liquid preferentially starts at a localized region in the compact and spreads during LPS [171]. Small pores fill first, since they have the highest capillary attraction for the wetting liquid. High-green density regions correspond to smaller pores, so pore filling naturally favors the high green density regions [172]. The slower process of liquid flow into large pores is illustrated in Fig. 53. When a large pore is surrounded by smaller grains, pore filling is delayed because the capillary forces retain the liquid in small channels. During prolonged sintering, grains growth reduces the capillary gradients and eventually reaches a favorable condition for liquid to flow into the pore [173–175]. This condition is described by the liquid meniscus radius at the pore-liquid-grain contact, rm is given as:
where G is the grain diameter and α is the angle from the grain center to the solid–liquid–vapor contact point. Pore filling occurs when the pore size and meniscus radius are about the same and is favored by a low-contact angle [176]. Figure 18 is a micrograph of a refilled pore, showing a liquid lake surrounded by grains. Grain growth usually follows a cube-root dependence on time, so the filling of large pores can be delayed for some time. However, trapped gas in the pores will retard densification.

Large pore filling in LPS depends on grain growth. A pore larger than the grain size is initially stable, but subsequently grain growth reaches a critical condition where liquid flows into the pore, leading to liquid-filled lakes in the final microstructure. The critical condition depends on the pore size dP, grain size G, liquid meniscus radius rm for the liquid, and angle α between the meniscus contact and the line connecting grain centers. Grain growth during solution-reprecipitation eventually triggers large pore filling
Sintering atmosphere
The atmosphere or vacuum level used during LPS provides an opportunity to alter the material chemistry and sintering. Usually, oxide-based ceramics are sintered in air, nitride-based ceramics in nitrogen, and carbide-based ceramics, cemented carbides and tool steels in a carbon-controlled atmosphere. Highly reactive metals are sintered in vacuum. Ferrous systems are sintered in hydrogen or hydrogen–nitrogen atmospheres. In several cases, small changes in the atmosphere composition, such as partial pressure of oxygen or water, produce a measurable change in sintered properties. A completely inert atmosphere, such as argon, inhibits full densification since the trapped argon stabilizes closed pores.
The initial atmosphere tasks are to provide heat transfer and sweep away polymer decomposition products from binders and lubricants. Differential thermal analysis, thermogravimetric analysis, differential scanning calorimetry, and in-line mass spectroscopy help identify the atmosphere reactions. For example, these tools are used to identify polymers that do not burnout properly and become sources of residual carbon.
Delayed reactions between impurities and the sintering atmosphere are problems in LPS. During solution-reprecipitation, solid is dissolved into the liquid with the release of dissolved impurities. Effectively each grain undergoes zone refining. Reactions between the impurities and sintering atmosphere might generate insoluble reaction products, leading to stable pores. Examples are the reaction of carbon and oxygen to form CO or CO2 in alumina [177] or the reaction of hydrogen and oxygen to form water vapor in tungsten heavy alloys [73], cemented carbides [178], and alloy steels [179]. The internal pressure in the pore increases with temperature, leading to compact swelling. Additives are known that can inhibit some of these reactions [180]; for example, strong oxide formers such as aluminum are effective in copper alloys.
Heating and cooling rates
Chemical reactions, diffusional homogenization, and solid-state sintering occur during the heating cycle. Slow heating is more costly, but leads to more impurity removal, but a coarser microstructure. In transient LPS there is a strong sensitivity to heating rates [181, 182]. Slow heating favors pore formation for reactive and transient liquid systems. In other forms of LPS, there is little importance to the heating rate since most densification and microstructure development occur after liquid phase formation.
Densification is not sensitive to cooling rate. However, the liquid contracts on cooling in the same manner as castings contract; thus, shrinkage pores form in the liquid with rapid cooling. Also, solid precipitates out of solution during cooling. The precipitate size is sensitive to the cooling rate, so properties are sensitive to cooling rate. Impurity segregation occurs during cooling and this can be detrimental to properties. Optimized cooling rates offer a possibility of controlling the extent of hardening while suppressing impurity segregation [183, 184].
Solid phase sintering
The final stage of LPS corresponds to a microstructure of connected solid grains with liquid occupying the space between the grains. This system is rigid. Grain growth continues while the solid skeleton sinters to full density, or to where gas trapped in the pores halts densification. For low-solubility systems, such as W–Cu, densification is paced by the solid phase sintering rate, while for systems with solid solubility in the liquid the solution-reprecipitation events control final densification.
In the final stage, the microstructure continues a slow approach to a minimum energy solid–liquid configuration. Minimum energy grain shapes emerge. The pores are treated as isolated spheres, and in the final stage the total porosity is <8%, giving an interlaced microstructure of solid grains and liquid, but isolated near-spherical pores. In this case, the densification rate is given as follows [73]:
where ρ is the fractional density, t is the time, DS is the diffusion rate of the solid in the liquid, C is the solubility of the solid in the liquid, Ω is the atomic volume of the solid, R is the gas constant, T is the absolute temperature, G is the grain size, dP is the pore size, γLV is the liquid–vapor surface energy, PG is the gas pressure in the pore, and β is a pore density factor given as follows:
where NV is the number of pores per unit volume. Because trapped gas in the pores inhibits full densification, it is important that final stage LPS be conducted in a vacuum or an atmosphere that diffuse out of the pores. If sintering occurs in an atmosphere that is insoluble in the liquid, then the final product has spherical pores. As illustrated in Fig. 54, an insoluble gas in the pores results in swelling during the final stage of LPS. Besides an increase in porosity and pore size, there is a concurrent loss of properties.

Liquid phase sintering of a TiC–Co cermet, showing the swelling due to residual gas trapped in the pores during LPS
Computer simulation
For most of its history, LPS science has been empirically based, due both to the emphasis on applications and the relative complexity of the field. Further, the large variety of materials processed by LPS requires broad generalizations. However, now it is possible to predict the properties of liquid phase sintered components in silico. This has been facilitated by the astounding growth of computing power in conjunction with refinements to the simulation algorithms. Computer simulations critically test our understanding of the complexity associated with LPS, and in doing so provide new insights. We can now anticipate the point where computer simulations will guide future practice and the discovery of new LPS materials.
As a manufacturing process, LPS bridges between topics from solid-state physics, chemistry, solid mechanics, rheology, and engineering. Many of the LPS computer simulations borrow knowledge from these fields, as well as metal forming and polymer processing. This section is organized around the simulation length scale, ranging from simulations at the grain scale up to the component scale.
Monte-Carlo method
Most LPS components are polycrystalline. A major goal of current research is to develop simulation methods that can reliably reproduce the time dependent microstructure evolution. The Monte-Carlo (MC) method is applied to microstructure evolution simulations, even though the MC simulation is broadly applicable. The technique is frequently applied to grain growth problems. Unfortunately, many LPS simulations are 2D and inherently flawed when compared to 3D microstructures. The MC simulation approach for LPS microstructure evolution is based on the following developments:
-
Matsubara and Brook [185–188] simulated microstructure developments with multiple mechanisms of mass transfer in a MC simulation of sintering densification and grain growth for micrometer-sized grains. The MC simulations were performed using an array of 2D triangular lattices to handle the multiple phase systems.
-
Ryoo et al. [189] used a pseudo-MC simulation based on atomic adsorption and coalescence to model the process of triangular prism formation and abnormal grain growth of WC-25Co during LPS.
-
Liu et al. [190–192] used the MC method based on a 3D multiple grain arrangement model to simulate the 3D coordination number, contiguity, and grain growth in the LPS of W–Ni–Fe alloys. Liu [193] used the same MC method to simulate the effect of the wetting angle on a dihedral angle distribution and on the degree of the grain boundary penetration by the liquid phase during LPS.
-
Aldazabal et al. [194] and Luque et al. [195] used MC methods to simulate precipitation during LPS. The introduction of appropriate phase diagrams and diffusion algorithms are essential to the final results since the diffusion rate has a large influence on the final microstructures. The main variables are the concentration of solute in the matrix, the diffusion of this solute, and interfacial energy. The algorithm works on microstructures discretized using homogeneous cubic elements called voxels. The microstructure scale was refined to show thin layers of matrix between solid grains. Figure 55 shows the simulation results of a microstructure evolution during isothermal LPS [195].
Fig. 55 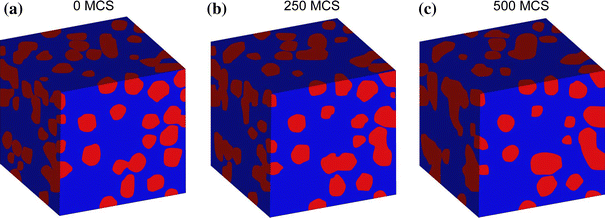
Monte-Carlo simulation of microstructure evolution during LPS, where MCS indicates time as measured by Monte-Carlo steps [187]

Potts Monte-Carlo method
The Ising model [196] and its generalization to multiple orientation which is the Potts model [197] provide a means to describe microstructure evolution at the mesoscale. The Potts Monte-Carlo (PMC) model is a discrete, statistical mechanical model with more than two states. It is used to study many phenomena in material science and is useful for diffusion models involving LPS. This technique is adaptable to a two-phase system; LPS means solid grains in a liquid matrix, including the grain boundaries and interfaces. It can simulate dissolution of the solid into the liquid and diffusion of the solid through the liquid. Most importantly, it is capable of dealing with the geometric complexity that reflects the reality of LPS microstructure evolution. Following as some publications relying on the PMC approach for LPS.
-
Tikare et al. [198, 199] modified the PMC model for solution-reprecipitation by allowing neighboring sites to exchange places by the classical Metropolis algorithm for isotropic grain growth by Ostwald ripening during LPS. The representation of the two phases, solid grains in a liquid matrix, was achieved by populating the lattice with a two-component, canonical ensemble.
-
Zhang et al. [200] used a modified PMC computer simulation for grain growth during intermediate and final stages of LPS as applied to grain growth of a BaTiO3-based ceramic. The presence of a liquid phase blocked grain boundary motion and restricted grain growth, a factor that seems at odds with practice.
-
Itahara et al. [201] developed a PMC model on a 2D triangular lattice to design grain-oriented microstructures of ceramics processed by plate-like templated anisotropic grain growth for functional materials due to anisotropy in interfacial energies during LPS.
-
Lee et al. [202] used the MC route with a three-dimensional Pott model with voxel element reflecting LPS in a system. They allowed full solid wetting to investigate the coarsening kinetics and microstructures and to obtain the properties of solid grains, including the volume of critical nuclei and the distribution of grain sizes as a function of time, as shown in Fig. 56.
Fig. 56 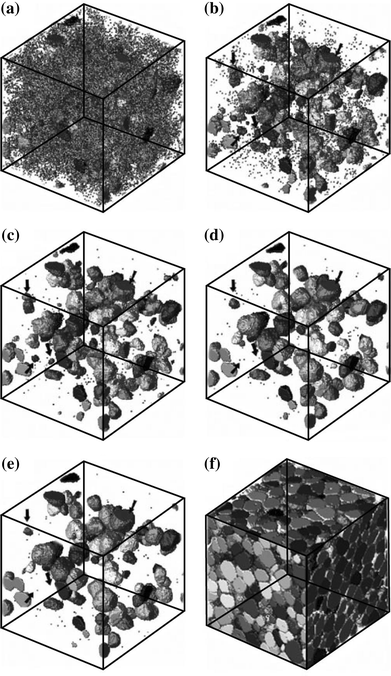
Temporal evolution of a simulated 3D microstructure with an initial solid fraction of 0.7. The snapshots were obtained at a 6000, b 12000, c 24000, d 120000 and e and f 200,000 Monte-Carlo steps (MCS). To improve visualization, the liquid is not shown. In addition, to illustrate the coarsening process more effectively only a portion of the grains are shown from a to e. Coarsening occurs with the larger grains growing at the expense of smaller grains (marked with arrows) [194]

The PMC method does not rely on explicit input of thermodynamic and kinetic characteristics. The powder is represented on a square or triangular lattice as an agglomerate of grains with different interface energies, and statistical sampling is performed to find configurations of increasingly lower energy. Methods have been developed for treating sintering mechanism and grain growth during LPS. The limitation of this method is in deciding on the range and relative size of the interface energies. This may be overcome by using a multiscale modeling approach.
Discrete element method
Discrete element method (DEM) is a meshless numerical method suitable for treating a mesoscale problem without restrictive assumptions on grain kinematics. The technique does not include coarsening. In DEM, the micro-thermo-mechanical equilibrium of each grain is treated using a distinct element (particle) by calculating the interactions between contacting grains. Access to computing power allows practical situations to be tackled using very large particle arrays. DEM studies on LPS are listed below.
-
Chaix et al. [203–206] used DEM to treat the rearrangement stage in LPS by introducing capillary forces between grains, grain inertia, viscous drag of liquid, and elastic collision.
-
Nikolić [207–212] used a 2D DEM to simulate grain growth by grain boundary migration based on solution-precipitation with gravity induced settling during LPS.
-
Petersson et al. [213] used a 2D DEM model to simulate the rearrangement of spherical grains of different sizes in a viscous media during LPS, reflective of WC–Co, as shown in Fig. 57.
-
Wonisch et al. [214] used DEM to investigate anisotropic grain arrangement and show how this leads to an isotropic strain rate in macroscale during the LPS process.
DEM has a great potential in LPS because it allows direct description of the grains and particles and it provides a bridge between microscale simulation and macroscale simulation, which is significant to eventual multiscale simulations.

A two-dimensional DEM simulation of grain rearrangement during the early portion of LPS: a starting structure with a relative density around 0.65 and b simulation of rearranged structure due to viscosity [205]
Finite difference method
Finite difference method (FDM) is a numerical computational method for solving a system of differential equations through approximation of differentiation at each mesh point, called point-wise approximation. The primary limitation of this method is in dealing with the complicated geometry, which makes this method of limited use to industry. However, this method is very efficient when the computational geometry is simple. A few papers using FDM to study LPS are described below.
-
Raj et al. [215] used the standard FDM to simulate the anisotropic shrinkage based on the extended Svoboda and Riedel’s model [140] during LPS of the alumina with TiO2 and Na2O as liquid agent.
-
Fan et al. [216] developed the ‘‘grid-tracking’’ numerical technique based the FDM with an explicit two-step of predictor–corrector to simulate liquid phase migration (LPM) due to an interfacial-energy-driven flow during the LPS of functionally graded WC–Co.
Finite element method
The finite element method (FEM) is an approach for solving a system of differential equations through approximation functions in each element, called domain-wise approximations. This method is powerful for complex geometries. This is one of the earliest techniques applied to materials modeling, and it is used throughout industry. Many commercial software packages exist for calculating 3D thermo-mechanical processes, so they can be adapted to LPS problems. The FEM approach is widely used to predict the final size and shape of LPS components, with developments in the field in this chronological order.
-
McHugh and Riedel [217, 218] used FEM to simulate the LPS of tungsten carbide and silicon nitride materials. The focus was on shape distortions based on grain rearrangement, contact flattening by the solution-precipitation, grain coarsening, and bulk viscosity. They developed density dependent functions to enable the predictions, but several approximations were required to implement the approach.
-
Ganesan et al. [219] used FEM for an assumed viscous flow of a semisolid LPS structure driven by curvature and gravity. They relied on Stokes equations with consideration of solid volume fraction to estimate the effective viscosity of the solid–liquid mixture. From this, they simulated component distortion during LPS for tungsten alloys in microgravity and ground-based sintering conditions.
-
Olevsky et al. [220] also used FEM with a continuum theory of sintering to predict shape distortion caused by gravity in LPS of a W–Ni–Fe powder system.
-
Kraft [221] used an optimization algorithm for compaction and LPS to predict and minimize the distortion as a result of inhomogeneous density distributions in the green body.
-
Binet et al. [222] used the a fluid flow model to simulate transient distortion under gravity as calculated under changes in surface tension, density, and viscosity for LPS of W–Ni–Fe.
-
Maximenko et al. [223] used FEM to predict liquid flow with coupled deformation of the refractory skeleton during LPS of cemented carbides.
-
Blaine et al. [224] used FEM to predict distortion with experimentally determined constitutive parameters for LPS of a stainless steel doped with boron.
-
Villanueva et al. [225] used the parallel adaptive FEM of Cahn–Hilliard/Navier–Stokes system to numerically investigate wetting phenomena in capillary-driven flow during LPS. The model captured qualitatively the important phenomenon in LPS, such as wetting and microstructure behavior, including deformation, coalescence, pore migration, and pore elimination.
-
Park et al. [226] developed FEM simulations to predict densification and distortion with constitutive laws of grain growth, shrinkage, and deformation during LPS of W–Ni–Fe. A few examples of the simulation results are shown in Fig. 58.
Fig. 58 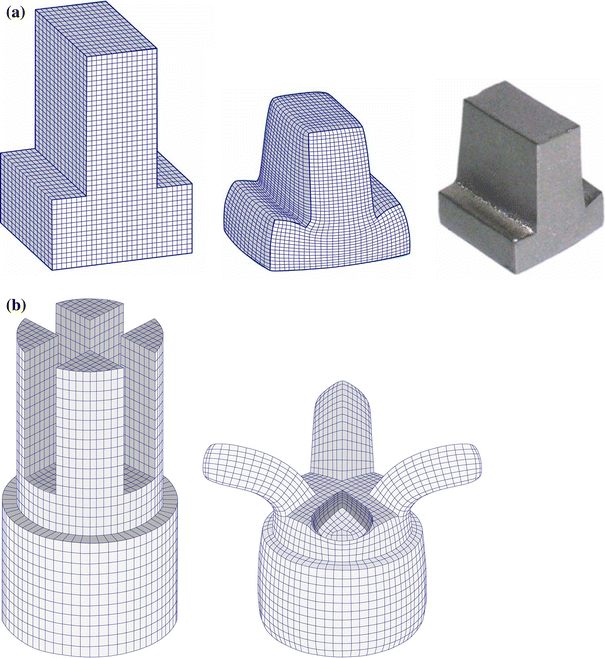
Examples of FEM simulations of 3D components. The version given in a is based on the European Powder Metallurgy Association inverted T distortion test geometry (with actual shape after LPS for comparison) and b is based on a test geometry where the simulation predicts spreading of the free standing fingers. The simulations correspond to W–8.4Ni–3.6Fe LPS processed for 2 h at 1500 °C [218]

FEM proves most useful. The approach relies on a database of measured material properties for input. Simulation of the final component size and shape, properties, and defects are fast using personal computer resources. The reduction of the time and cost needed to obtain material properties to feed the FEM simulations is an area of current research, since experimental testing for each system is quite expensive. The hope is that such synthesis of material properties might be possible based on material informatics using existing databases or new techniques such as data mining and computer thinking algorithms.
Boundary element method
The boundary element method (BEM) is a means to solve a system of differential equations that have been formulated as integral equations. It is efficient when the integral equations have an exact solution in the selected computational domain, so an approximation is needed only on the boundaries. Consequently, in implementing BEM, only the boundary of the solution domain has to be discretized into elements. On the other hand, this method is very inefficient in certain regards so it has found limited use in LPS. One paper using the approach is listed below.
-
Voorhees et al. [227] used the 2D BEM for intergrain diffusional interactions to adjust interfacial concentrations during simulation of the morphology evolution of grains during diffusion-controlled Ostwald coarsening.
Multiscale method
Multiscale modeling is now applied to solid-state sintering. The extension to LPS is still pending. Two cases have been reported; one goes from DEM for mesoscale to macroscale continuum mechanics [228] and the other goes from MC simulation for microscale to FEM for macroscale [229]. Successful development of these methods will undoubtedly require large research investments. However, much benefit might be possible if more efficient processes can be developed, with better optimization and time reduction routines applicable to LPS.
Summary
Liquid phase sintering emerged from an empirical origin that started in the 1930s. Since the 1950s, there has been progress in the quantitative treatment of LPS to the point of effective computer simulations that predict microstructure, component size, and component shape. The scientific principles have advanced to include many processing factors and provide a platform for the identification of new systems.
As illustrated in Fig. 59, there are two initial trajectories possible when mixed particles are heated above the solidus temperature. Swelling occurs when the liquid is soluble in the solid, and it is most useful in forming porous structures, such as self-lubricating bronze bearings. The more typical situation is where the solid is soluble in the liquid. This is associated with densification as used in many systems. Thus, a phase diagram for a densification system is illustrated in Fig. 60. A large reduction in the melt formation temperature improves transport rates, thereby lowering the sintering temperature. In such as system, substantial densification occurs during heating to the sintering temperature, since mixed powders have a strong chemical driving force for diffusion. Accordingly, as illustrated in Fig. 61, a cascade of densification events occurs, where rearrangement, solution-reprecipitation, and solid phase sintering occur as overlapping events. Although this figure has a nominal time axis characteristic of many systems, still the time sequence varies considerably with factors such as particle size, heating rate, green density, and materials properties. Densification in LPS is a primary focus in the research community. It depends on many factors, but is dominated by solubility, particle size, and liquid content. For example, Fig. 41 shows how a smaller particle size shifts densification to a shorter sintering time. Small particles enable full densification at low temperatures or in short times. Further, Fig. 42 relies on data from the same system to demonstrate how a higher liquid content improves the densification rate.

Summary sketch of the divergence in initial structure when the melt forms in LPS, where swelling is associated with melt solvation into the solid and densification is associated with solid solvation into the liquid

Example phase diagram for LPS where the ideal combination of composition and temperature gives solid solubility in the liquid (eutectic liquid in this case) with a low solubility of the liquid in the solid. The melting temperature decrease gives a processing temperature benefit

A schematic of the overlapping events in LPS; densification is very rapid at short times where chemical diffusion is initially rapid, and as liquid forms and solution-reprecipitation occurs the densification slows. Final sintering of the solid skeleton can be a slow process. As the particle size, liquid content, and other factors are adjusted the shape and placement of this curve will change
The schematic density map in Fig. 62 suggests how a variety of factors impact LPS densification. Although the regions are illustrated with hard demarcations, in reality there is an overlap between events. With no liquid, only solid phase sintering occurs, which is slow and depends on small particles. On the other hand, with a large quantity of wetting liquid, densification is complete once the melt flows to fill the gaps between the solid grains. However, such systems are often weak at the sintering temperature and fail to retain shape. Thus, a typical LPS composition, with 5–15 vol.% liquid, requires a combination of events to reach full density. For a high solid-to-liquid ratio, several factors impact densification, with a dominance by particle size, melting temperature, and solubility.

A schematic map illustrating density versus the liquid volume behavior. With a low liquid content the bulk of densification will be by slow solid phase sintering, while with a high-liquid content it is possible to reach full density during heating to the liquid formation temperature. Most LPS compositions require several cooperating mechanisms, with solution-reprecipitation being most important
Densification by solution-reprecipitation occurs with concomitant microstructure coarsening, wherein pores are annihilated as the grain size and grain separation increase, and the solid–liquid surface area decreases. Solid diffuses through the liquid and deposits on convex surfaces, allowing a grain shape change to give a better packing arrangement, releasing liquid to fill remaining pores. Accordingly, density increases, grain size increases, and grain bonding and grain shaping occur simultaneously. Much effort has gone into modeling grain growth during LPS. Ostwald ripening notions prove inadequate to explain the experimental observations on LPS systems. Models that combined diffusion-controlled coarsening with coalescence prove capable of explaining the grain size distribution, coarsening kinetics, and sensitivity to liquid content. As the solid contiguity increases, there is more interfacial area over which coalescence occurs and less interfacial area over which solution-reprecipitation occurs. Thus, the grain growth rate constant depends on the liquid quantity, as plotted in Fig. 63. This figure plots the experimental grain growth rate constant as a function of the inverse liquid fraction to the two-thirds power [15, 91, 166].

There is much about LPS that is in need of research attention. From an industrial view, the most pressing needs relate to dimensional control. Because of tight industrial tolerances, many LPS materials are machined or ground after sintering. These post-sintering dimensional adjustments are costly. How can LPS be used to give the final size and shape? What factors, beside green density gradients, contribute to distortion during LPS? How might nonuniform sintering shrinkage be minimized? Can changes in the starting microstructure (for example, via particle size, mixing technology, or compaction conditions) be used to minimize distortion? Efforts focused on these areas show LPS systems often distort shortly after the liquid forms and continue to distort with a viscous flow or creep behavior. Is it possible to separate densification events from distortion to improve sintered tolerances? Possibly there are gains from idealized cycles, such as by slow heating.
Modeling efforts in LPS have included most of the key concepts. The initial chemical gradients associated with coated or mixed powder are important to the initial sintering trajectory, as is the green body density homogeneity. Recent efforts have made good progress using integral work concepts to explain LPS densification, distortion, and coarsening [139, 224, 230]. Next will be integration of these ideas to include particle size and solubility effects so the models can be generated with minimum experimentation. In turn, constitutive equations derived from simple relations will enable accurate computer simulations of the size, shape, density, microstructure, properties, and performance.
Abbreviations
- A :
-
NC cos(φ/2), dimensionless
- A SS :
-
Solid–solid contact area, m2 (convenient units: μm2)
- C :
-
Solid concentration in the matrix, m3/m3 or dimensionless
- C G :
-
Grain connectivity, dimensionless
- C SS :
-
Contiguity, dimensionless
- D :
-
Particle size, m (convenient units: μm)
- D 1 :
-
First eigenvalue of diameter of curvature, m (convenient units: μm)
- D 2 :
-
Second eigenvalue of diameter of curvature, m (convenient units: μm)
- D S :
-
Temperature-dependent solid diffusivity in the liquid, m2/s
- F(G):
-
Cumulative grain size distribution, dimensionless [0,1]
- F(L):
-
Cumulative intercept size distribution, dimensionless [0,1]
- G :
-
Grain size, m (convenient units: μm)
- G 1 :
-
Bigger grain size, m (convenient units: μm)
- G 2 :
-
Smaller grain size, m (convenient units: μm)
- G 50 :
-
Median grain size, m (convenient units: μm)
- K 1 :
-
Mechanism dependent parameter for neck size ratio, mm/s (convenient units: μmm/s)
- K 2 :
-
Mechanism dependent parameter for sintering shrinkage, mm/s2 (convenient units: μmm/s2)
- K 3 :
-
Material constant in the densification rate calculation, m3/s (convenient units: μm3/s)
- K 4 :
-
Material constant in the grain growth rate calculation, typical units m2/s (convenient units: μm2/s)
- K 5 :
-
Material constant relating grain size to pinned microstructure, dimensionless
- L :
-
Intercept size, m (convenient units: μm)
- L 0 :
-
Initial length, m (convenient units: mm)
- L L :
-
Depth of liquid penetration, m (convenient units: μm)
- L 50 :
-
Median intercept size, m (convenient units: μm)
- N C :
-
Three-dimensional grain coordination number, dimensionless
- N L :
-
Number of grains per unit line, 1/m (convenient units: 1/μm)
- N SL :
-
Number of solid–matrix intercepts per unit length of test line, 1/m (convenient units: 1/μm)
- N SS :
-
Number of solid–solid intercepts per unit length of test line, 1/m (convenient units: 1/μm)
- P G :
-
Gas pressure in the pores, Pa
- P(n):
-
Probability of finding n contacts, dimensionless
- R :
-
Universal gas constant, 8.31 J/(mol K)
- R 1 :
-
First eigenvalue of radius of curvature, m (convenient units: μm)
- R 2 :
-
Second eigenvalue of radius of curvature, m (convenient units: μm)
- S :
-
Spreading parameter, J/m2
- S A :
-
The solubility of liquid forming additive in the base, m3/m3 or kg/m3
- S B :
-
The solubility of solid in the additive, m3/m3 or kg/m3
- S R :
-
Solubility ratio, dimensionless
- S SL :
-
Solid–matrix surface area per grain, m2 (convenient units: μm2)
- S SS :
-
Solid–solid surface area per grain, m2 (convenient units: μm2)
- T :
-
Temperature, K
- V L :
-
Volume fraction of liquid, dimensionless
- V S :
-
Volume fraction of solid, dimensionless
- X :
-
Neck diameter or diameter of the contact, m (convenient units: μm)
- c :
-
Scale parameter related to the median grain size, m (convenient units: μm)
- d :
-
Diameter of capillary tube, m (convenient units: μm)
- d P :
-
Pore size, m (convenient units: μm)
- g 1 :
-
Geometric constant, near 192, dimensionless
- g 2 :
-
Geometric constant, near 16, dimensionless
- g 3 :
-
Geometric constant, near 160, dimensionless
- m :
-
Mechanism dependent exponent or shape parameter, dimensionless
- n :
-
Mechanism dependent exponent, dimensionless
- r :
-
Radius of curvature, m (convenient units: μm)
- r m :
-
Liquid meniscus radius at the pore-liquid-grain contact, m (convenient units: μm)
- t :
-
Time, s
- ΔL :
-
Change in a dimension from the size L0, m (convenient units: mm)
- ΔP :
-
Pressure difference across a curved liquid surface, Pa
- Γ:
-
Ratio of densification rates, dimensionless
- Ω:
-
Atomic volume, m3/mol
- α :
-
Angle from the grain center to the solid–liquid–vapor contact point, rad (convenient units: degree)
- β :
-
Pore density factor, dimensionless
- δ:
-
Distance between contacting grain centers, m (convenient units: μm)
- δ L :
-
Liquid layer thickness between the grains, m (convenient units: μm)
- φ :
-
Dihedral angle, rad (convenient units: degree)
- γ LV :
-
Liquid–vapor surface energy, J/m2
- γ SL :
-
Solid–liquid surface energy, J/m2
- γ SS :
-
Solid–solid grain boundary energy, J/m2
- γ SV :
-
Solid–vapor surface energy, J/m2
- η :
-
Liquid or solid–liquid melt viscosity, Pa s
- κ :
-
Reaction rate constant, 1/s
- λ :
-
Mean grain separation, m (convenient units: μm)
- θ :
-
Contact angle, rad (convenient units: degree)
- ρ :
-
Instantaneous density, kg/m3 (convenient units: g/cm3)
- ρ G :
-
Green density, kg/m3 (convenient units: g/cm3)
- ρ S :
-
Sintered density, kg/m3 (convenient units: g/cm3)
- ψ :
-
Angle in capillary bonding, rad (convenient units: degree)
References
Price GHS, Smithells CJ, Williams SV (1938) J Inst Met 62:239
Hall HE (1939) Met Alloys 14:297
Lenel FV (1948) Trans AIME 175:878
Kieffer R (1951) In: Kingston WE (ed) The physics of powder metallurgy. McGraw-Hill, New York
Gurland J, Norton JT (1952) Trans TMS-AIME 194:1051
Parikh NM, Humenik M (1957) J Am Ceram Soc 40:315. doi:https://doi.org/10.1111/j.1151-2916.1957.tb12628.x
St Pierre PDS (1954) J Am Ceram Soc 37:243. doi:https://doi.org/10.1111/j.1151-2916.1954.tb14033.x
Cannon HS, Lenel FV (1953) In: Benesovsky F (ed) Plansee proceedings. Metallwerk Plansee. Reutte, Austria
Kingery WD (1959) J Appl Phys 30:301. doi:https://doi.org/10.1063/1.1735155
Kingery WD, Narasimhan MD (1975) J Appl Phys 30:307. doi:https://doi.org/10.1063/1.1735156
Eremenko VN, Naidich YV, Lavrinenko IA (1970) Liquid phase sintering. Consultants Bureau, New York
German RM (1985) Liquid phase sintering. Plenum Press, New York
Lavergne O, Allibert CH (1999) High Temp High Press 31:347. doi:https://doi.org/10.1068/htrt181
German RM (2000) In: German RM et al (eds) Sintering science and technology. Pennsylvania State University, State College, PA
German RM (1996) Sintering theory and practice. Wiley, New York
Luyckx S (2000) In: Riedel R (ed) Handbook of ceramic hard materials, vol 2. Wiley-VCH, Weinheim, Germany
Luyckx S, Love A (2006) Int J Refract Metal Hard Mater 24:75. doi:https://doi.org/10.1016/j.ijrmhm.2005.04.012
Liden E, Carlstrom E, Eklund L, Nyberg B, Carlsson R (1995) J Am Ceram Soc 78:1761. doi:https://doi.org/10.1111/j.1151-2916.1995.tb08886.x
Goto Y, Thomas G (1995) Acta Metall Mater 43:923. doi:https://doi.org/10.1016/0956-7151(94)00298-V
Lu CH, De Jonghe LC (1994) J Am Ceram Soc 77:2523. doi:https://doi.org/10.1111/j.1151-2916.1994.tb04638.x
Nakajima A, Messing GL (1998) J Am Ceram Soc 81:1163
German RM, Smid I, Campbell LG, Keane J, Toth R (2005) Int J Refract Metal Hard Mater 23:267. doi:https://doi.org/10.1016/j.ijrmhm.2005.05.018
Ravishankar N, Carter CB (2000) Interface Sci 8:295. doi:https://doi.org/10.1023/A:1008767111340
Contreras A, Bedolla E, Perez R (2004) Acta Mater 52:985. doi:https://doi.org/10.1016/j.actamat.2003.10.034
Kipphut CM, German RM (1988) Sci Sin 20:31
Johnson JL, German RM (1996) Metall Mater Trans 27B:901
Johnson JL, German RM (2001) Metall Mater Trans 32A:605
Liu Y, German RM (1996) Acta Mater 44:1657. doi:https://doi.org/10.1016/1359-6454(95)00259-6
Humenik M, Parikh NM (1956) J Am Ceram Soc 39:60. doi:https://doi.org/10.1111/j.1151-2916.1956.tb15624.x
Shen P, Fujii H, Matsumoto T, Nogi K (2004) J Am Ceram Soc 87:1265. doi:https://doi.org/10.1111/j.1151-2916.2004.tb07721.x
Hwang KS, German RM, Lenel FV (1987) Metall Trans 18A:11
Huppmann WJ, Riegger H, Kaysser WA, Smolej V, Pejovnik S (1979) Z Metallkd 70:707
Belhadjhamida A, German RM (1993) Adv Powder Metall Partic Mater, vol 3. Metal Powder Industries Federation, Princeton
Brada MP, Clarke DR (1997) Acta Mater 45:2501. doi:https://doi.org/10.1016/S1359-6454(96)00339-4
Aksay IA, Hoge CE, Pask JA (1974) J Phys Chem 78:1178. doi:https://doi.org/10.1021/j100605a009
Raj R (1981) J Am Ceram Soc 64:245. doi:https://doi.org/10.1111/j.1151-2916.1981.tb09596.x
German RM (2001) Mater Trans 42:1400. doi:https://doi.org/10.2320/matertrans.42.1400
Riegger H, Pask JA, Exner HE (1980) In: Kuczynski GC (ed) Sintering processes. Plenum Press, New York, pp 219–233
Warren R, Waldron MB (1972) Powder Metall 15:166
German RM (1986) Int J Powder Metall 22:31
Chhillar P, Sangal S, Upadhyaya A (2004) Z Metallkd 95:3
Ye S, He Y, Smith JE (2003) J Mater Sci 38:377. doi:https://doi.org/10.1023/A:1021182003505
Riegger OK, Van Vlack LH (1960) Trans TMS-AIME 218:933
Tolman RC (1949) J Chem Phys 17:333. doi:https://doi.org/10.1063/1.1747247
Kang CH, Yoon DN (1981) Metall Trans 12A:65
Liu J, Upadhyaya A, German RM (1999) Metall Mater Trans 30A:2209
German RM (1995) Metall Mater Trans 26A:279
Niemi AN, Courtney TH (1983) Acta Metall 31:1393. doi:https://doi.org/10.1016/0001-6160(83)90009-3
Liu Y, Heaney DF, German RM (1995) Acta Metall Mater 43:1587. doi:https://doi.org/10.1016/0956-7151(94)00363-M
Haller W (1965) J Chem Phys 42:686. doi:https://doi.org/10.1063/1.1695991
Kipphut CM, Bose A, Farooq S, German RM (1988) Metall Trans 19A:1905
Kim J, Kimura T, Yamaguchi T (1989) J Am Ceram Soc 72:1541. doi:https://doi.org/10.1111/j.1151-2916.1989.tb07703.x
Zackrisson J, Rolander U, Andren HO (2001) Metall Mater Trans 32A:85
Morton CW, Wills DJ, Sternberg K (2005) Int J Refract Metal Hard Mater 23:287. doi:https://doi.org/10.1016/j.ijrmhm.2005.05.011
Seo O, Kang S, Lavernia EJ (2003) Mater Trans 44:2339. doi:https://doi.org/10.2320/matertrans.44.2339
Chan TY, Lin ST (2000) J Mater Sci 35:3759. doi:https://doi.org/10.1023/A:1004812910331
Tanase T (2006) J Jpn Soc Powder Powder Metall 53:409. doi:https://doi.org/10.2497/jjspm.53.409
Shaw TM (1993) J Am Ceram Soc 76:664. doi:https://doi.org/10.1111/j.1151-2916.1993.tb03657.x
Beere W (1975) Acta Metall 23:131. doi:https://doi.org/10.1016/0001-6160(75)90078-4
Kwon OJ, Yoon DN (1980) In: Kuczynski GC (ed) Sintering processes. Plenum Press, New York, pp 203–218
Kwon OJ, Yoon DN (1981) Int J Powder Metall Powder Tech 17:127
Lu P, Xu X, Yi W, German RM (2001) Mater Sci Eng A 318:111. doi:https://doi.org/10.1016/S0921-5093(01)01330-2
Lee DJ, German RM (1985) Int J Powder Metall Powder Tech 21:9
Xydas NK, Salam LA (2006) Powder Metall 49:146. doi:https://doi.org/10.1179/174329006X110303
Lenel FV, Hwang KS (1980) Powder Metall Int 12:88
Ito H, Mihashi Y, Tamagusuku S (1986) Powder Metall Int 18:139
Ackler HD, Chiang YM (1999) J Am Ceram Soc 82:183
Oh UC, Chung YS, Kim DY, Yoon DN (1988) J Am Ceram Soc 71:854. doi:https://doi.org/10.1111/j.1151-2916.1988.tb07535.x
Cho SJ, Kang SJL, Yoon DN (1986) Metall Trans 17A:2175
Bose A, German RM (1988) Metall Trans 19A:2467
Drofenik M, Popovic A, Irmancnik L, Kolar D, Krasevec V (1982) J Am Ceram Soc 65:C203. doi:https://doi.org/10.1111/j.1151-2916.1982.tb09950.x
Lee SM, Kang SJL (1998) Acta Mater 46:3191. doi:https://doi.org/10.1016/S1359-6454(97)00489-8
German RM, Churn KS (1984) Metall Trans 15A:747
Kang SJL, Greil P, Mitomo M, Moon JH (1989) J Am Ceram Soc 72:1166. doi:https://doi.org/10.1111/j.1151-2916.1989.tb09702.x
Kingery WD, Niki E, Narasimhan MD (1961) J Am Ceram Soc 44:29. doi:https://doi.org/10.1111/j.1151-2916.1961.tb15343.x
Sacks MD, Bozkurt N, Scheiffele GW (1991) J Am Ceram Soc 74:2428. doi:https://doi.org/10.1111/j.1151-2916.1991.tb06780.x
Wray PJ (1976) Acta Metall 24:125. doi:https://doi.org/10.1016/0001-6160(76)90015-8
Park HH, Yoon DN (1985) Metall Trans 16A:923
Delannay F, Pardoen D, Colin C (2005) Acta Mater 53:1655. doi:https://doi.org/10.1016/j.actamat.2004.12.015
Sarin S, Weart HW (1965) Trans TMS-AIME 233:1990
Shatov AV, Firstov SA, Shatova IV (1998) Mater Sci Eng A 244:7. doi:https://doi.org/10.1016/S0921-5093(97)00509-1
Warren R (1968) J Mater Sci 3:471. doi:https://doi.org/10.1007/BF00549730
Kim S, Han SH, Park JK, Kim HE (2003) Scr Mater 48:635. doi:https://doi.org/10.1016/S1359-6462(02)00464-5
Tewari A, Gokhale AM, German RM (1999) Acta Mater 47:3721. doi:https://doi.org/10.1016/S1359-6454(99)00164-0
German RM (1995) Metall Mater Trans 26B:649
Kaysser WA, Takajo S, Petzow G (1984) Acta Metall 32:115. doi:https://doi.org/10.1016/0001-6160(84)90208-6
Voorhees PW, Glicksman ME (1984) Metall Trans 15A:1081
Boettinger WJ, Voorhees PW, Dobbyn RC, Burdette HE (1987) Metall Trans 18A:487
Fang Z, Patterson BR, Turner ME (1992) Acta Metall Mater 40:713. doi:https://doi.org/10.1016/0956-7151(92)90013-5
Liu Y, German RM, Iacocca RG (1999) Acta Mater 47:915. doi:https://doi.org/10.1016/S1359-6454(98)00395-4
German RM, Olevsky EA (1998) Metall Mater Trans 29A:3057
Johnson JL, Campbell LG, Park SJ, German RM (2008) Metall Mater Trans (accepted)
Liu J, Lal A, German RM (1999) Acta Mater 47:4615. doi:https://doi.org/10.1016/S1359-6454(99)00320-1
Grathwohl G, Warren R (1974) Mater Sci Eng 14:55. doi:https://doi.org/10.1016/0025-5416(74)90123-2
Makarova RV, Teodorovich OK, Frantsevich IN (1965) Sov Powder Metall Met Ceram 4:554
Courtney TH (1977) Metall Trans 8A:671
Shatov AV, Ponomarev SS, Firstov SA, Warren R (2006) Int J Refract Metal Hard Mater 24:61. doi:https://doi.org/10.1016/j.ijrmhm.2005.03.003
Upadhyaya A, German RM (1998) Met Mater Trans 29A:2631
German RM (1985) Metall Trans 16A:1247
Jurewicz SR, Watson EB (1985) Geochim Cosmochim Acta 49:1109. doi:https://doi.org/10.1016/0016-7037(85)90002-X
Kliauga AM, Ferrante M (2005) Acta Mater 53:345. doi:https://doi.org/10.1016/j.actamat.2004.09.030
Falk LKL (2004) J Mater Sci 39:6655. doi:https://doi.org/10.1023/B:JMSC.0000045598.74823.c6
Lawakami M, Terada O, Hayashi K (2004) J Jpn Soc Powder Powder Metall 51:576
Geguzin YE (1984) Physics of sintering. Nauka, Moscow
Geguzin YE (1979) Diffusion zone. Nauka, Moscow
Gusak AM, Lucenko GV (1998) Acta Mater 46:3343. doi:https://doi.org/10.1016/S1359-6454(98)00054-8
Savitskii AP (1993) Liquid phase sintering of the systems with interacting components. Russian Academy of Sciences, Tomsk, Russia
Thomma W, Thummler F (1969) Phys Sinter 1:C1
Lange FF (1982) J Am Ceram Soc 65:C23. doi:https://doi.org/10.1111/j.1151-2916.1982.tb10341.x
Heady RB, Cahn JB (1970) Metall Trans 1:185
Cahn JW, Heady RB (1970) J Am Ceram Soc 53:406. doi:https://doi.org/10.1111/j.1151-2916.1970.tb12142.x
Meredith B, Milner DR (1976) Powder Metall 19:38
Joseph B, Picat M, Barbier F (1999) Eur Phys J 5:19
Kalogeropoulou S, Rado S, Eusathopoulos N (1999) Scr Mater 41:723. doi:https://doi.org/10.1016/S1359-6462(99)00207-9
Glickman EE, Nathan M (1999) J Appl Phys 85:3185. doi:https://doi.org/10.1063/1.369659
Pejovnik S, Kolar D, Huppmann WJ, Petzow G (1979) In: Ristic M (ed) Sintering—new developments. Elsevier Scientific, Amsterdam, Netherlands, 285 p
Fredriksson H, Eliasson A, Ekbom L (1995) Int J Refract Metal Hard Mater 13:173. doi:https://doi.org/10.1016/0263-4368(95)94021-P
Liu J, German RM (2001) Metall Mater Trans 32A:165
Johnson JL, Brezovsky JJ, German RM (2005) Metall Mater Trans 36A:2807
Watanabe R, Masuda Y (1973) Trans Jpn Inst Met 14:320
Huppmann WJ (1979) Z Metallkd 70:792
Gessinger GH (1984) Powder metallurgy of superalloys. Butterworths, London
Park HH, Cho SJ, Yoon DN (1984) Metall Trans 15A:1075
Marion JE, Hsueh CH, Evans AG (1987) J Am Ceram Soc 70:708. doi:https://doi.org/10.1111/j.1151-2916.1987.tb04868.x
Yoon DN, Huppmann WJ (1979) Acta Metall 27:693. doi:https://doi.org/10.1016/0001-6160(79)90020-8
Kaysser WA, Zivkovic M, Petzow G (1985) J Mater Sci 20:578. doi:https://doi.org/10.1007/BF01026528
Gessinger GH, Fischmeister HF (1972) J Less Common Met 27:129. doi:https://doi.org/10.1016/0022-5088(72)90025-2
Gessinger GH, Fischmeister HF, Lukas HL (1973) Acta Metall 21:715. doi:https://doi.org/10.1016/0001-6160(73)90082-5
Swinkels FB, Ashby MF (1980) Powder Metall 23:1
Lindau L, Stjernberg KG (1976) Powder Metall 19:210
Sarian S, Weart HW (1966) J Appl Phys 37:1675. doi:https://doi.org/10.1063/1.1708583
Exner HE (1973) Z Metallkd 64:273
Chan YS, Lin ST (1998) Metall Mater Trans 29A:2885
Kemp PB, German RM (1991) J Less Common Met 175:353. doi:https://doi.org/10.1016/0022-5088(91)90022-V
Sigl LS, Kleebe HJ (1993) J Am Ceram Soc 76:773. doi:https://doi.org/10.1111/j.1151-2916.1993.tb03677.x
Chun DI, Kim DY, Eun KY (1993) J Am Ceram Soc 76:2049. doi:https://doi.org/10.1111/j.1151-2916.1993.tb08331.x
Prill AL, Hayden HW, Brophy JH (1965) Trans TMS-AIME 233:960
Kwon OH, Messing GL (1991) Acta Metall Mater 39:2059. doi:https://doi.org/10.1016/0956-7151(91)90176-2
Park SJ, Martin JM, Guo JF, Johnson JL, German RM (2006) Metall Mater Trans 37A:2837
Svoboda J, Riedel H, Gaebel R (1996) Acta Mater 44:3215. doi:https://doi.org/10.1016/1359-6454(95)00440-8
Clarke DR, Zaluzec NJ, Carpenter RW (1981) J Am Ceram Soc 64:601. doi:https://doi.org/10.1111/j.1151-2916.1981.tb10225.x
Clarke DR (1987) J Am Ceram Soc 70:15. doi:https://doi.org/10.1111/j.1151-2916.1987.tb04846.x
Medvedovski E (2001) Mater Chem Phys 67:32. doi:https://doi.org/10.1016/S0254-0584(00)00416-8
Stemmer S, Roebben G, Van Der Biest O (1998) Acta Mater 46:5599. doi:https://doi.org/10.1016/S1359-6454(98)00183-9
Sciti D, Bellos A (2000) J Mater Sci 35:3849. doi:https://doi.org/10.1023/A:1004881430804
Yang SC, German RM (1991) J Am Ceram Soc 74:3085. doi:https://doi.org/10.1111/j.1151-2916.1991.tb04305.x
Huppmann WJ, Riegger H (1977) Int J Powder Metall Powder Tech 13:243
Kwon OH, Messing GL (1990) J Am Ceram Soc 73:275. doi:https://doi.org/10.1111/j.1151-2916.1990.tb06506.x
Lou LKV, Mitchell TE, Heuer AH (1984) J Am Ceram Soc 67:392
Clarke DR, Thomas G (1978) J Am Ceram Soc 61:114. doi:https://doi.org/10.1111/j.1151-2916.1978.tb09251.x
Fang Z, Patterson BR (1991) In: Crowson A, Chen ES (eds) Tungsten and tungsten alloys recent advances. The Minerals, Metals and Materials Society, Warrendale, PA
Powers JD, Glaeser AM (1998) Interface Sci 6:22. doi:https://doi.org/10.1023/A:1008656302007
Takajo S, Kaysser WA, Petzow G (1984) Acta Metall 32:107. doi:https://doi.org/10.1016/0001-6160(84)90207-4
Yamashita T, Watanabe R (2003) J Jpn Soc Powder Powder Metall 50:821
Kozma L, Huppmann WJ, Bartha L, Mezei P (1981) Powder Metall 24:7
Zukas EG, Rogers PSZ, Rogers RS (1976) Z Metallkd 67:591
Courtney TH, Lee JK (1980) Metall Trans 11A:943
Courtney TH (1984) Metall Trans 15A:1065
Warren R (1977) Int J Powder Metall Powder Tech 13:249
Kang TK, Yoon DN (1978) Metall Trans 9A:433
Voorhees PW, Schaefer RJ (1987) Acta Metall 35:581. doi:https://doi.org/10.1016/0001-6160(87)90241-0
Ardell AJ (1972) Acta Metall 20:61. doi:https://doi.org/10.1016/0001-6160(72)90114-9
Davies CKL, Nash P, Stevens RN (1980) Acta Metall 28:179. doi:https://doi.org/10.1016/0001-6160(80)90067-X
DeHoff RT (1991) Acta Metall Mater 39:2349. doi:https://doi.org/10.1016/0956-7151(91)90016-T
Takajo S, Kawano M, Nitta M, Kaysser WA, Petzow G (1988) In: Somiya S, Shimada M, Yoshimura M, Watanabe R (eds) Sintering ’87. Elsevier Applied Science, London
German RM, Olevsky EA (1998) In: Proceedings 1998 powder metallurgy world congress, vol 2. European Powder Metallurgy Association, Shrewsbury, UK
Lu P, German RM (2001) J Mater Sci 36:3385. doi:https://doi.org/10.1023/A:1017943524875
German RM, Liu Y, Griffo A (2001) Metall Mater Trans 28A:215
Taniuchi T, Okada K, Tanase T (1997) In: Kneringer G, Rodhammer P, Wilhartitz P (eds) Proceedings of the fourteenth Plansee seminar, vol 2. Plansee AG, Reutte, Austria
White J (1973) In: Kuczynski G (ed) Sintering and related phenomena. Plenum Press, New York
Blaine DC, Bollina R, Park SJ, German RM (2005) Comput Ind 56:867. doi:https://doi.org/10.1016/j.compind.2005.05.013
Kim YS, Park JK, Yoon DN (1985) Int J Powder Metall Powder Tech 21:29
Kang SJL, Kaysser WA, Petzow G, Yoon DN (1984) Powder Metall 27:97
Smith JT, Wood JD (1968) Acta Metall 16:1219. doi:https://doi.org/10.1016/0001-6160(68)90003-5
Kang SJL, Kim KH, Yoon DN (1991) J Am Ceram Soc 74:425. doi:https://doi.org/10.1111/j.1151-2916.1991.tb06900.x
Park HH, Kwon OJ, Yoon DN (1986) Metall Trans 17A:1915
Miranzo P, Tabernero L, Moya JS, Jurado JR (1990) J Am Ceram Soc 73:2119. doi:https://doi.org/10.1111/j.1151-2916.1990.tb05282.x
Nelson RJ, Milner DR (1972) Powder Metall 15:346
Wahling R, Beiss P, Huppmann WJ (1984) In: Proceedings of sintering theory and practice conference, vol 15. The Metals Society, London, UK, p 1
Farooq S, Kemp PB, German RM, Bose A (1989) Int J Refract Metal Hard Mater 8:236
Guyard C, Allibert CH, Driole J, Raisson G (1981) Sci Sin 13:149
Puckert FJ, Kaysser WA, Petzow G (1983) Z Metallkd 74:737
Lea C, Muddke BC, Edmonds DV (1983) Metall Trans 14A:667
Bluementhal H, Silvermann R (1955) Trans AIME 203:317
Matsubara H, Brook RJ (1996) Ceram Trans 71:403
Matsubara H, Brook RJ (1996) Jpn Fine Ceram Cent Rev 8:87
Matsubara H (1999) Comput Mater Sci 14:125. doi:https://doi.org/10.1016/S0927-0256(98)00084-6
Matsubara H (2005) J Ceram Soc Jpn 113:263. doi:https://doi.org/10.2109/jcersj.113.263
Ryoo HS, Hwang SK, Kim BK, Chung HS (2000) Metall Mater Trans 31A:1925
Liu PL, Lin ST (2002) Mater Trans 43:2115. doi:https://doi.org/10.2320/matertrans.43.2115
Liu PL, Lin ST (2002) Key Eng Mater 227:67
Liu PL, Lin ST (2003) Mater Trans 44:924. doi:https://doi.org/10.2320/matertrans.44.924
Liu PL (2006) Comput Mater Sci 36:468. doi:https://doi.org/10.1016/j.commatsci.2005.05.006
Aldazabal J, Martín-Meizoso A, Martínez-Esnaola JM (2004) Mater Sci Eng A 365:151. doi:https://doi.org/10.1016/j.msea.2003.09.021
Luque A, Aldazabal J, Maríın-Meizoso A, Martínez-Esnaola JM, Gil Sevillano J, Farr R (2005) Model Simul Mater Sci Eng 13:1057. doi:https://doi.org/10.1088/0965-0393/13/7/004
Ising E (1925) Z Phys 31:253
Potts RB (1952) Proc Camb Philos Soc 48:106
Tikare V, Cawley JD (1998) Acta Mater 46:1333. doi:https://doi.org/10.1016/S1359-6454(97)00269-3
Tikare V, Cawley JD (1998) Acta Mater 46:1343. doi:https://doi.org/10.1016/S1359-6454(97)00268-1
Zhang D, Weng G, Gong S, Zhou D (2003) Mater Sci Eng B 99:428. doi:https://doi.org/10.1016/S0921-5107(02)00449-X
Itahara H, Tani T, Nomura H, Matsubara H (2006) J Am Ceram Soc 89:1557. doi:https://doi.org/10.1111/j.1551-2916.2006.00954.x
Lee SB, Rickman JM, Rollett AD (2007) Acta Mater 55:615. doi:https://doi.org/10.1016/j.actamat.2006.08.054
Chaix JM (1993) C R Acad Sci II 315:1725
Chaix JM (1994) In: Proceedings of the powder metallurgy world congress, vol 2. Les Editions de Physique, Les Ulis Cedex, France, 1557 p
Lee SM, Chaix JM, Martin CL, Allibert CH, Kang SJL (1999) Korean Met Mater 5:197
Lee SM, Chaix JM, Martin CL (2000) In: German RM, Messing GL, Cornwall RG (eds) Sintering science and technology. Pennsylvania State University, University Park, PA, 399 p
Nikolić ZS (1999) J Mater Sci 34:783. doi:https://doi.org/10.1023/A:1004577014266
Nikolić ZS (1999) Sci Sin 31:83
Nikolić ZS (2000) Sci Sin 32:61
Nikolić ZS (2002) Sci Sin 34:41. doi:https://doi.org/10.2298/SOS0201041N
Nikolić ZS (2005) Mater Sci Forum 494:387
Nikolić ZS (2006) Sci Sin 38:41. doi:https://doi.org/10.2298/SOS0601041N
Petersson A, Ågren J (2005) Acta Mater 53:1673. doi:https://doi.org/10.1016/j.actamat.2004.12.017
Wonisch A, Korn K, Kraft T, Riedel H (2006) In: Gumbsch P (ed) Proceeding on multiscale material modeling. Fraunhofer IRB, Stuttgart, Germany, 578 p
Markondeya Raj P, Odulena A, Cannon WR (2002) Acta Mater 50:2559. doi:https://doi.org/10.1016/S1359-6454(02)00083-6
Fan P, Fang ZZ, Sohn HY (2007) Acta Mater 55:3111. doi:https://doi.org/10.1016/j.actamat.2007.01.015
McHugh PE, Riedel H (1997) Acta Mater 45:2995. doi:https://doi.org/10.1016/S1359-6454(96)00378-3
Riedel H (1997) In: Kneringer G, Rodhammer P, Wildner H (eds) Proceedings of the plansee seminar. Plansee Holdings, Reutte, Austria, 233 p
Ganesan R, Griffo A, German RM (1998) Metall Mater Trans 29A:659
Olevsky EA, German RM, Upadhyaya A (2000) Acta Mater 48:1167. doi:https://doi.org/10.1016/S1359-6454(99)00369-9
Kraft T (2003) Model Simul Mater Sci Eng 11:381. doi:https://doi.org/10.1088/0965-0393/11/3/310
Binet C, Lencoski KL, Heaney DF, German RM (2004) Metall Mater Trans 35A:3833
Maximenko A, Roebben G, Van Der Biest O (2005) J Mater Proc Tech 160:361. doi:https://doi.org/10.1016/j.jmatprotec.2004.06.023
Blaine D, Park SJ, Suri P, German RM (2006) Metall Mater Trans 37A:2827
Villanueva W, Amberg G (2006) Int J Multiph Flow 32:1072. doi:https://doi.org/10.1016/j.ijmultiphaseflow.2006.05.003
Park SJ, Chung SH, Johnson JL, German RM (2006) Mater Trans JIM 47:2745. doi:https://doi.org/10.2320/matertrans.47.2745
Voorhees PW, McFadden GB, Boisvert RF, Meiron DI (1988) Acta Metall 36:207. doi:https://doi.org/10.1016/0001-6160(88)90039-9
Wonisch A, Kraft T, Riedel H (2006) Adv Sci Tech Paris 45:530.
Olevsky EA, Tikare V, Garino T (2006) J Am Ceram Soc 89:1914. doi:https://doi.org/10.1111/j.1551-2916.2006.01054.x
Park SJ, Martin JM, Guo JF, Johnson JL, German RM (2006) Metall Mater Trans 37A:3337
Acknowledgement
The authors are most thankful to Wei Li for his great care in reviewing the manuscript.
Author information
Authors and Affiliations
Corresponding author
Rights and permissions
Open Access This is an open access article distributed under the terms of the Creative Commons Attribution Noncommercial License ( https://creativecommons.org/licenses/by-nc/2.0 ), which permits any noncommercial use, distribution, and reproduction in any medium, provided the original author(s) and source are credited.
About this article
Cite this article
German, R.M., Suri, P. & Park, S.J. Review: liquid phase sintering. J Mater Sci 44, 1–39 (2009). https://doi.org/10.1007/s10853-008-3008-0
Received:
Accepted:
Published:
Issue Date:
DOI: https://doi.org/10.1007/s10853-008-3008-0