
Abstract
Governments, industry and academia are paying high attention to autonomous vehicles and platooning, due to their high potential to transform public and private transport and reduce carbon emissions generated by road transport. The road freight sector is expected to be an early adopter of the autonomous technology due to the potential cost reduction for logistics companies. However, despite the expected fuel savings and polluting emission reductions due to truck platooning, actual benefits would strongly depend on the adopted technology and the operational conditions of the system. This paper investigates the potential for truck platooning to reduce carbon emissions from road freight, presenting a series of scenarios that vary by adoption rates, operational models and platoon size. Scenarios were co-designed with freight stakeholders to build a Truck Platooning Roadmap (2025–2050), considering a specific case study: the UK. Polluting emissions and related external costs are calculated across the different scenarios. Results show that there is high uncertainty for the adoption of truck platooning, with a potential first phase involving a small pool of low-automated trucks, and a second phase with a larger pool of high-automated trucks, reflecting higher economic and environmental benefits. A series of other technological and policy considerations are presented to support policymakers to draw a zero-carbon road freight strategy.
Graphic abstract

Introduction
Despite the introduction in the last twenty years of increasingly more efficient vehicle technologies, and the implementation of a series of sustainable measures and policies, transport is still responsible for about 27% of carbon emissions in Europe (EEA 2019). Road freight is one of the greatest producers of carbon emissions and is expected to increase by 56–70%, with a related significant negative impact on the environment (ITF 2017; Mulholland et al. 2018). For this reason, it has indeed been identified as one of the key areas to intervene to meet the emission reduction targets at a global and local scale (CCC 2019). Interventions might include the design and implementation of new specific policies for road freight, but also the development and adoption of new technologies and automation (Jonkeren et al. 2019; Paddeu et al. 2019). In the last decade, autonomous vehicles (AVs) and platooning have drawn high attention from experts and practitioners, due to their high potential to transform transport systems (Patella et al. 2019). The road freight sector is expected to be an early adopter of the autonomous technology (Shladover 2017; Wadud and Anable 2016; Guerra 2015), as logistics companies would have higher benefits in terms of costs reduction. One third of transport costs are due to human resources (e.g. drivers), operation costs account for about 40–46% and fuel consumption for 20–25% (Seidenova et al. 2020). Some studies claim that these costs might be reduced with the implementation of platooning. However, despite potential fuel savings and polluting emission reductions (TRL 2016), the actual impact of truck platooning strongly depends on the technology adopted and the operational conditions of the system (He and Wu 2018; Larsen et al. 2019). Also, the literature does not provide many studies that evaluate the potential contribution of truck platooning to decarbonise road freight. Therefore, this paper investigates the environmental impact of platooned trucks (considering specific operational assets and applications) and explores their potential application, providing a roadmap for the uptake of truck platooning in the UK and a set of scenarios that present different potential environmental impacts and social costs up to 2050. The rest of this paper is organised as follows. The following section introduces the state of the art of the technology, international platooning experiences and identifies drivers and barriers for implementation. After the background, there is a section that presents the methodology, followed by a description and discussion of the results of the stakeholders’ interviews, the co-designed roadmap. This is follwed by the multi-scenario analysis and the evaluation of the environmental impacts and fuel savings, followed by considerations on external costs due to air quality damage. Finally the paper offers an insight about policy implications and suggestions to define a zero-carbon freight strategy, and conclusions on the main findings.
Background
The platooning technology
Truck platooning can be defined as an “energy-efficient vehicle control solution” (He and Wu 2018) that allows two or more vehicles, able to communicate and to coordinate each other, to travel in line (‘platoon’) with a close headway formation, taking aerodynamic advantage (Chan 2016) to reduce energy consumption (He and Wu 2018). The vehicles can be at least level-2 automated vehicles (SAE 2016) and can allow for longitudinal and lateral control at highway speeds (Besselink et al. 2016). The reduced distance between vehicles allows vehicles to accelerate or brake simultaneously (COMPANION 2016). The adoption of platooning would have an overall positive impact on safety, efficiency, congestion and pollution (Paddeu et al. 2019) and would result in a reduction in fuel consumption for all the vehicles in the platoon (Janssen et al. 2015). Another benefit would be the reduced travel time, which can be estimated in economic terms as approximately 167.7 million US dollars in 2020 (Jo et al. 2019). Calvert et al. (2019) identified two potential impacts of truck platooning on traffic flow: the longitudinal traffic effects (e.g. traffic stability, aggregated vehicle headways) and vehicle interaction effects (e.g. vehicle-to-vehicle interactions, mostly near ramps and weaving-sections). In their simulation study, Calvert et al. (2019) found that truck platooning might negatively impact traffic flow performance, especially in a congested environment, with a slightly more positive effect for bigger size platoons.
Several studies claim that truck platooning will improve both environmental sustainability and profitability of trucks (Calvert et al. 2019; Paddeu et al. 2019), thus the road freight industry might potentially start investing in automation systems earlier than other sectors (Janssen et al. 2015). This is confirmed by other authors (Guerra 2015; Shladover 2017; Wadud and Anable 2016; Paddeu et al. 2019), who argue long-haul truck platooning is more likely to be applied to trucks rather than other road vehicles in the short-to-medium term. This is probably due to the expected high economic advantage for trucks for logistics companies (Wadud 2017) and also to the alarming shortage of truck drivers in several countries, such as Japan, North America and the UK (Tsugawa 2014; Wadud 2017). Another key point is that trucks usually travel for long distances, which would be a more suitable environment for autonomous driving applications than urban areas (Ginsburg and Uygur 2017).
The platooning experiences
Different European countries trialled truck platooning. The first project was Chauffeur, developed in the 1990s, followed by Chauffeur II, and SARTRE in the 2000s (Shladover 2017). Later, in 2016, six convoys of different brand truck experienced an international journey (from Sweden and Germany to Rotterdam) within the COMPANION project (COMPANION 2016). The most recent European project is probably ENSEMBLE (2019), which explores the potential for a multi-brand platooning application (ENSEMBLE 2019).
In the rest of the world, Japan and the USA started experimenting truck platooning in the 2000s, with the aim of investigating the technical feasibility of it and evaluating the actual fuel consumption (ATA 2015). Other projects were delivered in California—PATH (PATH 2017), in Germany—KONVOI (Tsugawa et al. 2016) and in Japan (Flämig 2016). ITS tested a convoy of trucks leading a series of cars, travelling at up to 90 km/h, with a minimum gap of 4 m (Flämig 2016). More recently, in 2017–2019, Singapore supported Scania and Toyota to design, develop and test an autonomous truck platooning system to move containers between terminals within Singapore’s port (Ministry of Transport of Singapore 2017). Currently, several truck manufacturers are testing platooning with the expectations of entering the market by 2020, in case the infrastructure does not require any change or adaptation to the system (Paddeu et al. 2019).
In terms of forthcoming projects, the UK’s Department for Transport has commissioned a 2-year platooning trial called ‘HELM’, run by the Transport Research Laboratory (TRL). It is the world’s first platooning trial to take place in a live commercial operating environment, to quantify real-world benefits, as it aims to compare 140 platooning journeys (100 miles each) with 140 journeys on the same routes with non-platooned trucks, collecting evidence on metrics ranging from fuel savings, emissions and safety (TRL 2016). A series of other trials are planned in Europe and the USA (Bishop 2019).
Key factors to drive truck platooning implementation
Several authors identified a series of benefits achievable with the adoption of truck platooning. Probably, the most claimed one is the reduction in fuel consumption due to more efficient driving and a related fuel costs reduction. Fuel costs can represent a great component (18–35%) of the overhead for a freight company (COMPANION 2016; Tsugawa et al. 2016; ATRI 2018). However, savings might vary depending on a series of factors, such as vehicle technology, distance between vehicles, congestion levels, vehicle speed and weather conditions. For example, there is an expectation that each truck in the platoon can save up to 10% of fuel (Janssen et al. 2015; Eckhardt 2016). It is worth noting that the results of a number of trials show very different rates, ranging from 5–11% (PATH 2017) to 3–4% (Man Truck Germany 2019). Also, according to Zhang et al. (2017), saving fuels might have a negative impact on timing, as scheduled arrival time might differ between vehicles. This would imply the need to set up a specific threshold depending on the different scheduled arrival times that can be used to make decisions about platooning or driving independently, depending on timing convenience.
An important driver to platooning implementation is the reduction in driver’s wage, which currently accounts for 35–43% of a company’s overhead (COMPANION 2016; Tsugawa et al. 2016; ATRI 2018). However, the potential economic benefit is limited if drivers cannot rest during the journey (Larsen et al. 2019). According to Tavasszy (2016), truck drivers might be able to deliver other admin-based tasks during the journey, due to reduced driving responsibilities. Alternatively, they might take breaks while the truck is travelling, enabling the platoon to drive for longer by rotating the front vehicle. The results of Tavasszy’s simulation show that the workload of the driver in the ‘following’ vehicle would be reduced by 50%, with the trucks rotating after 3 h, and an increase in kilometres travelled from 240 to 960 km. It is worth noting that the reduction in driver’s wage would be higher at higher levels of truck automation, with a best-case scenario of no drivers needed in the following vehicle(s) if these are all fully autonomous. A third important driver to platooning implementation is the potential to increase road capacity (Van Arem et al. 2006; Milanés et al. 2014), even though it is difficult to quantify the impacts of truck platooning on congestion in real-world settings (Ricardo, TRL and TTR 2014).
Other potential drivers include—improved road safety (ATA 2015), as currently over 95% of traffic collisions in the UK are due to human error (RSPA 2017), and 15–20% of accidents involving commercial vehicles are due to driver’s fatigue (Goel and Vidal 2013); and—opportunities for new business models and new freight stakeholders (e.g. platooning service provider) to access the market (Janssen et al. 2015).
Finally, another important advantage is that truck platoons would make use of the existing infrastructure if the development of the technology and regulations allows them to safely circulate on public roads (Bakermans 2016). However, Paddeu et al. (2019) argue that the road infrastructure should be adapted to automated transport systems to improve the overall efficiency and suggest to redesign the UK motorways in order to avoid a mixed-traffic environment (e.g. separated lanes for AVs/platoons, to reduce potential interactions with non-autonomous vehicles).
Challenges
Despite the high number of potential benefits highlighted in the previous section, there is a series of challenges that might prevent a successful implementation of truck platooning.
For example, Paddeu et al. (2019) noted that the perceived high convenience of truck platooning might negatively impact the use of other modes, with a potential modal shift from rail to road, which could potentially increase by 18% (Bakermans 2016).
Another important issue is the viability of multi-brand platooning due to compatibility issues of multi-branded vehicles in the same platoon (ACEA 2017). This seems to be a key issue to ensure high-penetration rates in the market (Bakermans 2016). Furthermore, multi-brand requires collaboration among stakeholders and competing businesses, which might be an additional major barrier (Janssen et al. 2015).
Another challenge is truck drivers’ acceptance and adoption (Paddeu et al. 2019). In fact, the drivers involved in the COMPANION project thought platooning was ‘unpleasant’ and ‘uncomfortable’ and felt that manual driving was safer. In addition, the other road users might not be willing to share the road space with platooned trucks. Both factors might influence the view of the Government in terms of regulations (Janssen et al. 2015).
High initial cost of investment could also be a challenge. This was estimated to be about 8–10k euros per truck (Janssen et al. 2015) and could potentially discourage smaller companies, which would be pushed-off from the market (Bakermans 2016). Also, it is worth noting that cost savings might vary depending on the position of the truck in the platoon, as the following vehicles are expected to have a greater advantage in terms of fuel savings and driver’s wage savings (Paddeu et al. 2019). This would generate an additional matter of how costs/benefits should be shared across the platoon, especially if it is a multi-brand truck platoon. Janssen et al. (2015) suggest a third party (e.g. platoon service provider) should manage this issue in order to ensure a fair adoption.
Another challenge is insurance and liability issues in case of accident (Janssen et al. 2015). Bakermans (2016) suggests the truck manufacturers should retain all liability in the event of a collision. The lack of a specific National and European legal framework and standards would prevent large-scale deployment of automated trucks and platooning (Eckhardt 2016; Paddeu et al. 2019).
Tables 1 and 2 show the main drivers and barriers identified above. Probably, the most important driver is the economic advantage companies might have due to fuel and driver’s wage savings. However, the state of the art does not provide an agreed fuel-saving rate, and forecasts look very different from the results of real-world tests.
Methodology
The methodology is drawn on the application of truck platooning to decarbonise road transport in the UK and is developed within two main steps:
-
Step one: definition of a roadmap (2025–2050) with different potential implementation rates of truck platooning in the UK. The roadmap represents a timeframe of a series of possible future scenarios for the adoption of truck platooning. It has been co-designed with UK key freight stakeholders, who were interviewed to discuss their thoughts about likely timelines of platooning uptake and potential drivers/barriers to implementation.
-
Step two: multi-scenario analysis with the evaluation of polluting emissions and related social costs. The scenarios were designed considering the results of step 1 (roadmap), and the traffic volumes, which were calculated through the Road Traffic Forecasts 2018 Visualisation Tool (RTF2018) provided by Department for Transport (2018; b).Footnote 1 Input data were used to create a Business as Usual (BAU) baseline scenario, which was used to design the other potential future platooning scenarios. Environmental impacts were calculated by considering the emission indicator values of carbon dioxide equivalent (CO2eq). In addition to carbon emissions, the authors decided to calculate particulate matter (PM2.5) and oxides of nitrogen (NOx) in order to carry out a more comprehensive analysis of the impact of truck platooning on air quality. The analysis was carried out considering the Department for Business, Energy and Industrial Strategy’s 2018 document (DBEIS 2018b) and the National Atmospheric Emissions Inventory data sets (NAEI 2017). Finally, external costs were estimated by considering the guidelines provided by Ricardo (2019) for the UK Department of Environment, Food and Rural Affairs (Defra).
Figure 1 shows the methodological approach used to evaluate environmental impacts and external costs through the different scenarios.

Methodological approach. The process starts with the definition of the roadmap using the qualitative data from the stakeholder interviews as an input. The roadmap is then used to design a series of scenarios. For each scenario, there is an evaluation of environmental impacts and external costs, which are calculated considering input data from RTF (2018), NAEI (2017) and Ricardo (2019) indicated in the white boxes in the bottom of the figure
Stakeholders’ perspective
Description of the sample
The literature describes different stakeholder groups that might be relevant for truck platooning, some of which do not exist yet. However, considering the initial implementation and adoption of the technology, it is possible to identify four main groups:
-
Original Equipment Manufacturers (OEMs): developers/manufacturers of the platooning systems. They will be mainly responsible for the timing related to the availability of autonomous and platooned in the market for carriers and shippers (Janssen et al. 2015).
-
Carriers and Shippers: the ‘users’ (Janssen et al. 2015). Their willingness to adopt platooned trucks will influence the market size and therefore the related decision of OEMs to invest in the technological development of platooning. They will interact with platooned trucks daily.
-
Policymakers and Regulators: responsible for regulating the circulation of platooned trucks in public roads. The ACEA (2017) highlight that a full implementation of truck platooning strongly depends on the availability of specific policies and regulations to enable their operability in public spaces.
-
Knowledge Institutions and Academics: stakeholders with theoretical and practical (trials) experience with platooning. They usually advice regulators and policymakers on new technologies due to their experience (Eckhardt 2016).
Based on this classification, the authors decided to identify a group of key stakeholders that could represent the four categories presented above. Interviewees were invited via email to take part in a 20–40-minute call interview and were provided with a Project Information Sheet with a description of the research project. The sample was opportunistically selected through a pre-questionnaire about their view towards platooning in order to have a diverse sample of ‘lovers’/‘haters’ and to avoid bias towards the technology.
The semi-structured interviews included 11 questions that aimed at understanding the stakeholders’ view towards truck platooning and its implementation in the UK. The interview included questions about predicted implementation dates and rates over a 25-year period (2025–2050), potential advantages/disadvantages, drivers/barriers to implementation. Interviews were audio recorded and results were then transcribed and analysed through thematic analysis to identify specific themes through qualitative analysis of data (Maguire and Delahunt 2017).
Six key freight stakeholders were invited to the interview that took place in July 2019 (Table 3). The pool of stakeholders included policymakers, academics, carriers and shippers. Unfortunately, no stakeholders from the OEM group replied to the invitation to take part in the interview, and this group was therefore excluded from the analysis.
Stakeholders’ view towards truck platooning
Results from the interviews show that stakeholders did not agree with a common timeline in terms of uptake, and two of them did not think truck platooning is going to be implemented at all in the future. They also acknowledged that (if implemented) it would significantly reduce fuel consumption and labour costs and thought the actual benefit would be with full autonomous trucks (no truck drivers on board). However, they believed reduction in fuel consumption would not be a sufficient reason to convince shippers to invest in the technology. They also thought the current UK motorway design and the level of congestion would not allow trucks to effectively platoon, with safety implications for the other road users.
In general, results from the interviews show that the future of truck platooning in the UK is highly uncertain. Stakeholders thought large-scale adoption would be more likely to happen in the further future and would correspond to high-level automation (Level 4 or 5). On the contrary, in the short-term period, it would only cover a small niche market. In any case, they thought adoption can be achieved only through multiple-stakeholder collaboration, to allow for a multi-brand platooning. It is notable that interviewees had a general negative viewpoint towards the implementation of truck platooning. In terms of operations, stakeholders expected the platoon to circulate only on motorways, and to be short (2–5 vehicles), in order to reduce safety risks at junctions. This thought is in line with previous experiments and studies (Janssen et al. 2015; Man Truck Germany 2019; TRL 2016). Some stakeholders suggested platoons should circulate on a segregated lane, confirming the results of Paddeu et al. (2019), but this would require high investments in the design of new road infrastructures, which was identified as a major barrier.
In sum, according to the results of the interviews, stakeholders imagined the most likely conditions for platooned trucks applications would be:
-
2-to-5 vehicles in a platoon;
-
application on motorways;
-
mixed-traffic environment.
Figure 2 shows the co-designed roadmap for the truck platooning adoption in the UK. Rates of adoption are indicated by year. In general, stakeholders expected:
-
a lower uptake rate with a driver’s support by 2025. This is a bit later time, if compared with the existing EU/US forecasts (i.e. 2020–2022).
-
a larger adoption around 2035, corresponding to a higher level of truck automation.
-
an increasing adoption rate later, reaching 90% of trucks able to platoon in 2050. This is in contrast to the results of Eckhardt (2016), who forecasted level-four multi-brand truck platooning to be introduced in Europe in 2020, with increasing uptake up to 50% in 2025.
Fig. 2 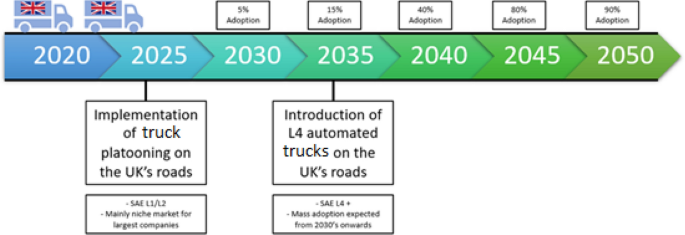
Truck platooning roadmap for the adoption in the UK

Definition of future scenarios
The roadmap presented in Fig. 2 and the NAEI data together with the RTF2018 tool were used as input to estimate the environmental impact (e.g. air quality) of truck platooning in the UK.
Table 4 presents five scenarios that were designed considering different traffic conditions and platoon size in accordance with the results of step 1.
Scenario 1: Business as Usual (BAU)
Scenario 1 (BAU) was designed considering the Road Traffic Forecasts 2018 Visualisation Tool—RTF2018 (DfT 2018) to forecast traffic up to 2050, with no automated or platooned vehicles circulating on the motorway. The RTF2018 can be used to predict road traffic or congestion up until 2050, highlighting the seven different scenarios created by the UK Government. It is possible to customise the prediction by vehicle type, road type or congestion rate. It does not consider autonomous/automated vehicles in its future projections. Scenario one represents a baseline for the creation of the ‘platooned’ future scenarios (2–5).
The creation of each scenario was undertaken through the following steps:
-
1.
Estimation of billion vehicle km (bvkm) driven by trucks on motorways every year up until 2050. The estimates were calculated in terms of miles driven by trucks on the motorways every five years from 2015 to 2050 through the RTF2018 tool and were then converted in km.
-
2.
Calculation of the average km driven by each truck on motorways per year (Ay) from 2015 to 2050, in order to be able to calculate the effects of the adoption rates of truck platooning with respect to the BAU. It can be expressed as follows:
$$A_{y} = \frac{\text{bvkm}}{{{\text{N}} . {\text{veh}}}} ( {\text{km}})$$where bvkm = billion of kms driven by trucks on motorways every year; N.veh = number of registered trucks in England and Wales (GOV 2018).
-
3.
Calculation of the amount of km driven by platooned trucks and not platooned trucks on motorways in England and Wales every year (2015–2050). The number of platooned trucks in the BAU scenario is equal to zero, while in the other scenarios depends on the rate indicated in the roadmap (Fig. 2).
-
4.
Calculation of air polluting emissions from trucks. CO2eq was calculated considering the DEFRA report (DBEIS 2018a) for average laden ‘All Heavy Goods Vehicles’. This corresponds to ICO2eq = 866.540 g of CO2eq per km. PM2.5 and NOx emissions were calculated considering NAEI (2017) data sets, with hot exhaust data for motorway speeds and an average value for rigid and articulated trucks (Table 5).
Table 5 NOx and PM2.5 indicators for rigid and articulated trucks -
5.
Estimation of future energy efficiency. The RTF2018 suggests an improved fuel efficiency by 12% for rigid trucks and 21% for articulated trucks by 2050 (DfT 2018: 68). It was therefore considered an average of 16.5% for the year 2050, with increases from zero spread evenly over the preceding 35 years (Table 6). These fuel efficiencies were then applied to the emission values to reflect the new, less polluting engines of the future.
Table 6 2015–2050 fuel efficiency trend estimation -
6.
Calculation of emissions. The kms driven by non-platooned trucks were multiplied by the emissions factors with the RTF2018 fuel efficiencies applied, resulting in the predicted emissions of CO2eq, PM2.5, NOx that were calculated as follows:
$$\begin{aligned} {\text{CO}}_{{ 2 {\text{eq}}}} & = \, A \times I_{{{\text{CO}}_{ 2} {\text{eq}}}} \times {\text{FE}}_{y} \,({\text{g}}) \\ {\text{PM}}_{2.5} & = \, A \times I_{{{\text{PM}}_{2.5} }} \times {\text{FE}}_{y} \,({\text{g}}) \\ {\text{NO}}_{x} & = \, A \times I_{{{\text{NO}}_{x} }} \times {\text{FE}}_{y} ({\text{g}})({\text{g}}) \\ \end{aligned}$$where A = average kms travelled by truck per year y; ICO2eq = polluting indicator for CO2eq (866.540 g/km); IPM2.5 = polluting indicator for PM2.5 (0.300 g/km); INOx = polluting indicator for NOx (0.813 g/km); FEy = Fuel efficiency at year (y)
Scenario 2 and Scenario 3: Platooned trucks in a mixed-traffic environment
Scenarios 2 (CFP2) and 3 (CFP5) present the integration of platooned trucks to the general traffic and take into consideration traffic congestion, which might affect the platoon’s efficiency (e.g. rates of fuel savings lower than the ones expected at higher speed). These scenarios were modelled considering expected congestion rates from the RTF2018, and the related yearly reduction in km travelled in a ‘platooned mode’ due to congestion. Scenarios 2 and 3 are the scenarios that are closest to the general believes of the interviewees, who thought it would be very unlikely the exclusive use of segregated lanes for platooned trucks. Similar to the design of the BAU scenario, after calculating the kilometres travelled by platooned and non-platooned vehicles across the timeframe 2015–2050, a fuel-saving factor of 2.65% was considered due to platooning. This was calculated as an average value of the fuel savings registered within a trial carried out in a motorway by B Schenker, MAN Truck & Bus and Fresenius University of Applied Sciences (MAN Truck Germany 2019). The trial environment was similar to Scenarios 2 and 3 (e.g. on the motorway, 2-vehicle platoon, mixed-traffic environment) and registered a 1.3% saving for the front vehicle and 4% for the following vehicle. Based on these considerations, it was possible to then calculate the emissions produced in Scenarios 2 and 3.
Scenario 4 and Scenario 5: Platooned trucks and exclusive use of the infrastructure
Scenarios 4 (FFP2) and 5 (FFP5) consider that platooned trucks can circulate on segregated lanes on the motorway. In this case, congestion does not have an impact on the vehicle’s ability to platoon, and fuel consumption is optimised.
Based on the results of the stakeholders’ interviews, it was considered a 2–5 vehicle platoon size (S2 to S5), and the impact of the number of vehicles in the platoon on fuel savings and emissions reduction was evaluated.
The adoption rates of platooned trucks considered for the multi-scenario analysis were in line with the roadmap (Fig. 2). It was assumed that trucks were diesel and would work in a platooned mode since the moment they access the motorway until the moment they exit it, not considering any interruptions for junctions.
Estimation of environmental impacts and fuel savings
All scenarios consider improved fuel efficiency, in line with RTF2018 estimations. In particular, for rigid and articulated trucks, fuel efficiency is expected to improve by 12% and 21%, respectively, by 2050. An average value of 16.5% was therefore considered in 2050, with a decreasing rate during the previous 35 years. Reduction in fuel consumption might vary depending on the operational scheme, such as the type of traffic, congestion, speed, and the number of vehicles in the platoon.
For all the platooned scenarios (S2 to S5), a fuel-saving factor of 2.65% was considered, as an average value of the recorded fuel savings for the front vehicle (1.3%) and the following vehicle (4%).
However, for scenarios 2 and 3, a congestion penalty rate was considered in order to reflect the negative impact of congestion on the ability to platoon and the related reduction in platooned km. The congestion penalty reduced the positive impact of truck platooning on emissions reduction. Also, considering that the number of vehicles in the platoon might have an impact on the fuel-saving rate, a 4.24% fuel-saving factor was considered for the five-vehicle platoon and a 2.65% for the two-vehicle platoon.
Table 7 summarises the potential fuel savings achievable by each scenario.
Potential polluting emissions savings
The results of the fuel consumption reduction were used to estimate the potential emissions reduction of—carbon dioxide equivalent—CO2eq (DBEIS 2018a);—particulate matter (PM2.5); and—nitrogen oxide (NOx) (NAEI 2017) by scenario. Hot exhaust data for motorway speeds were considered due to the application of truck platooning on motorways.
Figures 3, 4 and 5 show the potential emissions timeline by scenarios from 2025 to 2050.

CO2eq emissions timeline

NOx emissions timeline

PM2.5 emissions timeline
Interestingly, despite the predicted increasing volume of traffic on the motorway from 7.1 billion miles in 2015 to 8.07 billion miles in 2050 (DfT 2018), the BAU scenario shows a reduction in emissions due to the improved technology of truck and fuel efficiency (DfT 2018). Compared to the other scenarios, the BAU scenario looks the most polluting, confirming the potential of platooned trucks to reduce air pollution. Results show that congestion has a negative impact on the potential reduction in fuel consumption. However, the size of the platoon looks as a more important factor: results show that higher volumes of emissions are produced when two platooned vehicles travel on a segregated lane (FFP2), rather than when five platooned vehicles travel in a mixed-traffic environment (CFP5). Nevertheless, the feasibility and efficiency of a big size platoon are currently very uncertain, and there are diminishing returns once you have around 20 vehicles in a single platoon, because it is not possible to save more per vehicle that the max savings of a two-vehicle platoon (e.g. 5.3% for the calculations used in this study). Therefore, longer platoons do produce higher fuel savings and emissions reductions, but only up to a certain length in a case study such as this, where it is assumed all platooning-enabled HGVs are platooned for the whole time they are on the motorway anyway (Fig. 6).

Platoon length versus fuel savings per vehicle
It is worth noting that congestion might negatively impact the ability of truck platoons to realise the predicted fuel savings. In fact, if we consider the reduced CO2eq emissions due to truck platooning across the scenarios, there is only a 0.54% difference between a five-vehicle platoon in free flow conditions (FFP5), and a same size platoon driving in normal traffic conditions (CFP5). For this reason, the use of segregated lanes on the UK’s motorways for platooned trucks might have low value in terms of emissions reductions. Furthermore, the volumes of pollutant emissions were estimated considering the pollutant factors provided by NAEI, which considers different Euro standard engines (e.g. exhaust pollution limits set by the European Commission to help reducing the level of pollutant emissions produced by new vehicles—The AA 2019). The Euro 6 standard engine is the latest directive set by the EC and drastically reduces the amount of polluting emissions. Considering an average lifetime of 7.5 years for trucks in the UK (GOV 2018), the volume traffic forecasted by RTF2018 would include a great amount of Euro 6 trucks by 2025. This would mean that there would be a lower amount of PM2.5 and NOx produced by trucks during the timeline considered in the roadmap, and the effect of platooning would be meaningless. It is worth noting that ACEA (2017) argues that a further development of truck technology to accomplish with future Euro standards would be difficult to achieve, and the feasibility of zero emission trucks remains very uncertain.
Considerations on external costs due to air quality damage
According to PHE (2019), air pollution in the UK is responsible for 28,000–36,000 deaths per year due to long-term exposure. There is strong evidence that air pollution causes the development of coronary heart disease, stroke, respiratory disease and lung cancer, and asthma. This negative impact can be quantified in terms of related economic and/or social costs (e.g. external costs), which should be considered in policy appraisal, in order to be able to design a transport system that is efficient, while beneficial for society. Ricardo (2019) has produced a report for the UK Department of Environment, Food and Rural Affairs (Defra) to support with the assessment of air quality impacts and with the quantification of the related external costs for the UK. Considering a central damage cost of NOx and PM2.5 (Ricardo 2019—Table E1, page 10), the social cost (£) per tonne has been quantified as 6,199 £/t and 105,836 £/t, respectively. The social cost of CO2eq emissions has been estimated considering the Central Scenario on the updated short-term traded carbon values used for modelling purposes (DBEIS 2018a), which are shown in Table 8.
Considering the estimated volumes of polluting emissions by scenario presented in the previous section, Fig. 7 shows an estimation of the potential total (i.e. NOx, PM2.5, CO2eq) social cost reduction achievable with truck platooning in 25 years (2025–2050) with respect to the non-platooning scenario (BAU).

Potential social cost reduction by scenario—reductions are calculated with respect to the BAU scenario with no platooned vehicles on the road
Similar to the emission savings, social costs reduction with respect to the BAU scenario is higher for those scenarios with a bigger platoon size (FFP5 and CFP5), and the free-floating scenario (FFP5) presents a higher benefit (75.06 M£) than the congested scenario (CFP5—65.84 M£). Even with the scenario with two-vehicle platoons circulating in a mixed-traffic environment (CFP2), there is a significant social cost reduction (41.15 M£), if compared to the BAU scenario. However, considering that social costs are calculated based on the polluting emissions reduction due to each scenario, also in this case, savings are not high. In fact, these could be much more significant if the trucks would make use of alternative fuels (e.g. natural gas) or electricity. In this case, the vehicles would produce fewer polluting emissions, and the related social costs would be lower.
Policy implications and zero-carbon road freight strategy
In the last twenty years, national authorities in Europe together with the European Commission have developed a series of measures, including the provision of financial support to develop and test solutions to reduce carbon emissions due to road transport. The results of this paper show that truck platooning can provide some benefits towards decarbonisation, but they are limited and might not be sufficient to reach the carbon reduction targets. For this reason, to design a road to zero-carbon road freight, policymakers might need to focus on a more structured plan that includes intervention on the freight system design and the use of new technologies.
Considering the system design, CCC (2008) suggests that a reduction in carbon emissions might be possible through a more sustainable fleet design with higher vehicle capacity and increased load factor, achievable through stakeholders’ collaboration and freight consolidation. An additional key factor would be to train truck drivers to improve their driving efficiency in order to support eco-driving and reduce fuel consumption. On the technology side, the Freight Carbon Review (DfT 2017) suggests the introduction of new technologies to reduce fuel consumption of trucks, including retrofitting equipment (e.g. aerodynamic devices and low rolling resistance tyres). By 2050, fuel efficiency might improve up to 5% due to low resistance rolling tyres the (DfT 2017), up to 13% due to increased aerodynamics of trailers (CCC 2018), up to 3% due to the adoption of low resistance rolling tyres (DfT 2017). Furthermore, the use of telematics might provide an additional extra 3% in fuel efficiency improvement (DfT 2017). The improvement in fuel consumption would result in a reduction in carbon emissions. All these factors would complement the use of new technologies, such as truck platooning, to maximise the benefit in terms of carbon emissions reduction. In addition to truck platooning, policymakers might want to consider other truck innovative solutions, such as the development of alternative fuels, e.g. as gas/biomethane (Ricardo 2019), hydrogen and electricity (Stettler et al. 2019). However, the promotion and implementation of clean fuels should be supported by an overall review and improvement of land use in order to have a coordinated reduction in direct and indirect emissions (Sajid et al. 2019). Anderhofstadt and Spinler (2019) suggest battery electric (BE), fuel cell electric (FCE), compressed natural gas (CNG) and liquefied natural gas (LNG) as promising technologies to reduce emissions. This would support the strategy of the Department for Transport (UK) to decarbonise road transport by 2050. With this aim, the Government could provide fiscal incentives to encourage the freight sector to use less pollutant fuels, while at the same time, create a refuelling network infrastructure (FTA 2012). In fact, the lack of proper infrastructure to enable new technologies was recognised as a major barrier to adoption (Anderhofstadt and Spinler 2019). However, Neves et al. (2017) found that electrification might have a negative effect on economic growth probably due to the high cost of electrifying the transport sector. Following Anderhofstadt and Spinler (2019), environmental policies and financial support from innovation policy could also reduce existing distrust from truck manufacturers that would be encouraged to invest in new technologies (e.g. alternative fuels and automation/platooning). Furthermore, results suggest that there might not be the market pull required by the UK logistics industry to make the implementation of truck platooning in the UK a success. This would therefore advice policymakers about the need to provide a substantial market push in order to encourage industry to widely adopt the technology.
Limitations
The study presents a series of limitations. First, carriers and shippers assume a key role for a successful implementation and adoption of truck platooning in the UK. However, the interviews carried out within this study highlighted that these two target groups have the biggest reservations about adoption, as they are not very convinced about fuel savings being a sufficient reason to support a business case. Second, it is worth noting that these considerations are based on a limited number of stakeholders, and the sample size of participants involved in step 1 is an important limitation. It would be interesting to interview a larger sample of stakeholders from the UK freight sector, to have a more comprehensive understanding of their views on truck platooning, and how/if it could fit to their business models. Third, calculations are based on a series of assumptions (e.g. potential fuel consumption rates) that might significantly change depending on the actual performance of the platoon technology in the future. Fourth, considerations are made based on the design and operational conditions of the UK infrastructure, thus emissions reduction might be different in other locations and with a bigger platoon size. Finally, the evaluation considered diesel platooning and results might change if other fuels or other sources of energy propulsion (e.g. electric tracks) were considered.
Conclusion
Despite the great enthusiasm towards the potential implementation of truck platooning in the USA and Europe, and the potential benefits in terms of fuel savings and air pollution reduction, this study found high uncertainty for its implementation in the UK. Truck platooning would represent an important solution to align with the UK decarbonisation strategy designed by Department for Transport. However, the design of the UK motorways, with a high density of junctions, might not be suitable for an effective implementation of long-haul truck platooning. In fact, it would negatively impact other road users’ safety and limit fuel savings due to the continuous interruption of the platoon mode.
Also, higher reductions of fuel consumption would rely on the implementation of higher level of automation that would allow to maximise the use of resources. Fuel-saving rates are therefore not sufficient to persuade UK trucking companies to invest in truck platooning. For all these reasons, the uptake of platooning on the UK motorways might take longer than in other countries and would require high-level cooperation among stakeholders.
In terms of operations, the study found that platoons might include two to five vehicles, would circulate together with the other vehicles on motorways, as segregated lanes might require very high investments in infrastructure. Under these circumstances, an initial adoption of truck platooning in the UK might aim at a niche market (e.g. big freight companies), with a larger penetration later, corresponding to the adoption of high-level automation and a removal of truck drivers. In fact, this higher-automated scenario would correspond to higher cost savings, as platooning would require the presence of a driver in all the platooned vehicles conducting professional tasks other than driving, whose costs would be very difficult to estimate. On the other hand, with higher levels of automation, the driver can be removed, with a cost reduction up to 30% of total costs (Seidenova et al. 2020). This is believed to be the highest catalyst for a greater adoption of automated platooned trucks in the UK. In conclusion, the study shows that there is a potential for small reductions in polluting emissions due to truck platooning. However, this mainly depends on the fuels savings, which resulted being limited (even in the best-case scenario of free flow platooning and high-adoption rates), and not sufficient to meet the 2050 Climate Change target.
Notes
The tool provides road traffic and congestion forecasts up to 2050.
References
ACEA (2017) What is truck platooning? https://www.acea.be/uploads/publications/Platooning_roadmap.pdf. Accessed 21 Feb 2020
American Transportation Research Institute (2018) An analysis of the operational costs of trucking: 2018 update: October 2018. https://atri-online.org/wp-content/uploads/2018/10/ATRI-Operational-Costs-of-Trucking-2018.pdf. Accessed 10 June 2019
American Trucking Association (2015) Automated driving and platooning: issues and opportunities. ATA Technology and Maintenance Council. https://orfe.princeton.edu/~alaink/SmartDrivingCars/ITFVHA15/ITFVHA15_USA_FutureTruck_ADP_TF_WhitePaper_Draft_Final_TF_Approved_Sept_2015.pdf. Accessed 28 June 2019
Anderhofstadt B, Spinler S (2019) Factors affecting the purchasing decision and operation of alternative fuel-powered heavy-duty trucks in Germany—a Delphi study. Transp Res D Transp Environ 73:87–107
Bakermans BA (2016) Truck platooning: enablers, barriers, potential and impacts. TUDelft. https://repository.tudelft.nl/islandora/object/uuid%3A3e4e265b-b84c-474b-85b9-9840a5c85464. Accessed 24 June 2019
Besselink B, Turri V, Van De Hoef SH, Liang KY, Alam A, Mårtensson J, Johansson KH (2016) Cyber–physical control of road freight transport. Proc IEEE 104(5):1128–1141
Bishop R (2019) LinkedIn. The three streams of truck platooning development. https://www.linkedin.com/pulse/three-streams-truck-platooning-development-richard-bishop. Accessed 28 June 2020
Calvert SC, Schakel WJ, van Arem B (2019) Evaluation and modelling of the traffic flow effects of truck platooning. Transp Res C Emerg Technol 105:1–22
Chan E (2016) SARTRE automated platooning vehicles. Towards Innov Freight Logist 2:137–150
Committee on Climate Change (2008) Building a low-carbon economy—the UK’s contribution to tackling climate change. London, CCC
COMPANION (2016) D2.7—documentation of the exploitation of the results. European Commission, 27 September. http://www.companionproject.eu/wp-content/uploads/COMPANION-D2.7-Documentation-of-theExploitation-of-the-Results.pdf. Accessed 01 June 2019
Department for Business, Energy and Industrial Strategy (2018a) Updated short-term traded carbon values used for modelling purposes. https://assets.publishing.service.gov.uk/government/uploads/system/uploads/attachment_data/file/671191/Updated_short-term_traded_carbon_values_for_modelling_purposes.pdf. Accessed 02 Sept 2020
Department for Business, Energy and Industrial Strategy (2018b) 2018 Government GHG Conversion Factors for Company Reporting. Available at: https://assets.publishing.service.gov.uk/government/uploads/system/uploads/attachment_data/file/726911/2018_methodology_paper_FINAL_v01-00.pdf. Accessed 03 Feb 2020
Department for Transport (2017) Freight carbon review 2017. moving britain ahead. https://assets.publishing.service.gov.uk/government/uploads/system/uploads/attachment_data/file/590922/freight-carbon-review-2017.pdf. Accessed 20 March 2020
Department for Transport (2018) Road traffic forecasts 2018: moving britain ahead. https://www.gov.uk/government/publications/road-traffic-forecasts-2018. Accessed 20 May 2020
Eckhardt J (2016) European truck platooning challenge 2016—creating next generation mobility. Storybook. file://nstu-nas01.uwe.ac.uk/users2$/j2-denby/Windows/Downloads/Storybook%20European%20Truck%20Platooning%20Challenge%202016%20(2).pdf. Accessed 12 June 2019
ENSEMBLE (2019) Platooning together. https://platooningensemble.eu/. Accessed 12 June 2019
European Environmental Agency (2019) Greenhouse gas emissions from transport in Europe. https://www.eea.europa.eu/data-and-maps/indicators/transport-emissions-of-greenhouse-gases/transport-emissions-of-greenhouse-gases-12. Accessed 20 May 2020
Flämig H (2016). Autonomous vehicles and autonomous driving in freight transport. In: Autonomous driving. Springer, Berlin, pp 365–385
Freight Transport Association (2012) A national gas refuelling network for HGVs. https://fta.co.uk/CMSPages/GetFile.aspx?guid=fbcc7bc3-e2a3-4199-b58c-2ce2ca7a9177&lang=en-GB. Accessed 28 Oct 2019
Ginsburg R, Uygur AR (2017) Changing technology in transportation: automated vehicles in freight, report for Illinois Department of Transportation. https://utc.uic.edu/wp-content/uploads/Automated-Vehicles-inFreight__Final-Report-08312017.pdf. Accessed 20 Feb 2020
Goel A, Vidal T (2013) Hours of service regulations in road freight transport: an optimization-based international assessment. https://pdfs.semanticscholar.org/4af5/3b6fa645b25227280d6bb0318dd892157b81.pdf. Accessed 26 June 2019
GOV (2018) Vehicle licensing statistics: 2018. https://www.gov.uk/government/statistics/vehicle-licensing-statistics-2018. Accessed 10 Aug 2019
Guerra E (2015) Planning for cars that drive themselves: metropolitan planning organizations, regional transportation plans, and autonomous vehicles. J Plan Educ Res. file:///C:/Users/JDenb/Downloads/Guerra_2016_Planning%20for%20cars%20that%20drive%20themselves.pdf. Accessed 24 Feb 2020
He X, Wu X (2018) Eco-driving advisory strategies for a platoon of mixed gasoline and electric vehicles in a connected vehicle system. Transp Res D Transp Environ 63:907–922
International Transport Forum (2017) ITF transport outlook 2017. OECD Publishing 2017. https://www.oecd-ilibrary.org/transport/itf-transport-outlook-2017_9789282108000-en. Accessed: 04 Nov 2019
Janssen R, Zwijnenberg H, Blankers I, de Kruijff J (2015) Truck platooning: driving the future of transportation. https://repository.tudelft.nl/search/tno/?q=title%3A%22Truck%20platooning%20%3A%20Driving%20the%20future%20of%20transportation%22. Accessed 01 June 2019
Jo Y, Kim J, Oh C, Kim I, Lee G (2019) Benefits of travel time savings by truck platooning in Korean freeway networks. Transp Policy 83:37–45
Jonkeren O, Francke J, Visser J (2019) A shift-share based tool for assessing the contribution of a modal shift to the decarbonisation of inland freight transport. Eur Transp Res Rev 11(1):1–15
Larsen R, Rich J, Rasmussen TK (2019) Hub-based truck platooning: potentials and profitability. Transp Res E Logist Transp Rev 127:249–264
Maguire M, Delahunt B (2017) Doing a thematic analysis: a practical, step-by-step guide for learning and teaching scholars. Dundalk Institute of Technology. http://ojs.aishe.org/index.php/aishe-j/article/viewFile/335/553. Accessed 05 July 2020
Man Truck Germany (2019) Platooning in the logistics industry: Researchers see great potential in real operations after tests. https://www.truck.man.eu/de/en/man-world/man-in-germany/press-and-media/Platooning-in-the-logistics-industry_-Researchers-see-great-potential-in-real-operations-after-tests-372998.html. Accessed 01 Aug 2019
Milanés V, Shladover SE, Spring J, Nowakowski C, Kawazoe H, Nakamura M (2014) Cooperative adaptive cruise control in real traffic situations. https://hal.archives-ouvertes.fr/hal-01091154/document. Accessed 23 June 2019
Ministry of Transport of Singapore (2017) Singapore to start truck platooning trials, 9 January [online]. http://www.portstrategy.com/news101/world/asia/singapore-to-start-truck-platooningtrials. Accessed 20 Jan 2020
Mulholland E, Teter J, Cazzola P, McDonald Z, Gallachóir BPÓ (2018) The long haul towards decarbonising road freight—a global assessment to 2050. Appl Energy 216:678–693
Neves SA, Marques AC, Fuinhas JA (2017) Is energy consumption in the transport sector hampering both economic growth and the reduction of CO2 emissions? A disaggregated energy consumption analysis. Transp Policy 59(C):64–70
Paddeu D, Calvert T, Clark B, Parkhurst G (2019) New technology and automation in freight transport and handling systems. https://assets.publishing.service.gov.uk/government/uploads/system/uploads/attachment_data/file/781295/automation_in_freight.pdf
Patella SM, Scrucca F, Asdrubali F, Carrese S (2019) Carbon footprint of autonomous vehicles at the urban mobility system level: a traffic simulation-based approach. Transp Res D Transp Environ 74:189–200
PATH (2017) Research: connected and autonomous vehicles: truck platooning. https://path.berkeley.edu/research/connected-and-automated-vehicles/truck-platooning. Accessed 10 June 2019
Public Health England (2019) Review of interventions to improve outdoor air quality and public health. https://assets.publishing.service.gov.uk/government/uploads/system/uploads/attachment_data/file/795185/Review_of_interventions_to_improve_air_quality.pdf. Accessed 29 Oct 2019
Ricardo (2019) Air quality damage cost update 2019. Report for Defra. https://uk-air.defra.gov.uk/assets/documents/reports/cat09/1902271109_Damage_cost_update_2018_FINAL_Issue_2_publication.pdf. Accessed 02 Sept 2020
Ricardo, TRL and TTR (2014) Heavy vehicle platoons on UK roads: feasibility study. https://assets.publishing.service.gov.uk/government/uploads/system/uploads/attachment_data/file/637361/truck-platooning-uk-feasibility-study.pdf. Accessed 23 June 2019
SAE International (2016) Surface Vehicle Recommended Practice: J3016: taxonomy and definitions for terms related to on-road motor vehicle automated driving systems (Revised from 2104). https://www.sae.org/standards/content/j3016_201806/. Accessed 01 Sept 2019
Sajid MJ, Cao Q, Kang W (2019) Transport sector carbon linkages of EU’s top seven emitters. Transp Policy 80:24–38
Seidenova U, Hundenborn J, Keuchel S (2020) Costs and capabilities of innovative concepts of long and heavy vehicles in Germany. Res Transp Bus Manag. https://doi.org/10.1016/j.rtbm.2020.100518
Shladover S (2017) Connected and automated vehicle policy development for California. Policy Briefs 3, doi.10.7922.G25Q4T10. https://escholarship.org/uc/item/2567n1bc. Accessed 24 June 2019
Stettler M, Woo M, Ainalis D, Achurra-Gonzalez P, Speirs J (2019) Natural gas as a fuel for heavy goods vehicles. https://www.sustainablegasinstitute.org/wp-content/uploads/2019/01/Technical-Report-1-Natural-Gas-as-a-Fuel-for-Heavy-Goods-Vehicles.pdf. Accessed 28 Oct 2019
Tavasszy (2016) The value case for truck platooning. https://www.researchgate.net/publication/312116529_The_value_case_for_truck_platooning. Accessed 24 June 2020
The AA (2019) EURO Emissions Standards: limits to improve air quality and health. https://www.theaa.com/driving-advice/fuels-environment/euro-emissions-standards. Accessed 24 Aug 2019
The Committee on Climate Change (2019) Home: tackling climate change: legal duties on climate change: UK regulations: the climate change act. https://www.theccc.org.uk/tackling-climate-change/the-legal-landscape/the-climate-change-act/. Accessed 18 June 2020
The National Atmospheric Emissions Inventory (2017) Emission factors for transport: fleet weighted road transport emission factor 2017. https://naei.beis.gov.uk/data/ef-transport. Accessed 27 Aug 2019
The Royal Society for the Prevention of Accidents (2017) Road safety factsheet: road crashes overview. https://www.rospa.com/rospaweb/docs/advice-services/road-safety/road-crashes-overview.pdf. Accessed 26 June 2020
TRL (2016) Heavy vehicle platoons on UK roads. https://trl.co.uk/heavy-vehicle-platoons-uk-roads. Accessed 12 June 2020
Tsugawa S (2014) Results and issues of an automated truck platoon within the energy ITS project. https://ieeexplore.ieee.org/stamp/stamp.jsp?tp=&arnumber=6856400&tag=1. Accessed 24 June 2019
Tsugawa S, Jeschke S, Shladover SE (2016) A review of truck platooning projects for energy savings. IEEE Trans Intell Veh 1(1):68–77
Van Arem B, Van Driel CJG, Visser R (2006) The impact of cooperative adaptive cruise control on traffic-flow characteristics. https://ieeexplore.ieee.org/stamp/stamp.jsp?tp=&arnumber=4019451. Accessed 22 June 2020
Wadud Z (2017) Fully automated vehicles: a cost of ownership analysis to inform early adoption. Transp Res A Policy Pract 101:163–176
Wadud Z, Anable J (2016) Automated vehicles: automatically low carbon? https://www.imeche.org/docs/default-source/1-oscar/reports-policy-statements-and-documents/automated-vehicles-automatically-low-carbon.pdf?sfvrsn=0. Accessed 27 June 2020
Zhang W, Jenelius E, Ma X (2017) Freight transport platoon coordination and departure time scheduling under travel time uncertainty. Transp Res E Logist Transp Rev 98:1–23
Acknowledgements
This project was supported by DecarboN8. DecarboN8 is funded by UK Research and Innovation (grant agreement EP/S032002/1).
Author information
Authors and Affiliations
Corresponding author
Additional information
Publisher's Note
Springer Nature remains neutral with regard to jurisdictional claims in published maps and institutional affiliations.
Rights and permissions
Open Access This article is licensed under a Creative Commons Attribution 4.0 International License, which permits use, sharing, adaptation, distribution and reproduction in any medium or format, as long as you give appropriate credit to the original author(s) and the source, provide a link to the Creative Commons licence, and indicate if changes were made. The images or other third party material in this article are included in the article's Creative Commons licence, unless indicated otherwise in a credit line to the material. If material is not included in the article's Creative Commons licence and your intended use is not permitted by statutory regulation or exceeds the permitted use, you will need to obtain permission directly from the copyright holder. To view a copy of this licence, visit http://creativecommons.org/licenses/by/4.0/.
About this article

Cite this article
Paddeu, D., Denby, J. Decarbonising road freight: Is truck automation and platooning an opportunity?. Clean Techn Environ Policy 24, 1021–1035 (2022). https://doi.org/10.1007/s10098-020-02020-9
Received:
Accepted:
Published:
Issue Date:
DOI: https://doi.org/10.1007/s10098-020-02020-9