
Abstract
Today’s factories are considered as smart ecosystems with humans, machines and devices interacting with each other for efficient manufacturing of products. Industry 4.0 is a suite of enabler technologies for such smart ecosystems that allow transformation of industrial processes. When implemented, Industry 4.0 technologies have a huge impact on efficiency, productivity and profitability of businesses. The adoption and implementation of Industry 4.0, however, require to overcome a number of practical challenges, in most cases, due to the lack of modernisation and automation in place with traditional manufacturers. This paper presents a first of its kind case study for moving a traditional food manufacturer, still using the machinery more than one hundred years old, a common occurrence for small- and medium-sized businesses, to adopt the Industry 4.0 technologies. The paper reports the challenges we have encountered during the transformation process and in the development stage. The paper also presents a smart production control system that we have developed by utilising AI, machine learning, Internet of things, big data analytics, cyber-physical systems and cloud computing technologies. The system provides novel data collection, information extraction and intelligent monitoring services, enabling improved efficiency and consistency as well as reduced operational cost. The platform has been developed in real-world settings offered by an Innovate UK-funded project and has been integrated into the company’s existing production facilities. In this way, the company has not been required to replace old machinery outright, but rather adapted the existing machinery to an entirely new way of operating. The proposed approach and the lessons outlined can benefit similar food manufacturing industries and other SME industries.
1 Introduction
1.1 Background and motivation
Industry 4.0 [18, 33] is described as “the digital transformation of the manufacturing industry, accelerated by exponentially growing technologies, such as intelligent robots, autonomous drones, sensors and 3D-printing” [6]. This concept, offering a new avenue for smart and sustainable manufacturing [3, 29], brings together digital manufacturing and information technologies [32]. The core concept of Industry 4.0 is the interconnection of employees, machines, orders, suppliers, customers and electronic devices with IoT to build smart ecosystems in factory environments. This manufacturing revolution allows very efficient data collection and analysis across different machines and equipment, enabling much faster and much more efficient production and business processes.
Industry 4.0 improves productivity, flexibility, resource efficiency, waste and energy consumption by transforming manual and disconnected manufacturing processes into digitalised, interconnected, interoperable systems within a smart environment that can allow making decisions through large-scale real-time data, real-time communication and cooperation with machines, sensors and operators, hence improving decision-making processes and accelerating collaboration at all levels.
The productivity gains from Industry 4.0 implementation are achieved by gathering and analysing data in real time from machines that lead to better and flexible processes, and reductions in error rates and costs. Such integration of technologies also offers unprecedented flexibility to respond more rapidly to problems and opportunities that lead to optimisation [14]. Industry 4.0 also facilitates resource optimisation by in unproductive set-up times on production lines. Notwithstanding all these promising prospects, the existing applications of modern digital technologies are usually underutilised or simply ignored by traditional small- and medium-sized enterprises (SMEs) [15, 38]. This is a very common issue, especially in food industry.
1.2 State of the art and research gap
Most of the existing approaches enabling Industry 4.0 transformation rely on switching to new technologies, machines or automation equipment [9, 13]. Although this is easier to achieve in large corporations, it is not always a viable solution for SMEs due to the huge financial barrier as a result of the size of investment required [31, 36]. For traditional SME manufacturers, a more critical challenge is that new machinery cannot guarantee producing the same quality products that their customers have been used to for generations. A slight variation in the product texture might lead to huge losses and impact their market position.
The consistency in food production has been the topic of various studies [39]. Brosnan and Sun [8] propose an approach to improve food consistency using image processing algorithms. However, in real-world settings, factors such as camera lens, filming angle and/or environmental luminance can affect the image processing accuracy. In certain settings, camera and other devices are not allowed due to variety of reasons including data protection. Recently, [12, 44, 45] have studied various technologies and devices, including IoT devices and wireless sensors, in food industry. Most relevant technology is based on data analysis, which means data collection and analysis are at the centre of improving efficiency and consistency. In this respect, [19] presents a case study focusing on understanding the use of big data in new food product development; [20] presents some big data models to make more informed production decisions in the food supply chain; [40] develops a new model for production management to minimise the reconfiguration of the production lines for different products; and [4] utilises big data to improve sustainability management in food supply chain design.
However, most of these approaches are piecemeal solutions with specific aspects without a systematic implementation of Industry 4.0, and none of them is within the context of traditional manufacturing, which imposes significant constraints to implement such solutions. An alternative approach is to utilise Industry 4.0 technologies for the century-old machines, but this is a huge challenge as there is no off-the-shelf solution readily available to be deployed and integrated directly to achieve the desired expectations and outcomes. Since there is no infrastructure for detecting, collecting, formatting, transferring, storing, analysing and/or archiving real-time data from production lines, the required pipelines for data capture, data mining and data visualisation become challenging during transforming and modernising traditional factories.
1.3 Aims and contributions
This paper presents a case study where we report the challenges of implementing Industry 4.0 technologies in a typical food manufacturing company and discuss how this transforms the company and its industrial processes. Recent survey papers have highlighted the need for the identification and exploration of more use cases for the application of Industry 4.0 models within production systems [34]. To our best knowledge and exhaustive literature review, our work is the first of its kind to outline lessons learned from applying Industry 4.0 technologies in a typical SME manufacturer.
The company, an SME located in the Yorkshire region of the UK with 50+ employees, is a very traditional business with a long and cherished heritage for producing water crackers (including Matzos) and biscuits, based on flame-baked traditional recipes, since 1900. However, in recent years, the financial performance had dropped as the poor capacity utilisation, resulting from major inconsistencies in product quality, taste and texture varying in production lines that are technically identical. The factory was not able to identify the underlying causes as they did not entirely understand the processes. This was mainly because production for generations relied on age-old equipment that offered limited manufacturing control being highly dependent upon experienced staff. When attempting to switch products between lines, it was impossible to have a flexible planning, preventing the company to reach its ‘real’ capacity. This resulted in under-utilisation of some production lines (stood idle), whilst running late shifts on other lines to keep up with demand. This significantly reduced the company’s efficiency and profits. Also, a lack of innovation and implementation of new technologies led to a bottleneck on maintaining and increasing its market position.
It was therefore business critical for the company to improve product consistency and increase its production capacity; hence, the design and implementation of a digitalised manufacturing platform as an initial step towards Industry 4.0 were required to make sure that factory’s strategic objectives would be met in a short, medium and long term.
To overcome these challenges, we have developed a state-of-the-art smart production control system utilising Industry 4.0 technologies, including big data analytics [15, 16, 26], Internet of things [5, 7, 17, 42, 45], machine learning [11], cyber-physical systems [24, 25] and cloud computing [27, 46]. This new smart manufacturing approach has allowed transforming production processes to produce good quality products based on real-time data-driven decision-making models.
By replacing the centralised manual decision-making with an intelligent decentralised modular system, the platform provides a smart control facility fulfilling the factory’s strategic targets on production consistency and capacity. The system is fully integrated into the company’s existing production facilities for the first time since the production started over a century ago. The platform not only permits understanding of the processes, but also provides an automated control facility that achieves consistency across different production lines by predicting perfect conditions to bake different products without requiring any experienced staff. This is a significant step change for the company as machine intelligence replaces chance and skill and tacit knowledge is made explicit by moving into intelligent decision-making. This reduces the risk associated with the manual decision-making and operation, which traditionally could only be done by experienced people.
The theory, knowledge and practice obtained in this work enable transformation from a traditional workshop to a modernised assembly factory. The results of this case study will be of great benefits to other manufacturing industries as they experience similar issues [21]. Also, the system developed in this work provides a reference architecture in order to implement Industry 4.0 technologies in similar industries.
1.4 Paper organisation
The paper is organised as follows: Section 2 describes the design principles of Industry 4.0 and presents how they are implemented in this factory. Section 3 discusses the outcomes of this work. Section 4 concludes the paper and lists our future work.
2 Design and implementation of Industry 4.0 solutions in traditional factory settings
2.1 Problem formulation
The production in this company has three main stages: i) pre-baking stage: supply chain (supplying and storing ingredients and raw materials) and mixing (mixing ingredients using specific formulas and cutting dough according to product-specific height); (ii) baking stage (cooking products in ovens for a specific period of time); and (iii) post-baking stage: quality control (inspecting baked products according to colour and texture), picking (collecting ‘perfectly baked’ products) and packing (see Fig. 1).

Production stages
The company experiences a large variation in product quality, taste and texture, resulting from the limitations of the existing processes. Currently, the quality control completely relies on skilled operators and trained workers. All products are made under the observation of experienced staff. Supply chain resources and networks are not traceable and raw materials are not being monitored. The temperature profiles of ovens are not known at all. No real-time data are collected, and no production parameters and/or properties are gathered during or before/after production. Also, there is no decision support system available for senior staff and managers as a manual decision-making procedure is in place across all processes. A limited number of outdated controllers have been installed in the factory; however, most of them are not interoperable with the existing age-old equipment. There is no computerised automation in any of the factory’s industrial processes. The company lacks the capability of developing a digitalised analytics platform to tackle these issues.
Recent studies [28] on the requirements for smart factory systems highlight and back this version of factories as a typical example of traditional manufacturing facilities.
In this study, we aim to transform the company’s existing production processes by developing a state-of-the-art smart production control system that utilises Industry 4.0 technologies. The methodology underpinning our work is described in the sequel.
2.2 Data collection
Data collection is the at the centre of our methodology. As the products are baked mainly in ovens, we first need to understand the temperature regime inside the ovens. Since the factory never measured the temperatures, the maximum temperatures reached were completely unknown. We have therefore designed and used a heat-resistant data logger with a thermal barrier for profiling the temperature inside the ovens during actual baking process [23].
The data logger used is protected by a thermal barrier, which can resist temperatures up to \(1372\,^{\circ }\mathrm {C}\). The sampling time frequency of the logger is 8 samples per second, and the accuracy is \(+/-1\,^{\circ }\mathrm {C}\). The data logger records the temperature measurements when it runs through the oven tunnel. The highest recorded temperature is around \(600\,^{\circ }\mathrm {C}\).
One particular challenge at this stage is the varying intervals of the gas burners located in different production lines (ovens). We have discovered that the gas burner intervals are significantly different in Lines 1 and 2 (see Fig. 2). Another challenge we have encountered is that the data logger cannot be run through Line 2 as the oven entrance is too narrow, and no data profiler can fit in. We could neither develop nor supply externally such a thin thermal barrier that can be fit into Line 2. This has prevented us obtaining an exact temperature map inside Line 2. To overcome this issue, we have calculated the approximate temperatures for Line 2 by observing the temperature values and the location of gas burners in Line 1. Our method is described as follows:

Two identical (same length, width and height) ovens with gas burners at different locations (the gas burner map for Line 1 is on the top, for Line 2 is on the bottom)
Assume each gas burner, GB\(_{i}\), provides the same heat radiation with the temperature measurement Temp\(_{i}\) (see Fig. 3). The temperature increment when data logger passes through one gas burner is calculated as
where Temp\(_{0}\) and Temp\(_{t}\) denote the temperature measurements at the entrance and the exit points of an oven, respectively; N is the total number of gas burners; k denotes the number of times the data logger is run with the same travelling time between any two points, i.e. \(T_{j}^{1} - T_{i}^{1} = T_{j}^{k} - T_{i}^{k}\). Here, \(T_{i} = D/V\), where D is the distance between GB\(_{0}\) and GB\(_{i}\) and V is the conveyor belt speed.

An oven profile, assuming each gas burner provides the same heat radiation with equal temperature increments, which results in a steady temperature increase as we go along the oven

Mean value of Line 1’s actual temperature profile (the orange plot), the approximate temperature profile of Line 1 calculated using Eq. 1 (the blue plot), and the approximate temperature profile of Line 2 calculated using Eq. 1 (the green plot). x-axis represents the gas burner index (i.e. GB\(_{i}\)) and y-axis represents the scaled temperature values
We have validated this method using the actual temperature readings from Line 1. In Fig. 4, the orange plot shows the mean value of Line 1’s actual temperature profile, and the blue plot illustrates the approximate temperature profile of Line 1 calculated using Eq. 1. The similarity between actual and calculated plots shows that Eq. 1 can be used for approximating a temperature profile for Line 2. In Fig. 4, the green plot shows the approximate temperature profile for Line 2, which can now be used in the following stages.
2.3 Real-time big data
Running the data logger through the ovens is important to understand the temperature regimes inside the ovens, but unlike Industry 4.0 IoT devices, this cannot produce a real-time big data collection process. The data can only be collected at real time by installing fixed probes, which requires drilling various points of an oven and placing the probes permanently. Since drilling is very risky for hundred year-old ovens, it is imperative to identify the optimal number of probes to be installed. Optimising the number of probes will prevent giving too much damage to the ovens, reduce the installation costs and reduce the complexity of machine learning process (another required stage of our methodology). On the other hand, installing too few probes will result in inaccurate temperature mappings. In order to achieve this, we have divided the ovens into a set of virtual zones. Each zone defines the location of a pair of probes to be installed. A related research on zones can be found in [30].

Sum of squared errors (SSE) candlestick chart after running k-Means Clustering (\(k \in [2,16] \)) 100 times
In order to identify the zones, we have applied the k-means clustering method. We have found the best k (zone numbers) by applying the sum of squared errors (SSE) method, using Eq. 2
where x is a data instance, i.e. a (scaled) temperature reading, in cluster \(C_i\) and \(\mu _i\) is the centroid of \(C_i\). Namely, we calculate the sum of the squared differences between the exact temperatures in a cluster, i.e. a zone, and their (nearest) mean (scaled) temperatures (predicted by k-means). Thus, a lower SSE value means less discrepancy between the actual data and the mean values, hence providing a better approximation for temperature profiles.
As Fig. 5 shows, the best value is obtained when \(k=16\) (the smaller the coefficient value, the more precise the zone definition). However, after \(k=8\), the gain obtained is very minimal. Considering too many zones with more probes may damage the oven, we choose \(k=8\). Therefore, based on these results, we have defined eight virtual zones for each production line, from the oven entrance to the oven exit. Each zone in the oven allows us to install two permanent IoT temperature detecting probes, controlled by a device gateway. The gateways are IoT-enabled devices, which means all temperature readings can be retrieved by accessing the gateway over Wi-Fi. Each of the probes provides temperature readings eight times per second. This results in a large amount of data to be collected and processed, key ingredient of big data analytics.
2.4 Internet of things and cyber-physical systems
One of the important components of Industry 4.0 is the fusion of devices and technologies of Internet of things and cyber-physical systems. By utilising computer and network-based devices, physical processes can be controlled using the feedback generated from physical systems, or vice versa (see Fig. 6). To achieve this, a number of environmental data monitoring sensors have been deployed in various locations within the premises. A centralised device gateway collects all environmental data including air temperature, air pressure and humidity. The gateway also uploads these measurements to a database. The stored data are monitored and displayed on the dashboard of the software platform, which is then used to control production processes.
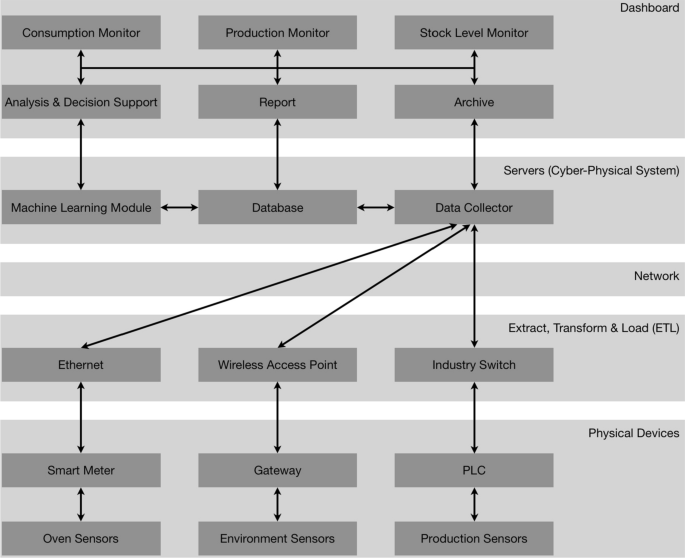
System architecture based on Industry 4.0, where the ‘physical devices’ layer contains gateway, smart meter (a digitalised meter that can host web server for data accessing), PLC (programmable logic controller) and all (Industrial) IoT sensors; the ‘ETL’ layer is the data tunnels developed and supported by different computer devices; the ‘cyber-physical system’ layer contains the data collector, database and the machine learning module; the ‘Dashboard’ hosts the data visualisation and decision support system as well as reporting and data archive
Although each device gateway is a centralised node for several environmental sensors, the whole network is decentralised and distributed. So, one or few component failures in the network will not result in entire system deadlock. Also, physical systems will trigger alerts on the dashboard with detailed error(s) and location(s).
In an Industry 4.0-enabled manufacturing system, data should be processed at real time with a flexible way for continuous data flow [2], because production resources need to be allocated (or re-allocated) as soon as possible to wherever they are needed. Therefore, both the speed of the cutters (cutting the crackers and biscuits in certain shapes before travelling through ovens) and the conveyor belts should be adjustable at run time so that the products can travel at right speeds (e.g. slower cutter and conveyor belt speeds result in more flame-burn on crackers and biscuits), and they does not cause too much or too less traffic in packaging area.
We have therefore installed two programmable logic controller (PLC) computing devices to control the speed of cutter and conveyor belt at real time. PLCs are able to adjust the speed by monitoring the production line. The speed information is displayed on the dashboard, and it is saved in the database.
2.5 Machine learning
One major issue in this factory is that two similar production lines are not able to produce the same quality products; even an individual production line using a unique recipe and the same ingredients does not produce the same quality product at times.
Machine learning can be used to discover patterns from datasets [10], which allows learning knowledge from human experts. It can even go beyond the human expertise by learning the ‘perfect conditions’ that lead to good quality products and fine-tuning product quality, hence achieving the consistency.
The challenge, however, is that there are many parameters, e.g. oven temperatures, environmental conditions such as air temperature, air pressure and humidity that can affect the quality of the products. In our initial trials, we used all data collected from the entire factory premises (see Sects. 2.3 and 2.4); however this made machine learning very cumbersome and slow; we therefore reduced the multi-dimensionality of the data by analysing the effect of each parameter in the product quality and consistency. Our analysis showed that although the environmental variables outside the baking area were important to monitor for pre-baking and post-baking processes, they had negligible effect on the baking process (as compared to oven temperatures); hence, in the machine learning process we only considered the environmental variables around the baking area.
We note that supply chain parameters and ‘dough consistency’ are other factors to consider, but this is a future work and not within the scope of this work.
As discussed above, we collect the data at real time on a large scale from the probes installed in each zone. We have actually gathered more than 250K data instances within a period of six months. For each baking episode whilst collecting the temperature map of the ovens, we have also recorded the quality of the baked crackers and biscuits. Namely, the factory’s quality engineers with expert knowledge with years of experience have manually given a baking score of 1.0 for ‘good’ quality crackers produced in a baking episode and -1.0 for products whose properties such as colour and texture did not meet the factory’s quality standards (see Fig. 8). In order to create our training data set, we have also monitored and collected all environmental data, such as air temperatures, surface temperatures, humidity and air pressure as well as the speeds of the cutters and conveyor belts. These data have been used as input for machine learning algorithms.

In both figures, x-axis represents an episode of one day operation of the ovens, and y-axis represents the scaled temperature readings of eight zones. a Temperature profile of Line 1. b Temperature profile of Line 2. This line usually operates less than Line 1; hence, one day episode is shorter
It is important to mention another challenge we had to overcome. Although Lines 1 and 2 are very similar (identical length, width and height), they have different gas burner maps (see Fig. 2), which means that the products are not exposed to the same temperature regime. A significant difference between the temperature profiles of Lines 1 and 2 can be observed in Fig. 7. As the figure shows, the products are exposed to very different temperatures, which is the main cause of the inconsistency issues across these lines.
Since Line 1 provides a better product quality, we have taken it as the reference line, and when applying machine learning in Line 2, we have used the training data obtained from Line 1 in order to force the predictors to apply the temperature profile of Line 1 to Line 2. To reduce the variability even further, the cutters’ speeds on both production lines are precisely adjusted to the same value. Both conveyor belts have been set at the same speed so that crackers and biscuits’ traveling time in both oven tunnels are equal (from oven entrance to oven exit).
In the training phase, as specified in Eq. 3, a model \(f_{m}\) is trained by the machine learning algorithm using the training set. Our training data contain the temperature readings of each zone and a ‘baking’ score of ‘1.0’ or ‘–1.0’ (i.e. product is ‘good’ or ‘bad’). Figure 8 illustrates a subset of our training data for a baking period of one day. Then, as specified in Eq. 4, the model is validated/tested by validating/testing the datasets for Line 2 prediction. In other words, we use the data collected from Line 1 to train machine learning models and then validate/test the trained models with the data collected from Line 2.

A subset of the training data. a Temperature readings of eight zones (obtained from Line 1, i.e. the reference production line). b Baking scores, Good (1.0) or Bad (−1.0), given for the quality of a product
To validate our results, we have divided the original dataset from production Line 1 into two groups, 70% of the data as the model training set and the rest as the model testing set. As summarised in Table 1, KNN classifier has the highest training score and prediction accuracy. Thus, we can be confident this model is a good predictor.
Machine learning transforms the existing processes, where the quality of products depends on chance and skill such that operators try to find the best baking conditions by controlling the equipment manually, e.g. adjusting gas valves of ovens by trial and error. This leads to significant waste and suboptimal products, which are not always ‘perfectly’ baked. Machine learning reduces the chances of baking crackers in wrong conditions by predicting the best baking conditions inside the ovens, hence enabling to achieve better quality products with the required standards for product properties that are being met.
2.6 Cloud-based dashboard
We initially used a local server to store the data collected from the IoT devices. But, we experienced a number of issues. The system needed to be upgraded once the stored data started scaling up. The server failed a few times (due to environmental conditions of the factory), which caused interruptions in the vital data collection process and significantly delayed the machine learning process. Also, the response time for troubleshooting was very slow, as the factory did not have any in-house IT specialist. The maintenance and emergency services were very expensive.
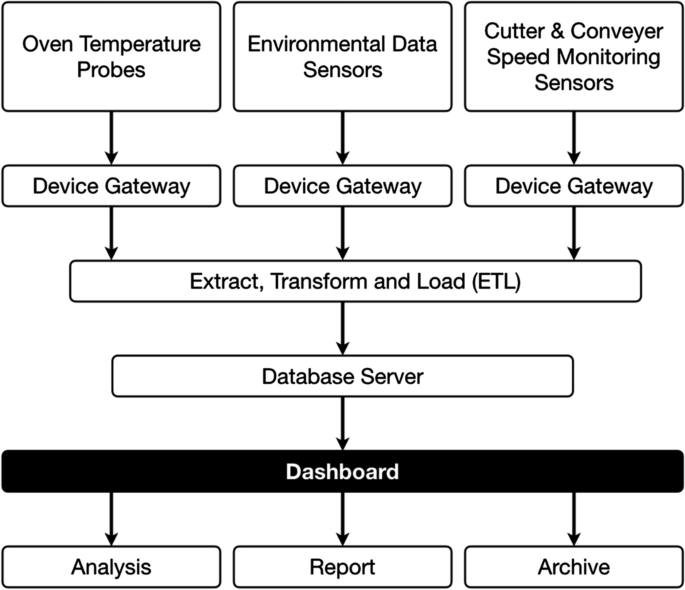
Dataflow
To address these issues, we have switched to a cloud-based solution. Cloud and edge-cloud environments are increasingly utilised in various services involving huge data migrations across the underlying network infrastructure [1]. We have designed and developed a cloud-based dashboard, which allows access to all IoT devices and interfaces at real time from anywhere (see Fig. 9). The system can (i) collect multi-scale data (including temperature maps inside the ovens, environmental data within the premises and operating parameters such as cutter and belt speeds from the production lines), multi-source data (including raw sensor data from the IoT devices and PLC-generated data), multi-variant data (including training sets, testing sets and validating sets) in cloud servers; (ii) present data visualisation for manufacturing information and knowledge; (iii) run machine learning algorithms and predict the product quality; (iv) support decision-making process; (v) provide application programming interface (API) access for external users on selected data resources; (vi) monitor consumption, production and stock levels; and (vii) report information for all stakeholders and external partners (e.g. supply chain resource report). In terms of costing, the cost of cloud services offsets the equipment and maintenance costs of using local servers; hence, this does not have a negative effect on the production cost.
One important feature of the cloud-based dashboard is that it provides a dynamic (optimal) temperature regime at a particular cooking episode based on the varying conditions and parameters (see Fig. 10). This allows the production team to have in-depth understanding of the process, which is invaluable for troubleshooting if any recurring issues arise. The dashboard also provides insight into the temperature map inside the virtual zones by utilising a colour-assisted visualisation tool (Fig. 11). The tool sends alert messages to the personnel in charge if the temperatures go below or above a certain defined threshold.

Dashboard chart visualisation

Dashboard zone visualisation
2.7 Virtualisation and smart factory
The term ‘virtualisation’ in Industry 4.0 means that all physical processes can be monitored either in a cyber-physical system or in an independent virtualisation layer. All sensor data and PLC data are linked to a serialised and simulated models. Thus, a virtualised factory in digital copies is created based on real-time data for monitoring and simulation; all models and their relationships in these copies form a virtualised smart factory. All production schedules, production guidances, productiveness and effectiveness are supported and provided. Therefore, production operators and factory managers are able to simulate changes on a virtualised monitor prior to inserting jobs into the real schedule. Meanwhile, a combination of several monitors can be used as a decision support system; for example, a production virtual monitor and a stock virtual monitor can help to make a production plan and schedule.
Three virtualised monitors (see Fig. 6) have been developed and setup for the entire factory: Consumption Monitor monitors how much flour, water and other ingredients are used for each product based on a particular production line, including statistical data for supply chain management; Production Monitor monitors what the currently production efficiency is for one particular product, including production guidance; Stock-Level Monitor monitors the factory warehouse stock level for all products, including historical datasets and seasonal predictions for marketing and sale plans.
2.8 Security and continuity
Each production line has one independent IoT device gateway installed for bridging all sensors and/or PLC consoles, as some sensors do not support energy-intensive protocols, such as Wi-Fi or BLE (Bluetooth Low Energy), and some others require a public network connection without a secured communication tunnel. All these device gateways are able to upload raw data onto the cloud data repository and send real-time notifications to the dashboard to report the production status.
Meanwhile, the gateway provides a trusted communication, which acts as an intranet proxy between data sources and archive repositories. Since there are potential security risks for the internet access through wireless interfaces for IoT devices [35], the gateways encrypt the communication tunnels and the data payloads; therefore, only verified data interfaces can be accessed from the internet by a secured application programming interface (API).
When one of nodes or an entire region has a failure, the rest of the nodes will continue to work together and trigger an alert to relevant stakeholders. There is only one exception: the system will stop when two nodes (or regions) try to execute conflicting goals. One solution for this issue is to delegate each task or goal to an executive priority level as a higher-level task has more priority to be executed.
Increased decentralisation and interoperability of Industry 4.0 systems lead to increased (cyber-)security risks [22, 37, 41, 43]. Based on our risk assessment, the potential security issues can be classified into two main categories: (i) direct attacks externally and (ii) indirect attacks from internal vulnerable devices. The objectives of these potential attacks are to access business critical data such as product recipes (resulting in a high business risk) and/or manipulate the production data (resulting in damage in production capability).
The security controls for these threats on the system level are: (i) to isolate the partition of business data and to secure the access to authorised staff only and (ii) to enforce production data access ‘read-only’ and to lock the ‘write’ function on the production control unit.
We have considered several security-related scenarios during the deployment and delivery of our system:
In the first scenario, one of the databases is hacked by intruders. To address this scenario, we have developed a secure API with VPN access to the target database, instead of only relying on database access credentials.
In the second scenario, one of the PLC devices connected to the internet is hacked by attackers. To address this scenario, we have revoked the ‘execute’ privilege from all user accounts except one secured ‘Editor’ profile, which does not participate in daily productions and/or operations, except for deploying fully tested PLC codes.
In the third scenario, one of the mobile devices used by production operators is hacked by intruders. To address this, we have set up a user-level access, where each system user has a unique access right for a particular activity. Also, we have introduced more ‘read-only’ operator user rights rather than ‘read-and-write’ rights.
We have also defined a business continuity plan to prevent events that result in the inability of the factory operation and/or production. The plan includes forming a continuity management monitor, a software-based database performance identifier. One of the most common performance bottlenecks in a software is the database I/O. There are various reasons for data storage performance issues and problems, but measuring the database I/O traffic and performance can also be used as a data measurement for monitoring the health of software systems. If latency becomes too large, or if the throughput of the database connection pool turns out to be too high, the system will notify the factory recovery team to confirm whether the system is running well. Meanwhile, this software continuity management has been deployed in the database server where the intranet and internet are not accessible.
2.9 Decentralisation and interoperability
The increasing requirements for efficiency, capability, consistency and productivity of production processes create new challenges for conventional centralised systems. Industry 4.0 provides new avenues for decentralisation and interoperability. Decentralisation allows each node (or a region) to make decisions for a particular purpose. Meanwhile, this approach tolerates failures on an individual unit or a group of nodes in the distributed device network. The core of interoperability is to integrate various systems, e.g. IoT and CPS devices. The interoperability consists of communications, protocols, standards and real-time data processing. It has been shown that interoperability between different operation and production devices is crucial for efficient food production.
Figure 6 shows our approach for interoperability and decentralisation of various modules and components.
3 Discussion
The work presented in this paper has led to significant achievements for the business. In the following, we outline some generic lessons useful for other similar SMEs and cases:
3.1 Efficiency, productivity and consistency
The implementation of Industry 4.0 proposed in this paper has allowed the factory to better understand the production processes, and the parameters (e.g. oven temperatures, environmental conditions, belt/cutter speeds, etc.), hence to achieve product consistency across different production lines. This has significantly increased the production efficiency. The company can now reduce the current risks involved with expanding the business, with an advanced operation, in order to deliver the consistency and low manufactured costs to maintain a competitive edge in markets where the company believes opportunity exists.
This smart manufacturing approach made tacit knowledge explicit, i.e. reducing the risk associated with the manual decision-making and operation, traditionally done by specific people, by moving into intelligent decision-making, operating on a large-scale real-time big data systems.
3.2 Lower operating costs
Whilst Industry 4.0 has improved the productivity and efficiency, it has also increased the capacity and reduced the waste. For example, using the dashboard features, operators are now able to monitor the optimum temperature proactively, resulting in savings in energy consumption. These savings have also a positive impact on environment as a result of reducing the usage of limited resources and lowering emissions. The system is also able to prevent downtime as maintenance becomes predictable; thereby, human labour and cost can be reduced as a result of increased efficiency and capacity.
3.3 Innovation
This original work has allowed a highly traditional food manufacturing company that still produces on machinery more than hundred years old to move over to Industry 4.0 without making huge investments in changing the existing machinery. This has therefore extended the life of the current production facilities and enabled the business to now consider capital investment based on performance data analysis and new production insights.
3.4 Transformation
This work not only has helped the business become a technology-driven enterprise and achieve its strategic objectives, but also led to a culture change within the company. Thanks to an open agenda through working with the academic institutions, from the technicians to the top management, all stakeholders in the company have welcomed this step change and been actively involved in transferring and integrating the knowledge/technology generated in the project into the business.
4 Conclusions
The application of Industry 4.0 in modern manufacturing industries is increasingly competitive, imperative but underutilised or ignored by traditionalist SMEs. This paper presents the design, development and implementation of Industry 4.0 in a traditional food manufacturer as a case study, where we have successfully utilised some emerging technologies, including Internet of things, big data analytics, machine learning and cyber-physical systems.
The smart production control system developed in this work provides a novel data collection mechanism and an intelligent decision support. The system has been successfully integrated into the company’s existing equipment and machinery.
Our results show that we can accurately predict the baking conditions to achieve product consistency. These results are important for the food industry, as operators and data scientists gain a new understanding of the data; the analysed results improve productivity and consistency, hence increasing performance and profitability.
Legacy infrastructure is a common occurrence in many of the industries. The movement towards smart factories and Industry 4.0 requires adequate and realistic use cases. The use case presented in this work, and the developed knowledge/technology will benefit other manufacturers with legacy infrastructure experiencing similar issues by providing a reference architectural system for implementing Industry 4.0 technologies in food manufacturing industries. This approach will also open new avenues for not only food companies but also other industries that are heavily reliant on manual control. The system architecture (Fig. 6) and the data flow architecture (Fig. 9) are generic enough to be adaptable and implemented in many manufacturing ecosystems.
The developed knowledge/technology will benefit other manufacturers with legacy infrastructure, experiencing similar issues, by providing a reference architectural system for implementing Industry 4.0 technologies in food manufacturing industries. This approach will also open new avenues for not only food companies but also other industries that are heavily reliant on manual control. The architecture presented in Fig. 6 is a generic approach that can be implemented in many manufacturing ecosystems.
Our future research will focus on integrating more food science aspect, in particular ingredients, and food processing, e.g. dough consistency, as well as supply chain aspects, e.g. the effect of storage in ingredient properties. We will also focus more on cyber security and system optimisation.
References
Aujla GS, Kumar N, Zomaya AY, Ranjan R (2018) Optimal decision making for big data processing at edge-cloud environment: An SDN perspective. IEEE Trans Indus Inf 14(2):778–789. https://doi.org/10.1109/TII.2017.2738841
Aujla GS, Singh A, Kumar N (2020) Adaptflow: Adaptive flow forwarding scheme for software-defined industrial networks. IEEE Internet Things J 7(7):5843–5851. https://doi.org/10.1109/JIOT.2019.2951235
Bag S, Gupta S, Kumar S (2021) Industry 4.0 adoption and 10R advance manufacturing capabilities for sustainable development. Int J Prod Econ 231:107844. https://doi.org/10.1016/j.ijpe.2020.107844
Belaud JP, Prioux N, Vialle C, Sablayrolles C (2019) Big data for agri-food 4.0: Application to sustainability management for by-products supply chain. Comput Ind 111:41–50. https://doi.org/10.1016/j.compind.2019.06.006
Bi Z, Xu LD, Wang C (2014) Internet of things for enterprise systems of modern manufacturing. IEEE Trans Industr Inf 10(2):1537–1546. https://doi.org/10.1109/TII.2014.2300338
Blunck E, Werthmann H (2017) Industry 4.0 - An opportunity to realise sustainable manufacturing and its potential for a circular economy. DIEM 3(1):644–666
Boyes H, Hallaq B, Cunningham J, Watson T (2018) The industrial internet of things (IIoT): An analysis framework. Comput Ind 101:1–12. https://doi.org/10.1016/j.compind.2018.04.015
Brosnan T, Sun DW (2004) Improving quality inspection of food products by computer vision–a review. J Food Eng 61(1):3–16. https://doi.org/10.1016/S0260-8774(03)00183-3
Buer SV, Strandhagen JO, Chan FTS (2018) The link between industry 4.0 and lean manufacturing: mapping current research and establishing a research agenda. Int J Prod Res 56(8):2924–2940. https://doi.org/10.1080/00207543.2018.1442945
Camci F, Eker OF, Baskan S, Konur S (2016) Comparison of sensors and methodologies for effective prognostics on railway turnout systems. Proc Inst Mech Eng Part F: J Rail Rapid Transit 230(1):24–42. https://doi.org/10.1177/0954409714525145
Diez-Olivan A, Ser JD, Galar D, Sierra B (2019) Data fusion and machine learning for industrial prognosis: Trends and perspectives towards industry 4.0. Inf Fusion 50:92–111. https://doi.org/10.1016/j.inffus.2018.10.005
Farr D (1990) High pressure technology in the food industry. Trends Food Sci Technol 1:14–16. https://doi.org/10.1016/0924-2244(90)90004-I
Frank AG, Dalenogare LS, Ayala NF (2019) Industry 4.0 technologies: Implementation patterns in manufacturing companies. Int J Prod Econ 210:15–26. https://doi.org/10.1016/j.ijpe.2019.01.004
Ghobakhloo M (2020) Industry 4.0, digitization, and opportunities for sustainability. J Clean Prod 252:119869. https://doi.org/10.1016/j.jclepro.2019.119869
Gokalp MO, Kayabay K, Akyol MA, Eren PE, Kocyigit A (2016) Big data for industry 4.0: A conceptual framework. In: 2016 International Conference on Computational Science and Computational Intelligence (CSCI), pp. 431–434. https://doi.org/10.1109/CSCI.2016.0088
Groger C (2018) Building an industry 4.0 analytics platform. Datenbank-Spektrum 18:5–14. https://doi.org/10.1007/s13222-018-0273-1
Gubbi J, Buyya R, Marusic S, Palaniswami M (2013) Internet of things (IoT): A vision, architectural elements, and future directions. Future Gener Comput Syst 29(7):1645–1660. https://doi.org/10.1016/j.future.2013.01.010
Hermann M, Pentek T, Otto B (2016) Design principles for industry 4.0 scenarios. In: Proceedings of the 2016 49th Hawaii International Conference on System Sciences (HICSS), HICSS ’16, p. 3928–3937. IEEE Computer Society, USA. https://doi.org/10.1109/HICSS.2016.488
Jagtap S, Duong L (2019) Improving the new product development using big data: a case study of a food company. British Food J 121(11):2835–2848. https://doi.org/10.1108/BFJ-02-2019-0097
Ji G, Hu L, Tan K (2017) A study on decision-making of food supply chain based on big data. Journal of Systems Science and Systems Engineering 26 https://doi.org/10.1007/s11518-016-5320-6
Kiel D, Müller JM, Arnold C, Voigt KI (2017) Sustainable industrial value creation: Benefits and challenges of industry 4.0. Int J Innov Manag 21(08):1740015. https://doi.org/10.1142/S1363919617400151
Korpela K, Hallikas J, Dahlberg T (2017) Digital supply chain transformation toward blockchain integration. In: T. Bui (ed.) 50th Hawaii International Conference on System Sciences, HICSS 2017, pp. 1–10. ScholarSpace / AIS Electronic Library (AISeL)
Lan Y, Konur S, Sutcliffe P (2018) A data collection and prediction methodology for manufacturing process: A case study in food industry. In: The 4th International Conference on Fuzzy Systems and Data Mining, vol. 309, pp. 428–434. https://doi.org/10.3233/978-1-61499-927-0-428
Lasi H, Fettke P, Kemper HG, Feld T, Hoffmann M (2014) Industry 4.0. Business Inf Sys Eng 6:239–242. https://doi.org/10.1007/s12599-014-0334-4
Lee J, Bagheri B, Kao HA (2015) A cyber-physical systems architecture for industry 4.0-based manufacturing systems. Manuf Lett 3:18–23. https://doi.org/10.1016/j.mfglet.2014.12.001
Lee J, Kao HA, Yang S (2014) Service innovation and smart analytics for industry 4.0 and big data environment. Procedia CIRP 16, 3 – 8 (2014). https://doi.org/10.1016/j.procir.2014.02.001. Proceedings of the 6th CIRP Conference on Industrial Product-Service Systems
Liu Y, Xu X (2016) Industry 4.0 and Cloud Manufacturing: A Comparative Analysis. Journal of Manufacturing Science and Engineering 139(3). https://doi.org/10.1115/1.4034667
Mabkhot MM, Al-Ahmari AM, Salah B, Alkhalefah H (2018) Requirements of the smart factory system: a survey and perspective. Machines 6(2):23. https://doi.org/10.3390/machines6020023
Machado CG, Winroth MP, da Silva EHDR (2020) Sustainable manufacturing in industry 4.0: an emerging research agenda. Int J Prod Res 58(5):1462–1484. https://doi.org/10.1080/00207543.2019.1652777
Manley D (ed) (1998) Baking and cooling of biscuits: What happens in a baking oven, types of oven, post-oven processing, cooling, handling, troubleshooting tips. Woodhead Publishing, Cambridge, England
Masood T, Sonntag P (2020) Industry 4.0: Adoption challenges and benefits for SMEs. Comput Ind 121:103261. https://doi.org/10.1016/j.compind.2020.103261
Nayyar A, Kumar A (eds.) (2020) A Roadmap to Industry 4.0: Smart Production, Sharp Business and Sustainable Development. Springer International Publishing. https://doi.org/10.1007/978-3-030-14544-6
Osterrieder P, Budde L, Friedli T (2019) The smart factory as a key construct of industry 4.0: A systematic literature review. International Journal of Production Economics p. 107476. https://doi.org/10.1016/j.ijpe.2019.08.011
Osterrieder P, Budde L, Friedli T (2020) The smart factory as a key construct of industry 4.0: a systematic literature review. Int J Prod Econ 221:107476. https://doi.org/10.1016/j.ijpe.2019.08.011
Prinsloo J, Sinha S, von Solms B (2019) A review of industry 4.0 manufacturing process security risks. Applied Sciences 9(23). https://doi.org/10.3390/app9235105
Raj A, Dwivedi G, Sharma A, Lopes de Sousa Jabbour AB, Rajak S (2020) Barriers to the adoption of industry 4.0 technologies in the manufacturing sector: an inter-country comparative perspective. Int J Prod Econ 224:107546. https://doi.org/10.1016/j.ijpe.2019.107546
The web of things: Bridging the IoT silos. www.w3.org/2016/05/26-dsr-bridging-the-silos.pdf
Schlaepfer RC, Koch M (2015) Industry 4.0: Challenges and solutions for the digital transformation and use of exponential technologies. Technical Report, Deloitte
Shewfelt RL, Bruckner B (eds) (2019) Fruit and vegetable quality: an integrated view. CRC Press, USA
Simon J, Trojanova M, Zbihlej J, Sarosi J (2018) Mass customization model in food industry using industry 4.0 standard with fuzzy-based multi-criteria decision making methodology. Adv Mech Eng 10(3):1687814018766776. https://doi.org/10.1177/1687814018766776
Singh M, Aujla GS, Singh A, Kumar N, Garg S (2021) Deep-learning-based blockchain framework for secure software-defined industrial networks. IEEE Trans Industr Inf 17(1):606–616. https://doi.org/10.1109/TII.2020.2968946
Sisinni E, Saifullah A, Han S, Jennehag U, Gidlund M (2018) Industrial internet of things: challenges, opportunities, and directions. IEEE Trans Industr Inf 14(11):4724–4734. https://doi.org/10.1109/TII.2018.2852491
Underwood S (2016) Blockchain beyond bitcoin. Commun ACM 59(11):15–17. https://doi.org/10.1145/2994581
Wang N, Zhang N, Wang M (2006) Wireless sensors in agriculture and food industry–recent development and future perspective. Comput Electron Agric 50(1):1–14. https://doi.org/10.1016/j.compag.2005.09.003
Xu LD, He W, Li S (2014) Internet of things in industries: a survey. IEEE Trans Industr Inf 10(4):2233–2243. https://doi.org/10.1109/TII.2014.2300753
Zhong RY, Xu X, Klotz E, Newman ST (2017) Intelligent manufacturing in the context of industry 4.0: a review. Engineering 3(5):616–630. https://doi.org/10.1016/J.ENG.2017.05.015
Author information
Authors and Affiliations
Corresponding author
Ethics declarations
Conflict of interest
The authors declare that they have no conflict of interest.
Additional information
Publisher's Note
Springer Nature remains neutral with regard to jurisdictional claims in published maps and institutional affiliations.
The work presented in this paper was financially supported by Innovate UK—Knowledge Transfer Partnerships (KTP010551). The project was rated ‘outstanding’ and awarded the ‘certificate of excellence’ by Innovate UK (https://ktn-uk.co.uk/news/outstanding-ktp-for-food-manufacturer-rakusens-limited-in-partnership-with-the-university-of-bradford). The ‘knowledge partnership’ has been recently shortlisted by KTN (UK Knowledge Transfer Network) in the Finalist for the Engineering Excellence Category (https://www.ktp-uk.org/case-study/ktp-best-of-the-best-awards-2020-finalists-announced/).
Rights and permissions
Open Access This article is licensed under a Creative Commons Attribution 4.0 International License, which permits use, sharing, adaptation, distribution and reproduction in any medium or format, as long as you give appropriate credit to the original author(s) and the source, provide a link to the Creative Commons licence, and indicate if changes were made. The images or other third party material in this article are included in the article's Creative Commons licence, unless indicated otherwise in a credit line to the material. If material is not included in the article's Creative Commons licence and your intended use is not permitted by statutory regulation or exceeds the permitted use, you will need to obtain permission directly from the copyright holder. To view a copy of this licence, visit http://creativecommons.org/licenses/by/4.0/.
About this article

Cite this article
Konur, S., Lan, Y., Thakker, D. et al. Towards design and implementation of Industry 4.0 for food manufacturing. Neural Comput & Applic 35, 23753–23765 (2023). https://doi.org/10.1007/s00521-021-05726-z
Received:
Accepted:
Published:
Issue Date:
DOI: https://doi.org/10.1007/s00521-021-05726-z