
Abstract
With recovery from the global financial crisis in 2009 and 2010, inflation emerged as a concern for many central banks in emerging Asia. We use data observed at mixed frequencies to estimate the movement of Chinese headline inflation within the framework of a state-space model, and then take the estimated indicator to nowcast Chinese CPI inflation. The importance of forward-looking and high-frequency variables in tracking inflation dynamics is highlighted and the policy implications discussed.


Notes
This mixed-frequency strand of literature now constitutes a growing branch of the real-time GDP forecasting literature. See also Asimakopoulos et al. (2013), who use mixed frequency data to forecast fiscal time series. However, only Aruoba and Diebold (2010), Monteforte and Moretti (2009) and Modugno (2013) have nowcasted inflation using high-frequency data. Stock and Watson (2007) use a different approach, showing that a univariate unobserved component model with stochastic volatility performs well in forecasting inflation in the United States.
Recent publications in the forecasting domain stress that incorporating information from Google Trends may offer significant benefits for real-time forecasts (see Vosen and Schmidt 2011). Data are provided on a weekly basis. We have refrained from adding Google Insights for Search search query data because Google’s share of the search engine market in China was around 20 % in 2011. Baidu, Google’s top Chinese competitor, had a 75 % market share. In any case, the Google data are only available from 2004 onwards.
The underlying nowcasting variable selection problem is to extract information from data sampled at high frequency while screening out short-term nuisances that are irrelevant to an inflation assessment and otherwise suppressed in lower frequency data.
We initially considered inclusion of oil future prices as daily indicators (specifically, the West Texas Intermediate Oil Future Price at the 1-month horizon). While oil prices exhibit a close correlation with the commodity price index, regulation of oil prices in China creates lags between the global market and domestic price adjustment. Thus, we only consider the commodity price indices in subsequent modeling.
Nevertheless, Porter and Xu (2009) note that interbank rates are not independent of other regulated interest rates.
Figure 2 gives the unweighted reserve requirement ratio. Recently, the People’s Bank of China broadened the asset base that banks will need to reserve against to control lending and battle high inflation. The new asset base includes customer margin deposits, i.e. what is paid by bank clients to secure the issuance of bankers’ acceptance, letters of guarantee, and letters of credit.
We use monthly pork prices, as daily pork prices have only been available since 2008. In the estimates, the number of observations is an issue because the estimates are only asymptotically correct, i.e. they provide the correct values only as the number of observations approaches infinity.
Pork prices were rising during 2010/11, partly due to swine disease pandemics and high grain prices. Moreover, demand for meat has been rising in China as consumers have become richer.
The appeal of this approach lies in its ease of calculation. Two main alternative methods have been used in the literature. The first is the distributed lag mixed data sampling (MIDAS) approach originally proposed by Ghysels et al. (2007). Subsequent papers have extended and evaluated the approach. Guérin and Marcellino (2011) have recently presented a Markov-switching mixed data sampling (MS-MIDAS) framework that allows for the use of mixed-frequency data in Markov-switching models. Kuzin et al. (2011) have recently compared MIDAS with a mixed-frequency VAR (MF-VAR) model. A second strand of the literature has recently suggested the use of large-scale factor models. The idea is to include a broad dataset to use all available information efficiently. See e.g. Banbura and Modugno (2010) and Yiu and Chow (2010). Of course, this is all part of the larger ongoing discourse on the relative merits of small vs. large datasets. An early survey is provided by Croushore (2006).
The maximum correlation coefficient (0.971) is obtained for the subsample of 2011.
Fig. 7 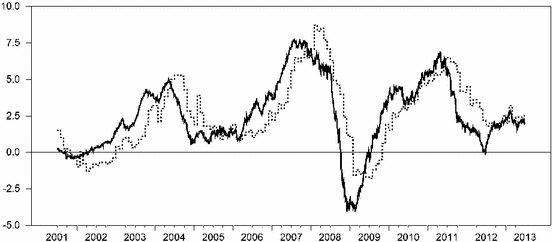
Estimated inflation indicator and headline inflation, Note The estimated indicator is normalized to have the same mean and the same variance as the monthly CPI inflation over the same sample period
The terms “nowcasting” and “forecasting” often overlap. Typically, next- and current-quarter forecasts are labeled as “forecasts” and “nowcasts,” respectively.
Forecasters generally agree that in-sample predictive ability does not necessarily guarantee out-of-sample predictive ability. In-sample tests can be biased by the use of the same data for estimation and forecast evaluation. One-step-ahead out-of-sample tests are therefore the preferred course of action. Clements and Hendry (2005) are emphatic that considerable care is needed in interpreting forecast comparisons. One reason multi-step forecasts may be poor guides on the credence of a model is that multi-step forecasts require strong exogeneity of the variables, while one-step-ahead forecasts need only weak exogeneity.
Examination of the autocorrelation and partial autocorrelation functions suggests that an ARIMA model with seasonal AR and MA terms, together with a nonseasonal MA term of order 2 is the preferred specification.
When only daily and weekly data are used, monthly CPI inflation cannot by definition be included as input variable when estimating the inflation indicator. To obtain the monthly inflation variable for the 3-month-ahead forecast, the inflation indicator is first normalised to have the same standard error and mean as actual inflation during the same time period. Then, given the lead time of the inflation indicator over actual inflation of approximately three months, we use the contemporaneous value of the indicator in the forecast.
Regarding the loss function specification, we report the results for quadratic loss. We do not show the results for the absolute loss case, as the results were qualitatively identical with both loss function specifications.
The data under analysis are not revised. This implies that the procedure employed performs a real-time nowcasting and forecasting exercise.
In early 2011, the People’s Bank of China announced that it was monitoring a new quantitative indicator for monetary policy, “total social financing.” This indicator includes, in addition to regular bank loans, trust loans and bankers acceptance bills, and financing through bond and equity markets.
At the same time, the People’s Bank of China recognizes the importance of structural factors (often country-specific in nature) that affect the relationship between money and inflation (People’s Bank of China 2010).

References
Aksoy Y, Piskorski T (2006) U.S. domestic money. Inflation and output. J Monet Econ 53:183–197
Aruoba SB, Diebold FX (2010a) Updates on ADS Index Calculation. University of Pennsylvania, Mimeo
Aruoba SB, Diebold FX (2010b) Real-time macroeconomic monitoring: real activity, inflation, and interactions. Am Econ Rev, Pap Proc 100:20–24
Aruoba SB, Diebold FX, Scotti C (2009) Real-time measurement of business conditions. J Bus Econ Stat 27:417–427
Asimakopoulos S, Paredes J, Warmedinger T (2013) Forecasting fiscal time series using mixed frequency data. European Central Bank, Working Paper 1550
Banbura M, Modugno M (2010) Maximum likelihood estimation of factor models on data sets with arbitrary pattern of missing data. European Central Bank, Working Paper 1189
Bank for International Settlements (2011) BIS 81st Annual Report
Clark TE, McCracken MW (2001) Tests of equal forecast accuracy and encompassing for nested models. J Econom 105:85–110
Clements MP, Hendry DF (2005) Evaluating a model by forecast performance. Oxford B Econ Stat 67:931–956
Croushore D (2006) Forecasting with real-time macroeconomic data. In: Elliot G, Granger C, Timmermann A (eds) Handbook of economic forecasting, vol 1. North Holland, Amsterdam, pp 961–982
Diebold F, Mariano R (1995) Comparing predictive accuracy. J Bus Econ Stat 13:253–263
Diebold F, Mariano R (2002) Comparing predictive accuracy. J Bus Econ Stat 20:134–144
Durbin J, Koopman SJ (2001) Time series analysis by state space methods. Oxford University Press, Oxford
Estrella A, Mishkin FS (1997) Is there a role for monetary aggregates in the conduct of monetary policy? J Monet Econ 40:279–304
Faust J, Wright J (2009) Comparing greenbook and reduced form forecasts using a large realtime dataset. J Bus Econ Stat 27:468–479
Faust J, Wright J (2012) Forecasting inflation. In: Elliot G, Timmermann A (eds) Handbook of economic forecasting, vol 2. Elsevier, Amsterdam, pp 2–56
Guérin P, Marcellino M (2011) Markov-switching MIDAS models. Centre for Economic Policy Research, Discussion Paper 8234
Ghysels E, Sinko A, Valkanov R (2007) MIDAS regressions: further results and new directions. Econom Rev 26:53–90
Harvey AC (1989) Forecasting, structural time series models and the Kalman filter. Cambridge University Press, Cambridge
Harvey D, Leybourne S, Newbold P (1997) Testing the equality of prediction mean squared errors. Int J Forecast 13:281–291
Kuzin V, Marcellino M, Schumacher C (2011) MIDAS vs. mixed-frequency VAR: nowcasting GDP in the Euro area. Int J Forecast 27:529–542
Ma G, Xiandong Y, Xi L (2011) China’s evolving reserve requirements. Bank for International Settlements, Working Paper 360
Modugno M (2013) Nowcasting inflation using high frequency data. Int J Forecast 29:664–675
Monteforte L, Moretti G (2009) Real time forecasts of inflation: the role of financial variables. Luiss Lab of European Economics, Working Paper 81
Newey W, West K (1987) A simple positive semi-definite, heteroscedasticity and auto-corre-la-tion consistent covariance matrix. Econometrica 55:703–708
Peng W, Chen H, Fan W (2006) Interest rate structure and monetary policy implementation in Mainland China. Hong Kong Monetary Authority, China Economic Issues 1/06
People’s Bank of China (2005) China Monetary Policy Report - Quarter One, 2005
People’s Bank of China (2007) China Monetary Policy Report - Quarter Two, 2007.
People’s Bank of China (2010) China Monetary Policy Report - Quarter Four, 2010
Porter N, Xu T (2009) What drives China’s interbank market? International Monetary Fund, Working Paper 09/189
Stock JH, Watson MW (2002) Macroeconomic forecasting using diffusion indexes. J Bus Econ Stat 20:147–162
Stock JH, Watson MW (2007) Why has U.S. inflation become harder to forecast? J Money Credit Bank 39(s1):3–33
Svensson LEO (1997) Inflation forecast targeting: implementing and monitoring inflation targets. Eur Econ Rev 41:1111–1146
Vosen S, Schmidt T (2011) Forecasting private consumption: survey-based indicators vs. google trends. J Forecast 30:565–578
Yiu MS, Chow KK (2010) Nowcasting Chinese GDP: information content of economic and financial data. China Econ J 3:223–240
Acknowledgments
The views expressed in this paper are those of the authors and do not necessarily represent those of the Bank for International Settlements. We are grateful to two anonymous referees for helpful comments and suggestions. Emese Kuruc provided able research assistance. All errors and omissions are entirely ours.
Author information
Authors and Affiliations
Corresponding author
Rights and permissions
About this article

Cite this article
Funke, M., Mehrotra, A. & Yu, H. Tracking Chinese CPI inflation in real time. Empir Econ 48, 1619–1641 (2015). https://doi.org/10.1007/s00181-014-0837-3
Received:
Accepted:
Published:
Issue Date:
DOI: https://doi.org/10.1007/s00181-014-0837-3