Abstract
The Juomasuo Au–Co deposit, currently classified as an orogenic gold deposit with atypical metal association, is located in the Paleoproterozoic Kuusamo belt in northeastern Finland. The volcano-sedimentary sequence that hosts the deposit was intensely altered, deformed, and metamorphosed to greenschist facies during the 1.93–1.76 Ga Svecofennian orogeny. In this study, we investigate the temporal relationship between Co and Au deposition and the relationship of metal enrichment with protolith composition and alteration mineralogy by utilizing lithogeochemical data and petrographic observations. We also investigate the nature of fluids involved in deposit formation based on sulfide trace element and sulfur isotope LA-ICP-MS data together with tourmaline mineral chemistry and boron isotopes. Classification of original protoliths was made on the basis of geochemically immobile elements; recognized lithologies are metasedimentary rocks, mafic, intermediate-composition, and felsic metavolcanic rocks, and an ultramafic sill. The composition of the host rocks does not control the type or intensity of mineralization. Sulfur isotope values (δ34S − 2.6 to + 7.1‰) and trace element data obtained for pyrite, chalcopyrite, and pyrrhotite indicate that the two geochemically distinct Au–Co and Co ore types formed from fluids of different compositions and origins. A reduced, metamorphic fluid was responsible for deposition of the pyrrhotite-dominant, Co-rich ore, whereas a relatively oxidized fluid deposited the pyrite-dominant Au–Co ore. The main alteration and mineralization stages at Juomasuo are as follows: (1) widespread albitization that predates both types of mineralization; (2) stage 1, Co-rich mineralization associated with chlorite (± biotite ± amphibole) alteration; (3) stage 2, Au–Co mineralization related to sericitization. Crystal-chemical compositions for tourmaline suggest the involvement of evaporite-related fluids in formation of the deposit; boron isotope data also allow for this conclusion. Results of our research indicate that the metal association in the Juomasuo Au–Co deposit was formed by spatially coincident and multiple hydrothermal processes.
Introduction
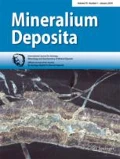
Finland is one of the few countries in the European Union that has economic reserves of “battery metals” and the only one producing Co at present. Cobalt is extracted as a byproduct from sulfide ores from the Sotkamo (black schist-hosted Ni–Zn–Cu–Co ore), Kevitsa (magmatic Ni–Cu sulfide ore), and Kylylahti (Cu–Zn massive sulfide ore) mines. Several epigenetic hydrothermal Au deposits in northern Finland, hosted by the Kuusamo belt (KB), the Central Lapland Greenstone Belt (CLGB), and the Peräpohja Belt (PB), are also enriched in Co (± Cu ± Ni ± LREE ± U) (Fig. 1a). These types of deposits have been classified by some workers as orogenic Au deposits with an atypical metal association (e.g., Eilu 2015). They share several similarities with classic orogenic Au deposits (e.g., Goldfarb and Groves 2015), with the most significant difference being the enrichment in base metals. A better understanding of hydrothermal processes leading to the formation of Au–Co deposits in these areas is needed in order to support exploration for new deposits. The added knowledge concerning these Co-rich deposits can also have implications for exploration on a global scale, as Au deposits with similar metal associations can also be found in several terranes outside of Finland (e.g., Slack 2013). Prominent examples of such deposits are those in the Idaho cobalt belt (Slack 2012), the Skuterud deposit in Norway (Grorud 1997), and the Werner Lake (Pan and Therens 2000) and NICO (Goad et al. 2000) deposits in Canada.

a Simplified geological map of Kuusamo belt (KB) showing location of Juomasuo Au–Co deposit (red circle). Other notable Au–Co deposits and occurrences within the KB are depicted with gray circles. Colors of formations correspond to units in stratigraphic columns in b. Insert map shows position of KB, Peräpohja belt (PB), and Central Lapland Greenstone Belt (CLGB) in Finland. Modified after Laajoki (2005) and Vanhanen (2001). b Stratigraphic column of KB showing stratigraphic setting of Au–Co mineralization. Modified after Huhma et al. (2018) with additions from Köykkä et al. (2019) and Lahtinen and Köykkä (2020). Section of Au–Co mineralization in the stratigraphy is taken from Vanhanen (2001). c Simplified geological map of Juomasuo deposit. Left map depicts surface geology whereas right map shows SW-NE cross-section of the same area. Rock descriptions in this geological map are based solely on alteration mineralogy as described by Vanhanen (2001). Modified after Pankka (1992) and Vanhanen (2001)
This study is focused on the Juomasuo Au–Co deposit (EUREF Easting 598681.7, EUREF Northing 7353837.1), located in northeastern Finland approximately 45 km north of the town of Kuusamo (Fig. 1a). The Juomasuo deposit is situated in the Paleoproterozoic Kuusamo belt (KB) and is part of the Kuusamo-Kuolajärvi orogenic Au metallogenic area (Eilu et al. 2012), which contains several epigenetic Au–Co (± Cu) deposits and occurrences (Pankka 1992; Vanhanen 2001). Juomasuo is the largest known epigenetic-hydrothermal Au–Co deposit in the Kuusamo belt. The current total mineral resource estimate for the Juomasuo deposit is 2.37 Mt grading 4.6 g/t Au and 0.13 wt% Co, and an additional 5.04 Mt of Co resources (accompanied by varying degrees of low-grade Au concentrations) grading 0.12 wt% Co (Dragon Mining 2014). Apart from Au and Co, the most commonly associated trace metals in the deposit are Cu, Mo, and REE, together with local enrichment of U (Vanhanen 2001).
The Au–Co deposits and occurrences in the Kuusamo belt have been explored and studied in the past but there are still open questions regarding formation of the peculiar Au–Co mineralization. Previous studies invoked various genetic classifications for the Au–Co (± Cu) mineralization in this belt, including orogenic Au with atypical metal association, iron-oxide-copper-gold (IOCG), epithermal Au, epigenetic Blackbird-type, and syngenetic type (Pankka 1992; Pankka and Vanhanen 1992; Vanhanen 2001; Eilu and Pankka 2009; Slack 2012; Slack 2013). The types of hydrothermal alteration and their relative timing, metal association, and nature of the mineralizing fluids each seem to fit into one or more of the proposed models. Another source of uncertainty is the potential polygenetic nature of these deposits.
One of the major aims of our studies of the Juomasuo deposit is to understand whether the Au and Co were deposited from a single fluid and the temporal relationship for deposition of these two metals. Another aim is to understand the role of the local lithologies in potentially controlling mineralization and the relationship of the alteration mineralogy to enrichment of Co and Au. In order to answer these questions, we use detailed petrography together with lithogeochemical data to evaluate the relationships between different metal associations within the distinct alteration zones and with protolith compositions. Results of paired sulfur isotope and trace element LA-ICP-MS analyses in sulfide minerals are used for discriminating mineralizing events. Sources of fluids are also evaluated by crystal-chemical and boron-isotope data for tourmaline.
Geological setting
Regional setting
The KB is a part of the larger Karasjok-Central Lapland-Kuusamo-Lake Onega greenstone belt that extends from northern Norway to Lake Onega in Russia (Pankka 1992). Rocks comprising this greenstone domain are part of Karelian supracrustal formations with ages ranging from 2.4 to 1.9 Ga (Silvennoinen 1972, 1992; Huhma et al. 2018). The KB was at least partially formed in an intracratonic failed rift related to Paleoproterozoic breakup of the Archean Karelian craton (Hanski and Huhma 2005). Stratigraphy of the KB includes several formations of volcanic and sedimentary origin, including products of three stages of mafic volcanism with associated mafic sills and dikes (Pankka 1992). Stratigraphy of the Kuusamo belt was first defined by Silvennoinen (1972, 1991) (Fig. 1b). Huhma et al. (2018) refined the stratigraphy of the belt by dividing the stratigraphic column into 11 formations, which belong to the Salla, Kuusamo, Sodankylä, and Savukoski groups, the same groups that are found in the Central Lapland Greenstone Belt. The stratigraphy of the KB was further refined (Köykkä et al. 2019; Lahtinen and Köykkä 2020) and now includes a formation belonging to the Kumpu Group as the uppermost unit (Fig. 1b). Total thickness of the volcano-sedimentary sequence in the KB varies from 5 to 7 km (Lahtinen and Köykkä 2020).
The stratigraphically lowest unit in the Paleoproterozoic basin fill, which overlies the Archean basement, is the continental clastic and shallow marine Posio suite that comprises quartzite and paragneiss (Köykkä et al. 2019). Overlying the Posio suite is the Sirniö Formation of the Salla Group. This formation contains felsic metavolcanic rocks (Fig. 1b). Overlying the Sirniö Formation is a polymictic conglomerate unit, less than 50 m thick. This conglomerate is overlain by mafic and intermediate-composition massive lava flows with some tuffaceous intercalations that were deposited in a subaerial environment, collectively making up the Vehnäsvaara, Kuusijärvi, and Kuntijärvi formations (together formerly known as Greenstone Formation I). Together with the conglomerate unit, these formations belong to the Kuusamo Group and are overlain by strata of the Sodankylä Group. These strata include basal tuffite schists and overlying sericite quartzite with interlayers of stromatolitic dolostone (Pekkala, 1985) and silicic schist, which probably has a felsic volcanic origin (Silvennoinen 1972, 1992). These rocks make up the Hukkavaara Formation (formerly Sericite Quartzite, Sericite Schist, and Quartzite Schist formations; Fig. 1b). Overlying the Hukkavaara Formation is a relatively thin (< 50 m) metabasaltic lava unit with pillow structures, known as the Petäjävaara Formation (formerly Greenstone Formation II). After deposition of the Petäjävaara Formation, sedimentation continued producing the Vaimojärvi Formation (formerly Siltstone Formation), which is composed of arkose, orthoquartzite, phyllite, and dolomite units. Overlying subaerial plateau basalt flows form the Ruukinvaara Formation (formerly Greenstone Formation III). The Ruukinvaara Formation is covered by a thick (600–800 m) unit of sericite quartzite with dolostone beds that grade upwards into arkose and finally glassy orthoquartzite, collectively forming the Rukatunturi Formation as the uppermost unit of the Sodankylä Group in the KB. The Rukatunturi Formation is overlain by dolostone, black shale, and basaltic tuff of the Savukoski Group. Karhu (1993) found evidence of carbon isotope excursion in the lower carbonate units of the Savukoski Group in the KB, findings that suggest the deposition of these units occurred during the late stages of the Great Oxidation Event (ca. 2.3 Ga; e.g., Bekker et al. 2004). Finally, sparsely outcropping conglomerate-sandstone associations of the Kumpu Group form the uppermost unit in the KB (Köykkä et al. 2019).
The stratigraphic sequence of the KB underwent deformation and regional metamorphism during the Svecofennian orogeny (1.93–1.76 Ga; Silvennoinen 1972, 1992; Lahtinen and Köykkä 2020). Deformation occurred in four stages (D1–D4; Lahtinen and Köykkä 2020), starting with an E-W compressional phase (D1), followed by a N-S shortening (D2) that produced F2 folds. Deformation continued with additional overprinting stages of folding during D3 and D4. Metamorphic grade varies from greenschist facies in the south and central parts of the KB to medium-pressure amphibolite facies in western parts, near the contact with the Central Lapland Granitoid Complex (Hölttä and Heilimo 2017). Higher metamorphic grade is also present in the northern and eastern parts of the KB. Lahtinen and Köykkä (2020) suggested that the gradual metamorphic zonation from greenschist facies in the south to amphibolite facies in the north can be explained by the presence of a long wavelength (70–100 km) major D4 anticlinorium, with the metamorphic grades increasing towards the hinge zone. This interpretation was partly based on results of wide-angle reflection and refraction surveys (Tiira et al. 2014) that showed ca. 8 km of upward bulging of lower and middle-upper crust from the southern KB to the Archean Suomujärvi complex (Fig. 1a) north of the KB. In the central part of the KB, the NE-trending F2 Käylä-Konttiaho anticline (Fig. 1a) is the major structure that is associated with the majority of significant Au–Co occurrences. The Käylä-Konttiaho anticline zone is approximately 20 km long and 5 km wide (Vanhanen 1990).
The epigenetic hydrothermal Co-Au deposits in the KB all share similar characteristics in terms of alteration assemblages and ore mineralogy but show some variation in the association of metals enriched in each deposit (Vanhanen 2001). A general sequence of alteration in the Kuusamo metallogenic area, which also includes the Juomasuo deposit, developed through several stages (Pankka 1992; Pankka and Vanhanen 1992; Vanhanen 2001): the oldest is extensive albitization that predates metamorphism and regional deformation. This was followed by syn- to late-metamorphic alteration stages with the first being Mg–Fe metasomatism. Afterwards, the rocks underwent K-metasomatism and local sulfidation accompanied by ductile deformation. The last stage of alteration includes carbonatization and silicification together with brittle deformation. Pankka (1992) divided the Au–Co deposits in the KB into a replacement type that is best represented by Juomasuo, and a breccia type with Konttiaho being a representative end member. The known Au–Co deposits in the KB have been found mostly in units near the upper and lower boundaries of the Petäjävaara Formation (Fig. 1b; Vanhanen 1990, 2001). Other notable deposits in the KB apart from Juomasuo include (1) Hangaslampi (1 km south of Juomasuo) with estimated resources of 0.369 Mt grading 5.1 ppm Au, 0.07 wt% Co, and 0.1 wt% Cu; (2) Kouvervaara with estimated resources of 1.58 Mt grading 5.1 ppm Au, 0.07 wt% Co, and 0.1 wt% Cu; and (3) Meurastuksenaho with estimated resources of 0.892 Mt grading 2.3 ppm Au, 0.2 wt% Co, and 0.1 wt% Cu (Vanhanen 2001).
Geology, exploration, and mining history
The Juomasuo deposit is situated in the northern part of the 25-km-long, NE-trending, F2 Käylä-Konttiaho anticline in an area that hosts several Au–Co occurrences (Fig. 1a). Mineralization at Juomasuo is structurally controlled by a NW-trending shear zone that cuts the Käylä-Konttiaho anticline (Vanhanen 2001; Eilu et al. 2012). Re–Os and U–Pb dating indicates that Au–Co mineralization in the KB, including the Juomasuo deposit, formed by multiple hydrothermal processes during the late stages (1.81–1.76 Ga) of the Svecofennian orogeny, postdating regional peak metamorphism (Pohjolainen et al. 2017; Molnár et al. 2020).
The exploration history in the Kuusamo area dates back to the late 1950s when the Finnish companies Suomen Malmi and Outokumpu Oy began extensive mineral exploration in the region. Several deposits were discovered then, and exploration for Au, Fe, and U continued through the efforts of several companies including Kemi Oy and Rautaruukki Oy. In the late 1970s, the Geological Survey of Finland (GTK) began exploration and research in the area that continued through the 1980s and 1990s. The Juomasuo deposit was discovered in 1985 by airborne magnetic and electromagnetic surveys. Mining rights for the deposit were first acquired at the beginning of the 1990s by Outokumpu Oy, who conducted test mining and a prefeasibility study. The deposit has changed ownership several times (Dragon Mining, Latitude 66 Cobalt Oy). To date, there has been no mining of the Juomasuo deposit. In fact, none of the deposits that have been discovered in the Kuusamo belt has been exploited so far.
Juomasuo consists of one major mineralized zone (lode) and several smaller sulfidized zones that are in the vicinity of the main ore body within an area of approximately 0.5 km2 (Vanhanen 2001). The major mineralized zone comprises foliated sulfide disseminations and relatively narrow (< 1 m) massive or semi-massive seams or veins that parallel the dominant foliation. Known surface dimensions of the main lode are 50 × 100 m (Vanhanen 2001). The main mineralized zone has been drilled to as much as 300-m depth and is continuous to that level, and dips to the SW at an average of 50 degrees (Fig. 1c). Most secondary sulfidized zones appear to pinch out with depth but these have not been drilled to similar depths as the main mineralized zone (Pankka 1992; Pankka and Vanhanen 1992; Vanhanen 2001; Fig. 1c).
According to Pankka (1989, 1992), the Juomasuo deposit hosts two main types of ore, Co ore and Au–Co ore. The Co ore is pyrrhotite-rich with minor pyrite and chalcopyrite, whereas the Au-rich ore lenses are pyrite-dominated (Witt et al. 2020). Vanhanen (2001) suggested an early timing for the deposition of cobaltite; in contrast, Witt et al. (2020) proposed that cobaltite was deposited during a late stage, superimposing Au-rich mineralizing event by remobilization of Co from the structure of pyrrhotite. According to the latter authors, both types of ore are foliated and characterized by ductile deformation.
The Juomasuo deposit lies beneath 5 to 8 m of till, which has only been removed at a pit used for test mining; geological interpretations are based on diamond drilling and geophysical data (Vanhanen 2001). Pervasive albitization, which according to Vanhanen (2001) predates the hydrothermal events that relate to the Au–Co mineralization within the KB, widely affected the rocks in the area (Fig. 2a). The mineralized zones also contain quartz, chlorite, biotite, sericite, carbonate, amphibole, and talc in addition to albite. Owing to the intense alteration of the host and country rocks at Juomasuo, it is difficult to distinguish protoliths and determine their exact position in the stratigraphic column of the KB. That is why previous workers used a descriptive classification of the rocks at Juomasuo, based on dominant alteration mineralogy. Vanhanen (2001) suggested that the host rocks belong mostly to the upper parts of the unit that Silvennoinen (1972) classified as the Sericite Quartzite Formation, although he noted the difficulty in distinguishing rocks below and above the Petäjävaara Formation (Fig. 1b). According to Pankka (1989), host rocks of the Juomasuo deposit are principally metasedimentary in origin, together with altered meta-igneous rocks of ultramafic, mafic, intermediate, and felsic composition. Previous workers (Pankka et al. 1991; Vanhanen 2001) also classified the rocks in the deposit area into four categories, based on alteration mineralogy, including albite, chlorite-talc-amphibole, albite-amphibole-quartz-carbonate, and quartz-sericite-chlorite rocks. The chlorite-talc-amphibole rock type is interpreted as an ultramafic sill (Fig. 1c). The albite and albite-amphibole-quartz-carbonate rocks dominate the rocks outside the mineralized zones (Fig. 1c), and mostly have a metasedimentary protolith with some rocks having a felsic metavolcanic origin. The quartz-sericite-chlorite rocks are the main hosts of the mineralization and can be divided into quartz-chlorite and quartz-sericite rocks (Fig. 1c). Importantly, the Co ore can be found throughout the chlorite-rich parts of these rocks, whereas the Au–Co ore is present mainly in the sericite-rich parts (Vanhanen 2001). Witt et al. (2020) connected the deposition of Co ore to chlorite alteration stages during Fe–Mg metasomatism and the later deposition of Au to K metasomatism forming Au–Co ore lenses that locally overprint the Co ore.

Representative photographs of recognized rock types at Juomasuo (a–d), photographs from mineralized intervals (i–m), and photomicrographs from each recognized rock type (n–s). All drill core samples are shown wet. Abbreviations: Ab = albite, Bt = biotite, Car = carbonate, Chl = chlorite, Qz = quartz, Ser = sericite, Tlc = talc. Rock types: a albitized rocks in the Juomasuo test pit; b pink, massive albitite with no origin-indicative textures; c albitite with preserved metasedimentary textures; d ultramafic meta-igneous rock; e mafic metavolcanic rock, f intermediate-composition metavolcanic rock; g metasedimentary rock; h felsic metavolcanic rock. Ore types: i pyrrhotite-dominated ore with 54.5 ppm Au and 1590 ppm Co; j pyrrhotite-dominated ore with 0 ppm Au and 5400 ppm Co; k massive pyrrhotite from ore zone with 0.02 ppm Au and 1510 ppm Co; l pyrite-dominated part of ore with 11.6 ppm Au and 2080 ppm Co; m pyrite-dominated part of ore with 1.0 ppm Au and 358 ppm Co. Photomicrographs from polished thin sections: n ultramafic meta-igneous rock, o mafic metavolcanic rock, p intermediate-composition metavolcanic rock, q felsic metavolcanic rock, r metasedimentary rock, s albitite of metasedimentary origin; crossed polars
Sampling and study methods
For this study, four drill cores (KS/JS 113, KS/JS 141, KS/JS 146, and KS/JS 159) completed by Dragon Mining were studied and sampled. The strategy was to collect samples from all rock units and all types of mineralization and alteration. The drill cores were documented by graphic logs. A total of 106 samples were selected for various analyses. Among those, 41 samples were selected for polished thin sections for detailed SEM-supported petrography; some of these samples were subsequently used for in situ trace element and sulfur isotope analyses of sulfides, and major-element and boron isotope analyses of tourmaline crystals. A more detailed description of the analytical methods presented in this chapter can be found in Online Resource 1.
Part of this study is based on whole-rock geochemical data of the studied drill cores provided by Dragon Mining. The whole-rock chemical analyses were acquired by ALS Global Ltd. at their laboratories in Rosia Montana, Romania, and Vancouver, Canada, during 2011. The dataset comprises multi-element analyses including major and trace elements. Mass-transfer calculations based on the whole-rock geochemical data were done using the EASYGRESGRANT Excel spreadsheet of López-Moro (2012). Values for the major oxides were recalculated as volatile-free to 100% prior to the mass-transfer calculations. Principal component analysis (PCA) based on the whole-rock geochemical data was performed using the XLSTAT software package (Addinsoft 2020) after transforming the data using a centered log-ratio transformation (Aitchison 1986) in order to eliminate the closure effect associated with geochemical data (Reimann et al. 2008).
Sulfide trace elements and sulfur isotopes were analyzed by laser ablation-inductively coupled plasma-mass spectrometry (LA-ICP-MS) at the Finnish Geosciences Research Laboratories located at the GTK in Espoo. Sulfur isotopes were analyzed at medium resolution (ΔM/M = 3000) and data for 32S and 34S were collected in static mode. Diameter of the laser beam was 40 μm using a fluence of 3.5 J/cm3 at 3-Hz frequency. The total sulfur signal obtained was typically 1.5–5 V for pyrite, whereas it was ca. 0.8–1.1 V for pyrrhotite and chalcopyrite. Under these conditions, after a 20-s baseline, 50–60 s of ablation was needed to obtain an internal precision for 34S/32S of ≤ ± 5 × 10⁻⁶ SE (standard error). For the trace element analyses, the diameter of the laser beam was 50 μm using a pulse frequency of 10 Hz and fluence of 2.5 J/cm3. Analyses were conducted using time-resolved analysis (TRA) with continuous acquisition of data for each set of points. Analyses were initiated with a 20-s baseline measurement, then the laser was automatically switched on for 40 s of signal acquisition. Data reduction was carried out using the GLITTER software program (van Achterbergh et al. 2001).
Tourmaline major-element data were acquired with an electron probe micro-analyzer (EPMA) at the GeoRessources laboratory, Université de Lorraine, Nancy. Boron isotopes in tourmaline were measured in situ by secondary ion mass spectrometry (SIMS) at the Centre de Recherches Pétrographiques et Géochimiques (CRPG), Nancy. Samples received a primary beam of O− at 13 kV with a diameter of about 20 μm. Secondary ions of 10B and 11B were analyzed with a mass resolution of 2000. Thirty cycles were made for each analysis.
Results
Classification of the altered host rocks
Intensely albitized rocks extend laterally up to several hundred meters and envelope the relatively narrow mineralized zones (Fig. 1c) that were affected by subsequent stages of alteration. As a result, primary rock-forming minerals have not survived; the pervasive degree of alteration thus makes it difficult and, in some cases practically impossible, to identify the fine-grained protoliths on the basis of mineralogy and texture (Fig. 2). Therefore, during our drill core logging, and for the classification of protoliths, we mostly utilized lithogeochemical data in combination with rarely preserved primary sedimentary and igneous rock textures, and type of pervasive alteration. Especially, the Nb/Y–Zr/TiO2 diagram of Pearce (1996; after Winchester and Floyd 1977), which is widely used as a proxy to the TAS diagram (Le Bas et al. 1986), proved to be an effective tool in our classification. Based on this geochemical classification, together with our observations during drill core investigations, host rocks of the Juomasuo deposit can be classified into metasedimentary and various meta-igneous rock types (Fig. 2). The meta-igneous rocks were divided into mafic and felsic metavolcanic rocks, and ultramafic rocks during drill core logging (Fig. 2). The plot of the meta-igneous rocks on the Nb/Y–Zr/TiO2 diagram resulted in distinct fields for each of the recognized rock types confirming the presence of ultramafic, mafic, and felsic meta-igneous rocks (Fig. 3). In addition, it resulted in the discrimination of intermediate-composition metavolcanic rocks that were initially included in the felsic metavolcanic category during drill core logging (Figs. 2f and 3(A)). Compositions of the metasedimentary rocks show some variation, but the bulk of the data display an intermediate to mafic affinity (Fig. 3). Graphical representations of the lithological interpretations of the four studied drill cores are presented in Fig. 4.

(A) Whole-rock geochemical data for samples from Juomasuo divided into meta-igneous and metasedimentary rocks and plotted on the Nb/Y–Zr/TiO2 discrimination diagram of Pearce (1996). Emerging fields corresponding to the different lithologies are shown, subdividing the meta-igneous rocks into ultramafic, mafic, intermediate-composition, and felsic types. Metasedimentary rocks do not have a separate field as they are a mixture of both felsic and mafic components. (B) All studied rock samples are categorized according to Co grade and plotted on the Nb/Y–Zr/TiO2 diagram. (C) All studied rock samples categorized based on Au grade and plotted on the Nb/Y–Zr/TiO2 diagram

Graphical logs showing lithologic interpretations and prominent textural features from the four studied drill cores (KS/JS-113, KS/JS 141, KS/JS-146, KS/JS-159). Corresponding Au and Co concentrations are also shown in logarithmic scale. Depicted are only the parts of the drill cores that were examined during our drill core logging. Thin orange rectangles on the right side of graphical logs mark parts of the rocks that are essentially albitites
Description of recognized host rocks
Rocks at Juomasuo outside of the mineralized zones mostly are albitites regardless of protolith (Figs. 2a and 4). In some cases, even rocks within the ore zones can be described as albitites. These intensely albitized parts of the host sequence have high Na2O contents, which can be up to 10 wt%. The albitites are dominated by fine-grained albite together with varying amounts of fine-grained quartz, and typically lack observable primary features. Protoliths of the albitites can be distinguished by lithogeochemical parameters that are characteristic for each rock type and by locally preserved features such as original sedimentary laminations and grading in albitites of metasedimentary origin (Fig. 2c). The typical color of the massive albitites is pink (Fig. 2a–b), but turns to brown where iron-rich carbonates, postdating the albite alteration, are oxidized (Fig. 2c). Carbonate porphyroblasts range in diameter from a few millimeters to a few centimeters. Also, fine-grained carbonate commonly occurs in the albite-dominated groundmass. Tourmaline is locally present in the groundmass as disseminations of small (0.1–0.4 mm) needles and in association with pyrite in sulfidized parts of the albitites.
In areas proximal to the mineralized zones, the abundance of albite significantly decreases due to superimposed alteration. In these areas, quartz, chlorite, biotite, and sericite dominate the mineralogy along with various amounts of albite, amphibole, talc, and accessory minerals. Among these minerals, chlorite, biotite, and sericite dominate the ore zones, and are spatially connected to the enrichment of Au and Co. Within the mineralized zones, the host rocks can be described as chlorite (± biotite) or sericite schists regardless of the protolith. Chlorite forms tabular sheets, and in some parts of the deposit is the predominant mineral. Vanhanen (2001) defined the chlorite composition as ripidolite within the mineralized zones. Chlorite typically is closely associated with biotite, which was deposited synchronously and/or slightly later than the chlorite. Zones of biotitization are intercalated within areas of intense chloritization (Fig. 5a). Petrographic observations support the inference that sericitization was a later event compared to chlorite-biotite alteration (Fig. 5b–c).

Photomicrographs from Juomasuo thin sections (a–f) and SEM-BSE images from selected samples (g–i). a Sample dominated by chlorite alteration together with lesser biotite. b Extensive sericitization in a quartz-rich groundmass. c Sericite needles overprinting chlorite alteration. d Pyrite-dominated sample; one pyrite grain hosts a visible inclusion of gold. e Cobaltite and cobalt pendlandite inclusions in pyrrhotite. f Elongate pyrrhotite patch in pyrrhotite-dominant part of deposit. g Native gold occurring in grain boundaries between sulfides and rutile. h Native gold and tellurobismuthite embedded in silicates. i Compositionally mixed telluride grain associated with pyrrhotite. The telluride has a melonite core and rim of altaite. Abbreviations: Ab = albite, Au = native gold, Bt = biotite, Car = carbonate, Ccp = chalcopyrite, Chl = chlorite, Cob = cobaltite, Co-Pn = cobaltpentlandite, Qz = quartz, Po = pyrrhotite, Py = pyrite, Rut = rutile, Ser = sericite
The ultramafic rocks (Fig. 2d, n) make up a fine-grained, dark unit comprised of a chlorite-biotite-talc assemblage with carbonates forming large euhedral-subhedral porphyroclasts up to 6 mm in diameter. Biotite seams define the dominant foliation. Some albite pseudomorphs after original plagioclase can be observed locally. This rock unit corresponds to the ultramafic sill recognized by Vanhanen (2001). The ultramafic unit can be distinguished by characteristically high Cr and Ni concentrations (medians of 2220 and 854 ppm, respectively), and a distinctly narrow range of Zr/TiO2 ratios (0.006–0.009) with a median of 0.007. Effects of albitization are not evident in the ultramafic sill, suggesting possible emplacement after regional albitization. The ultramafic sill is the least-abundant meta-igneous rock at Juomasuo and was encountered in only two intervals in the logged parts of the four studied drill cores (Fig. 4).
The mafic metavolcanic rocks (Fig. 2e, o) are fine-grained and equigranular with chlorite and biotite being the dominant minerals. In some cases, chlorite is so abundant that it gives a dark grayish-green color to the rock. In places, the mafic rocks are also sericitized. Some of these rocks have been folded and brecciated; others are cut by abundant quartz veins. Geochemically, the mafic metavolcanic rocks can be distinguished by low Zr/TiO2 ratios (< 0.028) and slightly elevated Cr concentrations (median 220 ppm). The mafic metavolcanic rocks are by far the most abundant meta-igneous rocks present at Juomasuo (Fig. 4).
The felsic metavolcanic rocks (Fig. 2h, q) are light gray, are fine to medium grained, and contain abundant sericite, albite, and quartz accompanied by subordinate biotite and chlorite. Crosscutting quartz veins are common. Carbonates are rare to nonexistent. These rocks are geochemically distinct based on high Zr/TiO2 ratios (> 0.08 with a median of 0.11) and low Cr concentrations (median 120 ppm). The unmineralized felsic rocks have relatively high Th concentrations (median 4.6 ppm) compared to unmineralized mafic and ultramafic meta-igneous rocks (medians 0.93 and 1.56 ppm, respectively). The felsic rocks are the second most abundant meta-igneous rock type at Juomasuo (Fig. 4).
The intermediate-composition metavolcanic rocks (Fig. 2f, p) share similar textural characteristics with the felsic metavolcanic rocks. The former type can be distinguished by lower Zr/TiO2 ratios (0.03–0.05). Unmineralized parts contain the highest Th concentrations among the unmineralized metavolcanic rocks (median 7.9 ppm). The intermediate-composition type is uncommon at Juomasuo (Fig. 4).
The least-albitized parts of the metasedimentary rock units (Fig. 2g, r) are generally gray. Proximal to the mineralized zones, they are composed of quartz, biotite, chlorite, sericite, and albite. Sheared and heavily tectonized fabrics are common. Preserved sedimentary features include layers, bands, and laminations that are locally preserved both outside the mineralized zones in heavily albitized parts (Fig. 2c) and within zones affected by subsequent alteration events (Fig. 2g). Some of these preserved features are only visible at a microscopic scale. The metasedimentary rocks have generally low Cr contents (median 140 ppm) with unmineralized parts in general having higher Th concentrations (median 9.0 ppm) compared to the metavolcanic rocks. The Zr/TiO2 ratios of the metasedimentary rocks vary (Fig. 3(A)) but are comparable to those of the intermediate-composition metavolcanic rocks (median 0.04 ppm). Metasedimentary rocks dominate the lithology at Juomasuo, being the most abundant rock type in the four studied drill cores (Fig. 4).
Lithologic controls on Au and Co grades
In order to evaluate the possible correlation between the types of host rocks and ore mineralization, data points on the Nb/Y–Zr/TiO2 discrimination diagram were classified according to the grade of Au and Co mineralization. Classes of grades closely correspond to the 99th, 95th, 90th, and 75th percentiles of the Au and Co concentrations in the studied drill cores. Accordingly, the classes for Au are as follows: > 15 ppm = very high grade, 7–15 ppm = high grade, 1–7 ppm = moderately high grade, 0.1–1 ppm = low grade, and < 0.1 ppm = weakly mineralized or unmineralized. For Co mineralization, the classes are as follows: > 5000 ppm = very high grade, 2000–5000 ppm = high grade, 1000–2000 ppm = moderately high grade, 500–1000 ppm = low grade, and < 500 ppm = weakly mineralized or unmineralized. This classification is used consistently in other parts of this study as well (see below).
The Nb/Y–Zr/TiO2 plots show that significant enrichment of both Au and Co occur in the mafic, intermediate-composition, and felsic metavolcanic rocks and in the metasedimentary rocks (Fig. 3(B–C)). Very-high-grade Au mineralization is present in all of these rock types, whereas very high grades of Co are mostly hosted by the mafic metavolcanic rocks (Fig. 3(B–C)). High-grade and moderately high-grade Co and Au grades are, however, present in almost all of the rock types, except for the ultramafic sill that lacks Au and Co enrichments. Thus, it can be concluded that there is no strict lithological control on the grades of Au and Co in the Juomasuo deposit.
Metal associations and ore mineralogy
The four studied Juomasuo drill cores include several intervals that are enriched in Au and Co. Examining the combined lithologic and geochemical profiles for these cores (Fig. 4; Online Resource 2) leads to several important observations. First, intervals that host significant Au or Co (Au > 1 ppm and Co > 1000 ppm) contain two types of ore: an Au–Co ore and a Co-only ore. Second, in places, these two ores occur in adjacent zones, whereas in others they are spatially separate. Intervals where Au is significantly enriched without at least moderate Co enrichment are virtually non-existent. It should be noted that in the Co-only ore there can be also some degree of Au enrichment, although Au concentrations remain < 1 ppm.
The two types of ore are locally accompanied by various degrees of enrichment of other metals, namely Cu and Mo (Online Resource 2). Copper is enriched in both Au–Co and Co-only ore zones. Contents of Cu in these zones mostly reach maxima of several hundred ppm, with rare parts exceeding 1000 ppm (maximum Cu content in Au–Co ore is 6000 ppm). Molybdenum is also enriched in the two types of ore. In most high-grade ore zones, Mo concentrations range from 10 to 200 ppm, with some parts reaching up to 3500 ppm. Enrichment of Ni is limited in the deposit. In most cases, Ni concentrations are very similar (50–200 ppm) both within and outside the ore zones. Rare exceptions with Ni contents reaching 1000 ppm almost exclusively occur in the unmineralized ultramafic sill, probably reflecting the original Ni concentrations in this sill.
The most common sulfide mineral in the Juomasuo deposit is pyrrhotite. It occurs in massive veins, semi-massive elongate patches concordant with foliation, or rarely as granular disseminations. Pyrrhotite is present throughout the mineralized zone (Fig. 2i–k) but is most abundant in chlorite-rich parts of the deposit. Pyrite is the second most common sulfide, forming mostly subhedral to euhedral grains of various sizes (0.2–1.5 mm). Typically, most of the pyrite is subhedral and occurs as either inclusions in pyrrhotite or as irregular, anhedral grains partially replaced by pyrrhotite; this type of pyrite is relatively inclusion-free, foliated, and characterizes the Co-only ore and parts of the Au–Co ore. In other parts of the Au–Co ore, however, pyrite is the predominant sulfide as subhedral to euhedral disseminated grains or grain aggregates (Fig. 2l–m); this type of pyrite is also foliated and typically contains abundant silicate inclusions. In these parts, pyrrhotite is typically minor or absent. The only recognized Cu mineral is chalcopyrite, which occurs as anhedral intergrowths with pyrrhotite, fracture-fillings in pyrite, or as rims on pyrite.
Cobaltite is the main Co mineral at Juomasuo and can be found in the Co-rich parts of the ore. It forms rounded or subhedral, fine-grained (mostly 0.2–0.5 mm, rarely up to 1 mm) inclusions in pyrrhotite and locally in pyrite (Fig. 5f). Cobaltpentlandite is the other common Co mineral and is present mainly as flame-like exsolutions (typically 0.1–0.3 mm) in pyrrhotite. Molybdenite, rutile, magnetite, native Au, tellurides (altaite, tellurobismuthite, and melonite), and local scheelite and uraninite are noteworthy accessories in the ore.
Molybdenite forms fine-grained (0.1–0.3 mm) flakes or grain aggregates intergrown with other sulfides or is embedded in silicates. Rutile is present throughout the deposit, including the mineralized zones, typically as very-fine-grained (< 0.2 mm) disseminations and with ilmenite lamellae. Magnetite is rare but locally forms euhedral disseminations (up to 0.5 mm) in chlorite-rich parts of the host rocks. In small areas (approximately 1–2 cm in diameter), fine-grained (0.2 mm) to coarse-grained (up to several mm) uraninite is also present, typically associated with fine-grained (< 0.2 mm) euhedral galena and hosting sulfide inclusions. Uraninite rims have been altered to secondary uranium minerals. Scheelite is also an accessory mineral in parts of the ore zone.
Microscopically visible gold grains occur as very small (< 0.1 mm) inclusions in pyrite, pyrrhotite, molybdenite, and silicate minerals, at grain boundaries between sulfides, and rarely in cracks within uraninite grains. Gold also occurs in close association with tellurides either as complex intergrowths or as nearby inclusions in the same mineral grains or along sulfide grain boundaries (Fig. 5h). The most common telluride mineral is altaite, which mainly forms composite grains intergrown with gold and other tellurides (Fig. 5i). Tellurobismuthite occurs as inclusions in pyrite and as irregular grains closely associated with altaite and gold (Fig. 5h). Melonite mainly forms complex aggregates with gold and other tellurides (Fig. 5i).
Geochemistry of hydrothermal alteration: mass-transfer calculations
In order to evaluate the gains and losses of elements in relation to enrichment of Au and Co, mass-transfer calculations (Gresens 1967; Grant 1986, 1993, 2005) were done on all recognized rock types, except the barren ultramafic sill. Although it is impossible to find unaltered rock samples at Juomasuo, we determined least-mineralized samples using criteria (see explanations in caption to Fig. 6) that distinguish rocks that are relatively unaffected by alteration processes directly associated with the Co and Au mineralization. The least-mineralized samples were compared to mineralized samples having only Co enrichment or Au–Co enrichment for each rock type. The calculations were done by considering Zr, Ti, and Nb as the least-mobile elements. Results of the mass-transfer calculations are shown in Fig. 6 and with an extended set of data for elements and oxides in Online Resource 3.

Graphical representation of results of mass-transfer calculations for mafic, intermediate-composition, and felsic metavolcanic rocks, and metasedimentary rocks from the Juomasuo deposit. Samples having S < 0.1 wt%, Au <0.01 ppm, and Co <170 ppm were classified as least mineralized. For the mafic metavolcanic rocks, a K2O content of < 2.1 wt% was an additional criterion for this selection. Mineralized samples were classified as having Co-only enrichment if Co content is > 500 ppm and Au < 0.1 ppm. Samples with both Co > 500 ppm and Au > 0.1 ppm were classified as having Au–Co enrichment. For each category, average values of element and oxide concentrations in the samples were calculated and used in the mass-transfer calculations. Vertical axis represents gain or loss of a component in the mineralized samples with Co-only enrichment (blue bar), and Au–Co enrichment (gray bar) relative to its concentration in the least mineralized samples (ΔCi/Co)
All rock types experienced noticeable gains in Fe and K that positively correlate with various metal enrichments in both types of mineralized samples. The K gains are significant in the felsic and intermediate-composition metavolcanic rocks and the metasedimentary rocks, and moderate in the mafic metavolcanic rocks (Fig. 6). The other major elements mostly display losses in both the Co and Au–Co mineralized samples. A significant loss of Na is evident in all mineralized rocks. The greatest loss in Na for most rock types can be seen in samples with Au–Co enrichment, except for the metasedimentary rocks where loss in Na is approximately equal in both types of mineralized samples (Fig. 6). In all rock types, there is significant loss in Ca and Mg in both types of mineralized samples, except for the felsic metavolcanic rocks having only Co enrichment in which a slight gain in Mg and significant gain in Ca exists. Silica displays low to moderate loss in all rock types; the most significant loss is in the intermediate composition and felsic metavolcanic rocks with Au–Co enrichment. As expected, Al is relatively immobile in all rock types compared to the other major elements. Some small gains and losses in Al in the different rock types could reflect changes in the alteration mineralogy of the mineralized zones or be within error of the analytical procedure.
In all rock types, there are significant gains in As, Au, Co, Mo, Cu, and S in the mineralized rocks (Fig. 6). Gains in Co correlate with gains in Fe, S, and As (Online Resource 3). Sulfidation played a prominent role in the mineralization process. Naturally, gains in Au in the Co-only mineralized samples are minimal compared to those in the Au–Co-enriched samples. Regardless of the type of host rock, the gain in As is larger in the Co-only mineralization, and together with the positive correlation in gains between Co and As (Online Resource 3) can be related to the presence of cobaltite and cobaltpentlandite in Co-rich parts of the deposit. In all lithologies, there is a distinct lack of significant gain or loss in Ni in the mineralized rocks, with only a marginal gain present in some cases, highlighting the overall Ni-poor character of the deposit.
Effects of hydrothermal alteration
The main alteration zones recognized in the studied rocks at Juomasuo consist mainly of albite, chlorite, biotite, and sericite, whereas talc, quartz, amphiboles, and carbonates are modally less important. For graphical representation of the different types of alteration, weight percent concentrations of major elements were recalculated to 100% volatile-free for each sample and were then converted to molar values for projection in a molar element ratio (MER) diagram (Warren et al. 2007; Benavides et al. 2008). It was found that the 3*K/(Al+Mg+Fe–S) vs. Al/(Al+Mg+Fe–S) diagram is the most effective in representing the main alteration minerals at Juomasuo and for visualizing the effects of albite, chlorite, biotite, and sericite alteration on the host lithology (Fig. 7). Sulfur was subtracted from the molar value of iron to eliminate the influence of pyrrhotite (Fe1−xS), which is the predominant sulfide mineral at Juomasuo.

Molar element ratio (MER) diagrams showing effects of addition of major alteration minerals to each recognized rock type at Juomasuo. Assigned MER for the two axes defines a unique point relative to fields for the major alteration minerals (albite, sericite, chlorite, biotite, and actinolite-talc). (A) MER diagram for different meta-igneous rock types. (B) MER diagram for metasedimentary rocks. (C) MER diagram for all Juomasuo rock samples categorized according to Au grades. (D) MER diagram for Juomasuo rock samples categorized according to Co grades. (E) MER diagram with four fields based on clustering of compositional data for barren and mineralized samples from Juomasuo; field 1: barren albitite field; field 2: transitional field; field 3: Co ore field; field 4: Au–Co ore field
All of the rock types, except the ultramafic sill, were affected by various degrees of albitization (Fig. 7(A–B)). Data for most samples plot on the MER diagram in an area with x < 0.4 and y > 0.5 representing albitites. Especially, part of the metasedimentary rocks was so intensely albitized that a cluster of samples plots next to the albite end member, representing intervals composed almost wholly of albite (Fig. 7(B)). Petrographic observations suggest that albitization was the first pre-mineralization alteration event at Juomasuo.
Mafic metavolcanic and metasedimentary rocks were affected significantly by alteration events subsequent to the albitization. Data for many samples plot in the lower part of the MER diagram (y < 0.5) that corresponds to a strong signature of chlorite-biotite alteration in the rocks (Fig. 7(A–B)). Furthermore, some data for the mafic metavolcanic and metasedimentary rocks trend towards the sericite end member, showing that significant sericitization affected these strata.
The felsic and intermediate-composition metavolcanic rocks also record subsequent alteration events, albeit on a more limited degree compared to the mafic metavolcanic and metasedimentary rocks due to significantly fewer data points. Nevertheless, some of the samples plot in the lower part of the diagram, indicating the effect of chlorite-biotite alteration, whereas other samples plot in a line trending towards the sericite end member thus highlighting the significant effect of sericitization in these rocks (Fig. 7(A)).
Data for the samples of the ultramafic sill show a different distribution compared to the other rock types by plotting relatively close to the origin of the axes (Fig. 7(A)). This pattern reflects the mineralogy of the rock, which comprises mainly talc-carbonates-biotite-chlorite assemblages. The ultramafic sill was not albitized, indicating possible emplacement after the regional albitization event. In addition, the ultramafic sill distinctly lacks any signs of sericitization.
Relationships between hydrothermal alteration and mineralization
All rock intervals from the four studied drill cores with available lithogeochemical data were classified according to grades of Au and Co and plotted in the MER diagram (Fig. 7(C–D)) and together with petrographic observations were used to study the relationship between hydrothermal alteration and mineralization.
Data for most barren samples plot between the albite and chlorite end members, whereas those for most of the mineralized samples are distributed between the chlorite and sericite end members (Fig. 7(C–D)). In agreement with petrographic observations, the MER diagrams (Fig. 7(C–D)) also suggest that the pre-mineralization alteration that produced the albitized rocks was followed by chlorite (± biotite) and sericite alteration, and that both of these alteration types are related to ore formation.
A significant proportion of the Co-rich intervals have data that plot in the lower portion of the MER diagram in an area associated with chlorite-biotite-amphibole alteration. Most Co-rich samples in this part of the diagram are part of the Co-only ore as they are not significantly enriched in Au in addition to Co. Additionally, distribution of samples having the highest Co grades, shown in the lower part of the diagram, suggest that the Co mineralization related to chlorite (± biotite ± amphibole) alteration produced the highest Co grades in the deposit. The Co-only ore comprises mainly massive to patchy pyrrhotite and some euhedral to subhedral pyrite that is closely associated with the pyrrhotite. Cobaltite is commonly present as fine-grained inclusions in pyrrhotite and rarely as disseminations or inclusions in pyrite. Additionally, pyrrhotite contains abundant, fine-grained, flame-like exsolutions of cobaltpentlandite.
Some of the Co-rich samples that plot in the lower part of the MER diagram are also considerably enriched in Au (Fig. 7(C–D)). These samples constitute the first type of Au–Co ore. This type is similar to the Co-only ore regarding mineral associations, with chlorite (± biotite) alteration being the definitive type connected to the mineralization. Pyrrhotite is the main sulfide, accompanied by lesser pyrite and cobaltite, with cobaltpentlandite inclusions similarly present in pyrrhotite. This version of the Au–Co ore possibly was deposited during the waning stages of the same chlorite-rich alteration event that led to deposition of the Co-only ore. The second and most widespread association of the Au–Co ore is with the sericite alteration. Petrographic observations suggest that this alteration is later than the chlorite (± biotite) alteration, as sericite commonly overprints all other silicates (Fig. 5b–c). The superimposition of sericite and its connection to the Au–Co mineralization can be also observed in the MER diagram (Fig. 7(C–D)). The highest Au grades and a significant part of the high Co grades are on a line starting from the area associated with chlorite-biotite alteration, approximately in the middle of the plot (x = 0.5, y = 0.5), trending towards the sericite end member (Fig. 7(C–D)). Pyrite is typically the predominant sulfide in this version of the Au–Co mineralization, forming 0.2- to 1.0-mm grains and grain aggregates. In the sericite-dominant zones, cobaltite is rare and pyrrhotite hosts fewer cobaltpentlandite inclusions compared to the other ore types. Sericite-related Au–Co ore generally hosts the highest Au grades (up to 54 ppm).
Principal component analysis
To further examine the geochemical characteristics of the mineralization, principal component analysis (PCA) was performed on the whole-rock geochemical data. The variables chosen were As, Au, Co, Mo, U, and S for elements that are enriched in the mineralized parts of the deposit, and SiO2, Al2O3, Fe2O3, MgO, Na2O, and K2O for the principal major elements affected by the alteration. Correlation coefficients of the variables for the three first principal components are shown in Online Resource 4. Three principal components are examined as they cumulatively represent 77% of the variability in the data. The first principal component (PC1) is characterized by a high negative degree of correlation with As–Au–Co–S that reflects the mineralized zones, and by a high positive degree of correlation with SiO2–Al2O3–MgO–Na2O that reflects the altered rocks. The second principal component (PC2) has a high positive correlation with Au (0.73) and less so with U (0.46), a result that may indicate some degree of association between Au and U. It is also notable that Au is not correlated with Co (correlation values of 0.73 and − 0.27 respectively with PC2). The third principal component (PC3) shows a moderate negative degree of correlation with Mo (− 0.59) and As (− 0.52), reflecting the association of molybdenite with As-bearing mineral phases. The results can be best interpreted by examining the PC1-PC2 correlation circle (Fig. 8(A)) together with the PC1-PC2 observations diagram (Fig. 8(B)). In the correlation circle, Co is closely related to S and has some degree of correlation with As, corresponding to the mineralogy of Co in the deposit. This set of elements is negatively correlated with Al2O3–SiO2–Na2O and MgO. Cobalt and Au are independent in PC1-PC2 space, as their vectors are nearly perpendicular.

Graphical outputs of PCA based on Juomasuo whole-rock database using the following variables: As, Au, Co, Mo, S, U, K2O, Na2O, Al2O3, MgO, Fe2O3, SiO2. (A) Correlation circle showing vectors for each variable in PC1-PC2 space. (B) Observation plot showing position of analytical points (corresponding to each analyzed rock sample) in PC1-PC2 space. Unmineralized samples have S < 0.1 wt%, Au < 0.01 ppm, and Co < 170 ppm. Altered and weakly enriched samples have S > 0.1 wt%, Au < 0.1 ppm, and Co < 500 ppm. Samples with Co-only enrichment have Co > 500 ppm and Au < 0.1 ppm. Samples with Au–Co enrichment have Co > 500 ppm and Au > 0.1 ppm. The percentage of the dataset variability expressed by the principal components is shown in brackets
The geochemical data used for PCA were also classified according to degree and type of mineralization (unmineralized samples, altered and weakly enriched samples, Au–Co-enriched samples, and Co-only-enriched samples; for explanations, see caption of Fig. 8) and plotted on the observations diagram in PC1-PC2 space (Fig. 8(B)). Data for the different categories cluster in different parts of the diagram, with the unmineralized rocks defining a separate field. Towards the left part of the diagram, samples become progressively altered and weakly enriched, and finally strongly mineralized. An interesting observation is that data for the two types of ore at Juomasuo plot in two distinct parts of the diagram, apart from some overlap among Au–Co- and Co–only-enriched samples.
Sulfide trace elements
The majority of sulfides chosen for trace element analysis by LA-ICP-MS are from mineralized parts of the deposit and include both the Au–Co ore and Co-only ore types (see sample localities in Fig. 4). A few pyrite and pyrrhotite samples were selected from low-grade mineralized zones for comparison. Measurements were performed for 37 elements (Al, Si, S, Sc, Ti, V, Cr, Mn, Fe, Co, Ni, Zn, Ga, Ge, As, Se, Nb, Mo, Ru, Rh, Pd, Ag, Cd, In, Sn, Sb, Te, Ba, W, Pt, Au, Hg, Tl, Pb, Bi, Th, U). A summary of the results of the trace element analyses is shown in Online Resource 5. Scatterplots are used to study the distribution and relationship of elements in different types of pyrite (Fig. 9(A–I)). Cobalt lacks any strong correlation with Ni or Au (R2 = 0.004 and 0.027, respectively); variations in the Co content of pyrite are not dependent on Au or Ni contents (Fig. 10(A, C)). Cobalt has some correlation with As (R2 = 0.52) in pyrite, for which As shows high concentrations (As > 103 ppm; Fig. 9(B)). The Co–Ni diagram (Fig. 9(A)) shows two very distinct clusters of data points, which represent very different Co/Ni ratios. All analyzed pyrite from the Co-only mineralized zones and some from the Au–Co mineralized zones have very high Co/Ni ratios, mostly between 103 and 3 × 10⁴. This cluster has high contents of Co (up to 2.2 wt%) and very low Ni (mostly 0.5–10 ppm). The other cluster mainly comprises data for pyrite only from the Au–Co mineralized zones and includes pyrite with similar to slightly lower Co contents but significantly higher Ni contents (up to 1030 ppm), with lower Co/Ni ratios between 1 and 100. No correlation exists between Au and As (R2 = 0.002), as high Au concentrations occur both in low-As and high-As samples (Fig. 9(D)). There is, however, a positive correlation of Au with Te, Bi, and Sb (R2 = 0.54, 0.36, and 0.55, respectively; Fig. 9(E–G)).

(A–I) Trace element and sulfur isotope binary plots for selected trace element pairs from Juomasuo pyrite; data is discriminated according to the relationship of the analyzed pyrite to the two recognized ore zones. (J) Trace element boxplots with logarithmic scale for pyrite from Juomasuo ore zones with high Co/Ni ratio (n = 47) and low Co/Ni ratio (n = 28); (K) trace element boxplots with logarithmic scale for pyrrhotite (n = 40) and chalcopyrite (n = 6)

Histogram showing distribution of δ34S values for analyzed pyrite, pyrrhotite, and chalcopyrite from Juomasuo
Distribution of the Se/S ratio is also different between the two distinct pyrite groups (Fig. 9(I)). The high Co/Ni group has a relatively narrow range in Se/S with a mean value of 1 × 10⁻³. The low Co/Ni group, in contrast, displays a wide range with just over half of the data being similar to the ratios of the high Co/Ni ratio group, with the remaining samples having higher values (mean Se/S ratio of this group overall is 1.7 × 10⁻³). In addition, concentrations of other elements also vary systematically in the two groups. Pyrite from the low Co/Ni group has significantly higher Ni contents and also higher As, Se, Sb, V, Te, and W contents relative to pyrite from the high Co/Ni group (Fig. 9(J)).
Statistical representation of trace element contents of pyrrhotite and chalcopyrite from Juomasuo are shown in Fig. 9(K). Pyrrhotite has Co contents of mostly ~ 0.2 wt% (median 0.22 wt%) with a total range of 6 ppm to 0.7 wt%. Chalcopyrite Co contents are significantly lower, from 4 to 70 ppm. The Ni content of pyrrhotite displays a wide range from 1.4 to 800 ppm (median 170 ppm). Pyrrhotite has significantly lower As (median 0.45 ppm) compared to pyrite (median 0.15 wt% for the high Co/Ni ratio pyrite, 0.37 wt% for the low Co/Ni ratio pyrite). Other analyzed trace elements in pyrrhotite have comparable values to those in pyrite. Chalcopyrite in contrast is more enriched in Pb, Zn, and Sn relative to pyrite and pyrrhotite.
Sulfur isotopes
The total range of δ34S values for the analyzed sulfides is − 2.6 to + 7.1‰ with most values between + 2 and + 5‰. A few of the pyrite and pyrrhotite grains have negative or near-zero values of − 2.6 to + 0.9‰; several others are between + 1 and + 2‰. All of the analyzed chalcopyrite has positive δ34S values of + 2 to + 6‰ (Fig. 10). In samples for which both trace elements and sulfur isotopic compositions were measured, analysis spots for the two procedures were placed next to each other (< 30-μm separation). The analyzed pyrite grains were checked for internal zoning via SEM. Where such zoning was recognized, analytical spots for the two procedures were placed to reflect the same zone. In this way, we attempt to best evaluate correlations between the sulfur isotope composition and trace element characteristics of the analyzed pyrite grains. Pyrite with high Co/Ni ratios has a heavier δ34S signature with values ranging between + 1.2 and + 6.8‰ (Fig. 9(H)) and a mean of + 3.8‰. Pyrite from the low Co/Ni ratio group has generally lower δ34S values (− 2.6 to + 4.7‰; mean + 2.4‰), including all negative values obtained from analyzed pyrite (Fig. 9(H)).
Tourmaline crystal chemistry
In this study, tourmaline grains from four samples were analyzed. All four samples represent albitites of metasedimentary origin with varying degrees of subsequent alteration. Four types of tourmaline, each from a different sample, were recognized. Photographs of the selected samples can be seen in Online Resource 6; drill core localities are shown in Fig. 4. Type 1 tourmaline is disseminated in the matrix of a barren albitite with very little subsequent alteration that lacks sulfides. Type 2 tourmaline is associated with pyrite and sericite, and is from a pink massive albitite that has undergone sericitization, even though it is not enriched in Au or Co. Type 3 tourmaline is associated with pyrite and is from an albitite without Au or Co enrichment that has been subjected to post-albite silicification, carbonatization, and sulfidation with additional sericite and biotite present in the matrix. Type 4 tourmaline, from a mineralized sample, is disseminated in the matrix of a sulfidized albitite enriched in Au (4.42 ppm) and Co (608 ppm). Tourmaline in this sample is closely associated with biotite and sericite.
Results of EPMA analyses of tourmaline are presented in Online Resource 6. Based on calculated crystal-chemical compositions, most of the tourmaline is classified as dravite apart from a subgroup of type 1 tourmaline cores (type 1b) that consists of schorl (Fig. 11(A)). Type 1 tourmaline has highly variable Al contents (4.9–6.7 apfu) with an average of 6.0 apfu. The X-site is dominated by Na (0.4–1.0 apfu), Ca (0–0.2 apfu), and X-site vacancies (0–0.56 apfu). Cores of type 1b tourmaline show consistent Al contents of > 6.0 apfu and Na contents of < 0.8 apfu. Type 2 tourmaline has Al contents between 5.0 and 6.2 apfu with an average of 5.4 apfu; the X-site is dominated by Na (0.6–1.0 apfu), Ca (0–0.3 apfu), and X-site vacancies (0–0.3 apfu). Type 3 tourmaline has Al contents between 4.2 and 6.0 with an average of 5.4 apfu, and X-site dominated by Na (0.5–1.1 apfu), Ca (0–0.5 apfu), and X-site vacancies (0–0.1 apfu). Type 4 tourmaline has Al contents between 4.0 and 6.2 with an average of 5.4 apfu; the X-site is dominated by Na, with an average of 0.9 apfu and a maximum of 1.0 apfu.

(A) Classification of tourmaline types based on Fe/(Fe+Mg) vs. Na/(Na+Ca) plots. Modified after Jiang et al. (2002); (B–D) ternary and binary plots of tourmaline compositions. (B) Al–Fe–Mg ternary plot after Henry and Guidotti (1985). Key to numbered fields: 1, Li-rich granitoid pegmatites and aplites; 2, Li-poor granitoids and associated pegmatites and aplites; 3, Fe3+-rich quartz-tourmaline rocks; 4, metapelites and psammites coexisting with Al-saturating phases; 5, metapelites and psammites not coexisting with Al-saturating phases; 6, Fe3+-rich quartz-tourmaline rocks, calc-silicate rocks, and metapelites; 7, low-Ca meta-ultramafic rocks and Cr, V-rich sediments; 8, metacarbonates and metapyroxenites. (C) Al-X-site vacancy + Ca vs. R + X-site vacancy-Ca +Ti binary for tourmaline (after Henry et al. 2008). (D) Al vs. X-vacancy binary for tourmaline with exchange vectors shown for different crystallographic substitutions
Compositions of most tourmaline types show distinct trends on ternary and binary diagrams (Fig. 11). In the AFM ternary diagram (Henry and Guidotti 1985), data for most type 1, 2, 3, and 4 tourmalines plot in fields 5 and 6 (see Fig. 11(B) for explanation); type 1b tourmaline defines a compositionally isolated group in field 2 (Fig. 11(B)). Compositions plotting in fields 5 and 6 show an oxydravite-povondraite (O-P) trend for tourmaline types 1 and 4 and for parts of types 2 and 3. In addition, an inverse correlation exists between Fetot and Al, suggesting Al substitution by Fe3+. The tourmaline compositions that plot on the O-P trend in the AFM diagram show Al-X-site vacancy+Ca values along the O-P trend (Fig. 11(C)); deviation from the O-P trend implies that in addition to Fe3+Al−1, there is influence of other exchange vectors, mainly (Xvac,Al)(Na,Mg) (Fig. 11(D)).
Tourmaline boron isotopes
The in situ δ11B ‰ values for different types of tourmaline can be seen in Fig. 12 and in more detail via Online Resource 6. In all samples, δ11B analyses were acquired on tourmaline cores and rims where a clear distinction was evident based on optical zoning. In most cases, the rims are characterized by higher δ11B values, as much as 10‰. However, this result was not found in type 4 tourmaline, for which the only analyzed core has a slightly higher δ11B value than the rim. Most of the δ11B values fall in a continuous field ranging from − 5 to + 6‰. Importantly, there is a second population of data with significantly lower δ11B ‰ values between − 18 and − 11‰. This isotopically lower population comprises one core from type 3 tourmaline and all data obtained for type 1b tourmaline.

Histogram of δ11B values for analyzed Juomasuo tourmaline and comparison with values of different global boron isotope reservoirs. Reservoirs modified after Trumbull et al. (2020)
Discussion
Constraints on multiple mineralization processes from lithogeochemistry and mineralogy
Results of our mineralogical and lithogeochemical studies at Juomasuo document three different major alteration events. The earliest event was widespread albitization that affected all rock types and increased their competency. During this stage, albite replaced most original minerals in the rocks. In metasedimentary rocks, quartz was the only mineral that was locally preserved; in parts with a greater intensity of albitization, even the sedimentary quartz was completely replaced by albite. Intensity and timing of the albitization are also reflected in mass-transfer calculations (Fig. 6). For all studied rock types, the Na content decreases in the “mineralized” and “strongly mineralized” intervals, suggesting that the “least altered” rocks were affected by the early albitization even if lacking signs of other alteration assemblages. Observations about losses of Na agree with our petrographic observations and thus we conclude that albitization was an event that affected all rock types at Juomasuo (except for the ultramafic sill) and preceded the alteration stages related to ore deposition. This conclusion is further supported by trends in MER diagrams, where the degree of albitization is inversely correlated with grades of Au and Co (Fig. 7). The first alteration event directly associated with the Au–Co mineralization was characterized by chlorite (± biotite ± amphibole) with accompanying pyrrhotite-dominated sulfide assemblages. This stage of alteration was closely connected to Co mineralization, based on data that show the highest Co grades plot close to the compositions of these minerals (Fig. 7(D)). This alteration stage also has a link to the Au mineralization, with some Au enrichment present in chlorite-dominant samples. It is possible, however, that this pattern reflects an overprint of later Au-rich fluids only on parts of the Co-only mineralization. On the other hand, the later sericite alteration was accompanied by significant Au mineralization and by notable Co mineralization (Fig. 7).
Some specific compositional fields exist within which most of the mineralized samples plot in a MER diagram (Fig. 7(C, D)). Specific fields are shown in order to highlight the vectors from barren to mineralized samples (Fig. 7(E)). Samples that plot near the albite end member (field 1), mostly barren samples that are strongly albitized, were affected to a limited degree by subsequent alteration events. In the lower parts of the field, a few samples enriched in Au or Co are present. Field 2 is a transitional field that includes some Co-rich and a few Au-rich samples but is still dominated by barren samples. Field 3 contains samples affected by chlorite (± biotite ± amphibole) alteration and comprises numerous Co-rich samples, including those with the highest Co grades in the deposit. Some of these Co-rich samples are also enriched in Au. Finally, field 4 hosts most of the samples enriched in both Au and Co, with most of the significant Au grades (> 1 ppm) plotting in this area; Co grades are generally lower in comparison to field 3. The MER diagram showing the four defined fields could be used as a vectoring tool in exploring for deposits with similar mineralogical and geochemical characteristics to those recognized in the Kuusamo belt.
An interesting observation from the PCA of the whole-rock database is that vectors for Au and Co in the PC1-PC2 correlation circle are perpendicular and thus show no degree of correlation (Fig. 8(A)). By plotting data for all samples in PC1-PC2 space, distinct vectors emerge (Fig. 8(B)). Data for the barren samples plot in a compact field, distinct from weakly enriched and mineralized samples. Data for Co-only-enriched samples plot in a separate part of the diagram from those having Au–Co enrichment, regardless of spatial association. This distinction concerning Au and Co in the two PCA diagrams suggests that the Au–Co enrichment was generated by a different mineralizing process than the Co-only enrichment.
Pyrite geochemistry
Based on in situ LA-ICP-MS trace element data for Juomasuo pyrite, Au is positively correlated with Bi, Sb, and Te (Fig. 9). The co-enrichment of Au with Bi is expected as they display similar geochemical behavior and precipitation mechanisms (e.g., Grundler et al. 2013). Antimony has similar properties with As and it has been suggested that, like As, Sb can control the uptake of trace metals in pyrite (George et al. 2018), which may explain the positive correlation between Au and Sb.
Cobalt and Ni can be involved in isovalent substitutions with Fe2+ in pyrite, and Se and As may serve as anions and partially replace S in the pyrite lattice (e.g., George et al. 2018). With the exception of a few cases in the literature (e.g., Pitcairn et al. 2010; Gadd et al. 2016), these four elements that form limited solid solution series with pyrite are generally not released from pyrite even during later recrystallization events (Large et al. 2009). Therefore, their distribution in pyrite may provide insights into the nature of the pyrite-precipitating fluid (e.g., Zhao et al. 2011).
The pyrite population with high Co/Ni ratios (Fig. 9) includes all data from the Co-only ore and some for pyrite from the Au–Co ore. In both cases, pyrite is closely associated with chlorite and to some extent biotite. This type of pyrite is typically foliated, subhedral, and relatively inclusion-free and is closely associated with pyrrhotite. It seems that all of the pyrite from this population was deposited during chlorite-biotite alteration that marks the first major mineralizing event (stage 1) at Juomasuo. The high Co/Ni ratios of the pyrite linked to chlorite- and biotite-rich alteration assemblages, together with very low Ni contents, and relatively homogeneous Se/S ratios and δ34S values, suggest that the stage 1 pyrite precipitated from a homogeneous hydrothermal fluid. This stage 1 pyrite is characteristic of the earlier Co-rich mineralization event. The presence of a pyrrhotite-pyrite assemblage indicates that the fluids were relatively reduced during this stage (Eilu 1994; Thompson et al. 1996).
The solubility of Co displays a stronger sensitivity to salinity than Ni, which is one of the main reasons why Co is more easily mobilized by hydrothermal fluids (Brugger et al. 2016). This pattern is due mainly to the coordination chemistry of these elements, with Ni requiring higher temperature and higher salinity in order to transition from octahedral to tetrahedral aqueous complexes (Brugger et al. 2016). Tetrahedral complexes show a higher affinity for chloride ligands and are thus more easily mobilized. Liu et al. (2012) showed that in a 2-m NaCl solution, the solubility of cobaltpentlandite is at least 100 times higher than that of pentlandite, highlighting the large contrast in the mobility of Co and Ni in hydrothermal fluids. In addition, the whole-rock geochemical profiles for the four studied drill cores (Online Resource 2) show that the significant enrichment of Co in the Juomasuo deposit does not correlate with any appreciable enrichment in Ni, compared to areas outside the ore zones. The only exception is the ultramafic sill, which as expected has elevated Ni contents. The relatively low contents of Ni on a deposit scale argue against an ultramafic rock source for Co in the Juomasuo ores.
Pyrite grains having relatively low Co/Ni ratios (Fig. 9) are limited to the Au–Co ore zones and are closely associated with sericitization. This pyrite population typically occurs as subhedral to euhedral disseminated grains or grain aggregates, is foliated, and contains silicate inclusions. Because the sericitization event is later than the chlorite-biotite alteration, this type of pyrite together with the presence of the sericite-altered rocks mark the second major stage of mineralization at Juomasuo. The shift of sulfur isotope values of sulfides towards negative values is widely attributed to the presence of abundant oxidized sulfur species in the ore-forming fluids (Ohmoto 1972; Cameron and Hattori 1987; Hodkiewicz et al. 2009) but it may also reflect a different source of sulfur (e.g., Hodkiewicz et al. 2009; Molnár et al. 2016). The lower δ34S values of this stage 2 pyrite (mean + 2.4‰), including some values as low as − 2.6‰, suggest that more oxidizing conditions existed during this mineralizing stage. The more oxidized character of stage 2 mineralization is also recorded by sulfide mineral assemblages. Whereas stage 1 is dominated by pyrrhotite, stage 2 is characterized by abundant pyrite with only minor pyrrhotite. Stage 2 pyrite has a relatively wide range of Se/S ratios with some being similar to those of stage 1 pyrite and some having considerably higher ratios. The median Se/S ratio for stage 2 pyrite (1.6 × 10⁻³) is thus significantly higher compared to stage 1 pyrite (8 × 10⁻⁴). Because different sulfur reservoirs, like magmatic fluids and seawater, have distinct isotope and Se/S ratios (Huston et al. 1995; Seal 2006), the data for those in the two Juomasuo pyrite types thus supports the involvement of two different fluids in the mineralization.
Stage 2 pyrite is significantly enriched in Ni, Se, Te, Sb, and W and slightly enriched in Bi relative to stage 1 pyrite (Fig. 8). It is also slightly depleted in Co compared to stage 1 pyrite. The enrichment of redox-sensitive elements such as Ni and Te in stage 2 pyrite may further support the premise that a more oxidized fluid was responsible for deposition of this pyrite (cf. Brugger et al. 2016). As discussed above, Co is much easier to mobilize by hydrothermal fluids than is Ni. If we consider the same source of fluids and metals for the more Ni-rich stage 2 pyrite, the salinity and temperature of the fluid would have needed to rise significantly for mobilization and deposition of Ni, which has contents up to four orders of magnitude greater than those of stage 1 pyrite. In this case, the more easily mobilized Co is expected to also significantly increase compared to stage 1 pyrite. That is not the case, however, as stage 2 pyrite has slightly lower Co contents relative to stage 1 pyrite (Fig. 9).
Sulfur isotope values close to 0‰ (0 ± 3) are believed to be typical for magmatic sulfur (e.g., Ohmoto 1986). That is not always the case, however, since near-zero δ34S values can also reflect the sulfur isotope composition of the host rocks (Craw et al. 1995). Nevertheless, at Juomasuo, pyrite related to sericitization (stage 2) shows Ni enrichment, together with a wide range of Se/S ratios, significant decreases in Co/Ni ratios and δ34S values, and enrichment of redox-sensitive elements; these characteristics indicate a relatively oxidized fluid incursion, during stage 2 mineralization. The overlap in δ34S values and Se/S ratios between stage 1 pyrite and part of stage 2 pyrite (Fig. 8) could indicate some degree of mixing of the oxidized stage 2 fluid with the more reduced fluid of stage 1.
Indications for involvement of evaporitic fluids
The wide range in the isotopic fractionation of boron in different geological environments makes it possible to constrain the source of boron in hydrothermal systems on the basis of boron isotope data for tourmaline (Marschall and Jiang 2011; Trumbull et al. 2020). Tourmaline also exhibits a very high degree of stability after crystallization. This refractory nature of tourmaline under diverse geological conditions favors its use in evaluating the local chemical environment during tourmaline formation (van Hinsberg et al. 2011; Molnár et al. 2016; Ranta et al. 2017; Dutrow and Henry 2018).
For all studied Juomasuo tourmaline, type 1b is chemically distinct and only comprises some cores from type 1. It has relatively low Na contents (median 0.7 apfu), low Mg contents (median 0.72 apfu), and high Al contents (median 6.6 apfu), and lacks evidence of Al substitution by Fe3+. These characteristics are typical of tourmaline that precipitated from reduced, low-salinity fluids (cf. van Hinsberg et al. 2011; Hazarika et al. 2015). The remaining tourmaline types show either direct or indirect evidence of Al substitution in the Z-site by Fe3+ (Fig. 11), thus implying moderate to high Fe3+/Fe2+ ratios. In addition, the tourmaline data record influence of the (Xvac,Al)(Na,Mg) exchange vector. All tourmaline compositions, excluding type 1b, display relatively high Na (median 0.88 apfu) and Mg (median 2.16 apfu) contents and relatively low Al contents (median 5.76 apfu). These results suggest that these tourmalines precipitated from saline, oxidized fluids (e.g., Henry et al. 2008; Hazarika et al. 2015). Typically, such features are characteristic of metaevaporite settings, resulting in the formation of tourmaline rich in Na and Mg, moderately to highly depleted in Al, and enriched in wO2− and Fe3+ (Henry et al. 2008). If tourmaline shows enrichment in Fe3+, its composition generally follows a trend between oxydravite and povondraite, easily seen on an AFM diagram (e.g., Henry et al. 2008; Hazarika et al. 2015). In our study, compositions of most of the tourmaline, except for type 1b, agree with many of those characteristics. Especially, the O-P trend is present in the majority of cases, excluding partly type 2 tourmaline (Fig. 11(B)). This O-P trend is locally slightly displaced, owing to the influence of other exchange vectors such as (Xvac,Al)(Na,Mg) (Fig. 11(D)). Even in type 2 tourmaline, the influence of the Fe3+Al−1 exchange vector (in the Z site) can be inferred by other parameters such as low Al (< 6.0 apfu) and high Fetot+Mg contents (> 3.0 apfu). Type 1 tourmaline is linked to the early albitization event, and displays the clearest O-P trend (Fig. 11(B)) and the most influence of the Fe3+Al−1 exchange vector in an Al-Xvacancy+Ca vs. R+Xvacancy-Ca+Ti diagram (Fig. 11(C)). It is thus suggested that saline, oxidized fluids typical of metaevaporitic environments (e.g., Henry et al. 2008) were responsible for the pre-mineralization albitization in the area of the Juomasuo Au–Co deposit.
Boron isotope values of the analyzed tourmalines fall into two separate groups (Fig. 12). Type 1b tourmaline has δ11B values of − 16 to − 11‰. Results for one tourmaline core from a sulfidized albitite (type 3 tourmaline) also fall in this range. Remaining tourmalines have significantly higher δ11B values between − 5 and + 7‰. Data for type 1b tourmaline that mostly represent the lower δ11B values plot in field 2 in the AFM diagram (Fig. 11(B)) and could thus represent remnants of tourmaline that precipitated before albitization of the parent rock. The heavier δ11B values are mostly from albitites that have experienced subsequent alteration linked to the Co–Au mineralizing stages. The δ11B values are within the range of non-marine evaporites and clastic metasediments in terms of global boron reservoirs (Fig. 12) with either of them being a possible source for the boron in the tourmalines. However, by taking into consideration the chemical composition of the tourmalines, we suggest that the higher δ11B values could represent the mixing of evaporitic fluids with metasediment-derived fluids (stage 1) and with a more oxidized fluid (stage 2), while still partly preserving the evaporitic signature in the δ11B values of the tourmalines. This model could also explain the deviation of some of the data for tourmaline types 2, 3, and 4 from the O-P trend (Fig. 11(B)) while still showing evidence for the involvement of an evaporitic fluid.
Even though unambiguous proof for the presence of evaporites has not yet been found in the stratigraphy of the KB, there are several indications of their presence. Such indications include an abundance of meta-dolostone beds in close association with albitized metasedimentary rocks, occurrence of stromatolites within these dolostone beds, and the presence of scapolite in parts of the KB (Vanhanen 2001). Previous researchers have argued that fluids interacting with evaporites were responsible for the extensive albitization found in the KB, including at Juomasuo (Vanhanen 2001). A high-salinity hydrothermal fluid derived from the devolatilization of a metasediment-dominated, volcano-sedimentary sequence that included evaporites and mafic volcanic rocks (Petäjävaara Formation; Fig. 1) could thus explain the characteristics of stage 1 mineralization. In our model, Co contents in the hydrothermal fluid were high during this stage and cobaltite was deposited first. Afterwards, pyrrhotite with cobaltpentlandite exsolutions and Co-rich pyrite were deposited.
Implications for the ore deposit model
A summary of different proposed hydrothermal processes related to the origin of the Juomasuo Au–Co deposit can be seen in Table 1. The first process was widespread albitization. High-salinity fluids probably derived from evaporitic units yielded pervasive alteration of the metamorphosed volcano-sedimentary host rocks. During this stage, minor sericite alteration took place followed by carbonatization. The first stage of mineralization was caused by highly saline, reduced hydrothermal fluids probably of metasedimentary origin that leached metals from the mafic metavolcanic rocks of the Petäjävaara Formation surrounding Juomasuo. This Co-rich mineralization stage started with pervasive chlorite alteration and the deposition of cobaltite together with abundant pyrrhotite. As the mineralization progressed, chlorite was deposited together with biotite and stage 1 pyrite having a high Co/Ni ratio. During this stage, the mineralizing fluid was probably also enriched in Au, which was deposited locally in the Co-rich zones. With decreasing temperature, cobaltpentlandite exsolutions formed in pyrrhotite. The second mineralization stage was caused by a relatively oxidized fluid and is characterized by deposition of Au–Co ore richer in Au and poorer in Co relative to the first stage. This model agrees with the observations of Vanhanen (2001) who stated that Au deposition began along with the early sulfides and continued until the late stages of sulfide deposition. Another possibility is that the Au–Co ore was at least partially formed by overprinting of stage 2 Au-rich mineralization on older Co ore, a model that would agree with the observations of Witt et al. (2020). Whichever of these models is correct, it is clear that the first mineralizing event was especially rich in Co, whereas the second deposited most of the Au. Widespread sericitization characterized the second mineralizing stage dominated by stage 2 pyrite having much lower Co/Ni ratios compared to stage 1 pyrite. Molybdenite and tellurides were also deposited in this stage and in some cases are closely associated with Au deposition.
The general temporal relationships of the early Co-rich and later Au-rich mineralizing events established in our study agree with the recent observations of Witt et al. (2020). However, these authors argue that the highest grades of Co formed by the remobilization of Co from pyrrhotite, in places where sericite replaced chlorite, and suggest a late timing for the deposition of cobaltite in the deposit. In our study, we found several cobaltite-bearing samples from Co-only mineralized zones with no sign of a later overprint of chlorite by sericite. In these samples, cobaltite occurs mostly as inclusions in pyrrhotite; our observations thus agree with Vanhanen (2001), who proposed that cobaltite was the first sulfide to crystallize during stage 1 mineralization. It is therefore possible that there are two generations of cobaltite in the Juomasuo deposit, with the first having crystallized during the early parts of stage 1 mineralization and the second being a late phase related to mobilization of Co from pyrrhotite by the overprint of late Au-rich fluids.
Slack (2013) compiled a list of Co–Cu–Au deposits from different terranes that share similar geological, mineralogical and geochemical features; Juomasuo was included in that list and the deposits were collectively termed as Co–Cu–Au deposits in metasedimentary rocks. Many of these deposits, similarly to Juomasuo, are characterized by distinct multi-stage mineralizing processes (e.g., deposits of the Idaho cobalt belt, USA; Bookstrom et al. 2016; Saintilan et al. 2017) and by widespread albitization (e.g., Modum district; Munz et al. 1994). Slack (2013) suggested that these Co–Cu–Au deposits could have a potential genetic affiliation with IOCG deposits. Some workers have indeed suggested an IOCG classification for some of these deposits (e.g., Goad et al. 2000; Slack 2012). On the other hand, Slack (2013) acknowledged that features such as the structural control commonly seen on these Co–Cu–Au deposits together with stable isotope data could indicate that these deposits formed by similar metamorphogenic processes as classic orogenic Au deposits, despite geochemical and mineralogical differences. Juomasuo was classified as an IOCG deposit by Vanhanen (2001), whereas Witt et al. (2020) invoked the involvement of an orogenic Au fluid in formation of the deposit.
Mineral deposits having similar characteristics are not uncommon in the Paleoproterozoic greenstone belts in northern Finland. There are several deposits in the KB, the CLGB (e.g., Sirkka, Levijärvi-Loukinen), and the PB (Rompas-Rajapalot project) that display similar metal associations and geochemical and mineralogical characteristics, and occur in greenstone belts with complex but comparable geotectonic histories. Several authors have classified some of these deposits as orogenic Au deposits with an atypical metal association (e.g., Holma and Keinänen 2007; Holma et al. 2007; Eilu 2015). Groves (2003) suggested that some of the deposits that are classified as orogenic Au with atypical metal association are actually base metal-rich deposits overprinted by orogenic Au mineralization through reactivation of the same structures during subsequent events. Our recognition in this study of two distinct mineralizing stages with different fluid characteristics at Juomasuo, with the later Au-rich stage overprinting earlier Co-rich mineralization, is permissive of a model involving the spatial coexistence of two temporally unrelated, contrasting types of mineralization. However, we think that in order to create a reliable ore deposit model, more research is needed to better constrain the age of the mineralizing events, the structural control(s), and the physical-chemical characteristics of the fluids at Juomasuo and other similar Co–Au deposit in northern Finland.
Summary and conclusions
In the Juomasuo deposit, Au–Co mineralization occurs in a strongly altered and metamorphosed volcano-sedimentary sequence of Paleoproterozoic age. The highly altered metavolcanic host rocks can be successfully classified by utilizing drill core observations and bulk chemical compositions on a Nb/Y–Zr/TiO2 discrimination diagram. The five rock types recognized include ultramafic, mafic, intermediate-composition, and felsic meta-igneous rocks, and metasedimentary rocks. The mineralization is not controlled by primary lithology as both Au–Co and Co-only types of mineralization at Juomasuo occur in all rock types except the ultramafic sill.
Widespread albitization that affected the rocks at Juomasuo predates the Au–Co mineralization. The most important alteration minerals closely associated with the mineralization are chlorite and sericite. Chloritization is older than sericitization based on crosscutting relationships. Mainly, Co-only ore was deposited during the chlorite alteration (stage 1) with some Au–Co ore possibly also deposited then. The later mineralization (stage 2) that is linked to sericitization deposited Au–Co ore with higher Au and lower Co contents, compared to the previous mineralization stage, and possibly overprinted parts of the earlier, mostly Co-only mineralization.
Sulfide trace element and sulfur isotope data together with tourmaline crystal chemical and boron isotope data also record two distinct mineralizing stages with different characteristics. Stage 1 pyrite was deposited from a single or homogeneous hydrothermal fluid that was probably derived by metamorphic fluids that leached metals from the volcano-sedimentary sequence, which included mafic volcanic rocks and inferred non-marine evaporites. Stage 2 pyrite, in contrast, was deposited from a relatively oxidized fluid.
Interpretation of an evaporitic component in the early albitization and subsequent Au–Co mineralization processes at Juomasuo is based on tourmaline chemistry, including high Na and Mg contents (medians 0.88 and 2.16 apfu, respectively), relatively low Al contents (< 6.0 apfu), and high inferred Fe3+/Fe2+ ratios, suggesting precipitation of this mineral from saline fluids derived from a meta-evaporitic environment. Tourmaline δ11B data are also in line with this conclusion.
The recognition of two mineralization stages with distinct geochemical characteristics could have implications for exploration elsewhere in the Kuusamo belt. Pyrite geochemistry and the molar element ratio (MER) diagram both proved to be effective tools in discriminating the two stages of mineralization, and could be utilized in creating vectors towards mineralization in the Kuusamo belt and other metallogenic belts having similar geologic and metallogenic characteristics.
Data availability
We were granted access to drill cores and to whole-rock geochemical data by Dragon Mining, previous owners of the Juomasuo property. This manuscript was presented to the current owners of the Juomasuo property, Latitude 66 Cobalt Oy, who granted permission to publish the included data.
References
Addinsoft (2020) XLSTAT statistical and data analysis solution. USA, Boston https://www.xlstat.com
Aitchison J (1986) The statistical analysis of compositional data. Chapman and Hall, London 416 p
Bekker A, Holland HD, Wang PL, Rumble D, Stein HJ, Hannah JL, Coetzee LL, Beukes NJ (2004) Dating the rise of atmospheric oxygen. Nature 427:117–120
Benavides J, Kyser TK, Clark AH, Stanley C, Oates C (2008) Exploration guidelines for copper-rich iron oxide-copper-gold deposits in the Mantoverde area, northern Chile: the integration of host-rock molar element ratios and oxygen isotope compositions. Geochem: Explor, Environ, Anal 8:343–367
Bookstrom AA, Box SE, Cossette PM, Frost TP, Gillerman V, King G, Zirakparvar NA (2016) Geologic history of the Blackbird Co-Cu district in the Lemhi subbasin of the Belt-Purcell Basin. Geol Soc Am Spec Paper 522:185–219
Brugger J, Liu W, Etschmann B, Mei Y, Sherman DM, Testemale D (2016) A review of the coordination chemistry of hydrothermal systems, or do coordination changes make ore deposits? Chem Geol 447:219–253
Cameron EM, Hattori K (1987) Archaean gold mineralization and oxidized hydrothermal fluids. Econ Geol 82:1177–1191
Craw D, Hall AJ, Fallick AE, Boyce AJ (1995) Sulphur isotopes in a metamorphogenic gold deposit, Macraes mine, Otago Schist, New Zealand. New Zealand J Geol Geophys 38:131–136
Dragon Mining Ltd. (2014) Asx announcement, 18 March 2014: resource updates lift Kuusamo ounces http://wwwdragonminingcom/static/files/41/2014-03-18__resource_updates_lift_kuusamo_ouncespdf Accessed 01 March 2019
Dutrow BL, Henry DJ (2018) Tourmaline compositions and textures: reflections of the fluid phase. J Geosci 63:99–110
Eilu P (1994) Hydrothermal alteration in volcanosedimentary rocks in the Central Lapland greenstone belt, Finland. Geol Survey Finland Bull 374:145 p
Eilu P (2015) Overview on gold deposits in Finland. In: Maier WD, O’Brien H, Lahtinen R (eds) Mineral deposits of Finland. Elsevier, Amsterdam, pp 377–403
Eilu P, Korsakova M, Äikäs O (2012) Kuusamo-Kuolajärvi Co-Au. In: Eilu P (ed) Mineral deposits and metallogeny of Fennoscandia. Geol survey Finland spec paper 53, pp. 306–310
Eilu P, Pankka H (2009) FINGOLD—a public database on gold deposits in Finland. Version 1.0. Geol Survey Finland, Digital Data Product 4
Gadd MG, Layton-Matthews D, Peter JM, Paradis SJ (2016) The world-class Howard’s Pass SEDEX Zn-Pb district, Selwyn Basin, Yukon. Part I: trace element compositions of pyrite record input of hydrothermal, diagenetic, and metamorphic fluids to mineralization. Mineral Deposita 51:319–342
George LL, Biagioni C, D'Orazio M, Cook NJ (2018) Textural and trace element evolution of pyrite during greenschist facies metamorphic recrystallization in the southern Apuan Alps (Tuscany, Italy): influence on the formation of Tl-rich sulfosalt melt. Ore Geol Rev 102:59–105
Goad RE, Mumin AH, Duke NA, Neale KL, Mulligan DL, Camier WJ (2000) The NICO and Sue-Dianne Proterozoic, iron oxide-hosted, polymetallic deposits, Northwest Territories—application of the Olympic Dam model in exploration. Explor Mining Geol 9:123–140
Goldfarb RJ, Groves DI (2015) Orogenic gold: common or evolving fluid and metal sources through time. Lithos 233:2–26
Grant JA (1986) The isocon diagram—a simple solution to Gresens equation for metasomatic alteration. Econ Geol 81:1976–1982
Grant JA (1993) Isocon analysis of chemical changes in migmatites and paleosols. Instit Lake Super Geol Program Abstr 39:31–32
Grant JA (2005) Isocon analysis: a brief review of the method and applications. Physics Chem Earth 30:997–1004
Gresens RL (1967) Composition-volume relationships of metasomatism. Chem Geol 2:47–55
Grorud H-F (1997) Textural and compositional characteristics of cobalt ores from the Skuterud mines of Modum, Norway. Nor Geol Tidsskr 7:31–38
Groves D, Goldfarb RF, Hart C (2003) Gold deposits in metamorphic belts: overview of current understanding, outstanding problems, future research, and exploration significance. Econ Geol 98:1–29
Grundler PV, Brugger J, Etschmann BE, Helm L, Liu WH, Spry PG, Tian Y, Testemale D, Pring A (2013) Speciation of aqueous tellurium(IV) in hydrothermal solutions and vapors, and the role of oxidized tellurium species in Te transport and gold deposition. Geochim Cosmochim Acta 120:298–325
Hanski E, Huhma H (2005) Central Lapland greenstone belt. In: Lehtinen M, Nurmi PA, Ramo OT (eds) Precambrian geology of Finland—key to the evolution of the Fennoscandian shield. Elsevier, Amsterdam, pp 139–194
Hazarika P, Mishra B, Pruseth KL (2015) Diverse tourmaline compositions from orogenic gold deposits in the Hutti-Maski greenstone belt, India: implications for sources of ore-forming fluids. Econ Geol 110:337–353
Henry DJ, Guidotti CV (1985) Tourmaline as a petrogenetic indicator mineral: an example from the staurolite-grade metapelites of NW Maine. Am Mineral 70:1–15
Henry DJ, Sun H, Slack JF, Dutrow BL (2008) Tourmaline in metaevaporites and highly magnesian rocks: perspectives from Namibian tourmalinites. Eur J Mineral 20:889–904
Hodkiewicz PF, Groves DI, Davidson GJ, Weinberg RF, Hagemann SG (2009) Influence of structural setting on sulphur isotopes in Archaean orogenic gold deposits, eastern Goldfields Province, Yilgarn, Western Australia. Mineral Deposita 44:129–150
Holma MJ, Eilu P, Keinänen VJ, Ojala VJ (2007) The Sirkka Au-Cu-Ni-Co occurrence, northern Finland: an orogenic gold deposit with multimetallic, atypical metal association. In: Andrew CJ et al (eds) Digging deeper. Proceedings of the Ninth Biennial SGA Meeting, Dublin, pp 581–584
Holma MJ, Keinänen VJ (2007) The Levijärvi-Loukinen gold occurrence: an example of orogenic gold mineralisation with atypical metal association. In: Ojala VJ (ed) Gold in the Central Lapland Greenstone Belt, Finland. Geol Survey Finland, Spec Paper 44:165–184
Hölttä P, Heilimo E (2017) Metamorphic map of Finland. In Nironen M (ed) Geol Survey Finland Spec Paper 60, 77–128
Huhma H, Hanski E, Kontinen A, Vuollo J, Mänttäri I, Lahaye Y (2018) Sm-Nd and U-Pb isotope geochemistry of the Palaeoproterozoic mafic magmatism in eastern and northern Finland. Geol Survey Finland Bull 405 150 p
Huston DL, Sie SH, Suter GF, Cooke DR, Both RA (1995) Trace-elements in sulfide minerals from eastern australian volcanic-hosted massive sulfide deposits. 1. Proton microprobe analyses of pyrite, chalcopyrite, and sphalerite, and. 2. Selenium levels in pyrite – comparison with delta-S-34 values and implications for the source of sulfur in volcanogenic hydrothermal systems. Econ Geol 90:1167–1196
Jiang S-Y, Palmer MR, Yeats CJ (2002) Chemical and boron isotopic compositions of tourmaline from the Archean Big Bell and Mount Gibson gold deposits, Murchison Province, Yilgarn craton, Western Australia. Chem Geol 188:229–247
Karhu J (1993) Paleoproterozoic evolution of the carbon isotope ratios of sedimentary carbonates in the Fennoscandian Shield. Geol Survey Finland Bull 371:87 p
Köykkä J, Lahtinen R, Huhma H (2019) Provenance evolution of the Paleoproterozoic metasedimentary cover sequences in northern Fennoscandia: age distribution, geochemistry, and zircon morphology. Precambrian Res 331:105364
Laajoki K (2005) Karelian supracrustal rocks. In: Lehtinen M, Nurmi PA, Rämö OT (eds) The Precambrian bedrock of Finland—key to the evolution of the Fennoscandian shield. Elsevier, Developments in Precambrian Geology, 14, pp. 279–341
Lahtinen R, Köykkä J (2020) Multiply deformed Paleoproterozoic foreland fold and thrust belt in northern Fennoscandia—the peripheral Kuusamo belt as a key example. Precambrian Res 346:105825. https://doi.org/10.1016/j.precamres.2020.105825
Large RR, Danyushevsky L, Hollit C, Maslennikov V, Meffre S, Gilbert S, Bull S, Scott R, Emsbo P, Thomas H, Singh B, Foster J (2009) Gold and trace element zonation in pyrite using a laser imaging technique: implications for the timing of gold in orogenic and Carlin-style sediment-hosted deposits. Econ Geol 104:635–668
Le Bas MJ, Le Maitre RW, Streckeisen A, Zanettin B (1986) IUGS Subcommission on the systematics of igneous rocks: a chemical classification of volcanic rocks based on the total alkali-silica diagram. J Petrol 27:745–750
Liu W, Migdisov A, Williams-Jones A (2012) The stability of aqueous nickel(II) chloride complexes in hydrothermal solutions: results of UV–visible spectroscopic experiments. Geochim Cosmochim Acta 94:276–290
López-Moro FJ (2012) EASYGRESGRANT—a Microsoft excel spreadsheet to quantify volume changes and to perform mass-balance modeling in metasomatic systems. Comput Geosci 39:191–196
Marschall HR, Jiang S-Y (2011) Tourmaline isotopes: no element left behind. Elements 7:313–319
Molnár F, Mänttäri I, O'Brien H, Lahaye Y, Pakkanen L, Johanson B, Käpyaho A, Sorjonen-Ward P, Whitehouse M, Sakellaris G (2016) Boron, sulphur and copper isotope systematics in the orogenic gold deposits of the Archean Hattu schist belt, eastern Finland. Ore Geol Rev 77:133–162
Molnár F, O'Brien H, Stein H, Kurhila M, Lahaye Y (2020) Timing of formation of orogenic gold deposits during the Svecofennian orogeny in the northern part of the Fennoscandian shield. In: Nakrem HA, Husås AM (eds) The 34th Nordic Geological Winter Meeting, January 8th–10th 2020, Oslo, Norway: Proceed Geol Soc Norway no. 1, 2020, pp 143–144
Munz IA, Wayne D, Austrheim H (1994) Retrograde fluid infiltration in the high-grade Modum complex, South Norway–evidence for age, source and REE mobility. Contrib Mineral Petrol 116:32–46
Ohmoto H (1972) Systematics of sulfur and carbon isotopes in hydrothermal ore deposits. Econ Geol 67:551–578
Ohmoto H (1986) Stable isotope geochemistry of ore deposits. In: Valley JW, Taylor HP Jr., O’Neil JR (eds) Stable isotopes in high temperature geological processes. Rev Mineralogy 16, pp. 491–559
Pan Y, Therens C (2000) The Werner Lake co-cu-au deposit of the English River Subprovince, Ontario, Canada: evidence for an exhalative origin and effects of granulite facies metamorphism. Econ Geol 95:1635–1656
Pankka H (1989) Kuusamon Juomasuon Co-Au esiintymän malmitutkimukset vuosina 1985–1989. Geol Survey Finland, Rep M19/4613/−89/1/10, 28 p
Pankka H (1992) Geology and mineralogy of Au-Co-U deposits in the Proterozoic Kuusamo volcanοsedimentary belt, northeastern Finland. Unpub PhD dissertation, Michigan Technological University, Houlton, Michigan, USA
Pankka H, Puustinen K, Vanhanen E (1991) Kuusamon liuskealueen kulta-koboltti-uraaniesiintymät. Summary: Au-Co-U deposits in the Kuusamo volcano-sedimentary belt, Finland. Geol Survey Finland, Rep Invest 101, 53 p
Pankka H, Vanhanen E (1992) Early Proterozoic Au-Co-U mineralization in the Kuusamo district, northeastern Finland. Precambrian Res 58:387–400
Pearce JA (1996) A users guide to basalt discrimination diagrams. In: Wyman DA (ed) Trace element geochemistry of volcanic rocks: applications for massive sulphide exploration. Geol Assoc Canada short course notes 12, pp. 79–113
Pekkala Y (1985) Petrography, geochemistry and mineralogy of the Precambrian metasedimentary carbonate rocks in north Kuusamo, Finland. Geol Survey Finland Bull 332:62 p
Pitcairn IK, Olivo GR, Teagle DAH, Craw D (2010) Sulfide evolution during prograde metamorphism of the Otago and Alpine Schists, New Zealand. Can Min 48:1267–1295
Pohjolainen E, Molnár F, O’Brien H, Huhma H, Tiljander M, Sorjonen-Ward P, Lukkari S, Johanson B (2017) U-Pb geochronology of monazite from the Hangaslampi gold deposit in the Paleoproterozoic Kuusamo schist belt, northern Finland: implications for dating multi-stage mineralizing events. In: Mineral resources to discover: proceed 14th SGA biennial meet, Quebec City, Canada, 1039–1042
Ranta J, Hanski E, Cook N, Lahaye Y (2017) Source of boron in the Palokas gold deposit, northern Finland: evidence from boron isotopes and major element composition of tourmaline. Mineral Deposita 52:733–746
Reimann C, Filzmoser P, Garrett RG, Dutter R (2008) Statistical data analysis explained: applied environmental statistics with R. John Wiley & Sons Ltd, Chichester 362 p
Saintilan NJ, Creaser RA, Bookstrom AA (2017) Re-Os systematics and geochemistry of cobaltite (CoAsS) in the Idaho cobalt belt, Belt-Purcell Basin, USA: Evidence for middle Mesoproterozoic sediment-hosted Co-Cu sulfide mineralization with Grenvillian and cretaceous remobilization. Ore Geol Rev 86:509–525
Seal RR (2006) Sulfur isotope geochemistry of sulfide minerals. Rev Miner Geochem 61:633–677
Silvennoinen A (1972) On the stratigraphic and structural geology of the Rukatunturi area, northeastern Finland. Geol Survey Finland Bull 257:48 p
Silvennoinen A (1991) Kuusamon ja Rukatunturin karttaalueiden kallioperä. [Pre-Quaternary rocks of the Kuusamo and Rukatunturi map-sheet areas.] Geological Map of Finland 1: 100 000. Explanation to the maps of pre-Quaternary rocks, Sheets 4524+4542 and 4613. Geol Survey Finland, Espoo, 62 p
Silvennoinen A (1992) General geological setting and deep fracture structures in the Kuusamo-Kuolajärvi-Paanajärvi area. In: Silvennoinen A (ed) Deep fractures in the Paanajärvi-Kuusamo-Kuolajärvi area. Proceed Finnish-Soviet Symposium in Finland, 18-21 Sept 1989. Geol Survey Finland Spec Paper 13, pp. 5–10
Slack JF (2012) Strata-bound Fe-Co-Cu-Au-Bi-Y-REE deposits of the Idaho cobalt belt: multistage hydrothermal mineralization in a magmatic-related iron oxide-copper-gold system. Econ Geol 107:1089–1113
Slack JF (ed) (2013) Descriptive and geoenvironmental model for copper-cobalt-gold deposits in metasedimentary rocks. US Geol Survey Sci Invest Rept 2010–5070–G, 218 p
Thompson AJB, Thompson JFH, Ounne KPE (eds) (1996) Atlas of alteration: a field and petrographic guide to hydrothermal alteration minerals. Geol Assoc Canada, Mineral Deposits Div, 119 p
Tiira T, Janik T, Kozlovskaya E, Grad M, Korja A, Komminaho K, Hedegus E, Kovacs CA, Silvennoinen H, Brückl E (2014) Crustal architecture of the inverted Central Lapland Rift along the HUKKA 2007 profile. Pure Appl Geophys 171:1129–1152
Trumbull RB, Codeço MS, Jiang S-Y, Palmer MR, Slack JF (2020) Boron isotope variations in tourmaline from hydrothermal ore deposits: a review of controlling factors and insights for mineralizing systems. Ore Geol Rev 125:103682. https://doi.org/10.1016/j.oregeorev.2020.103682
van Achterbergh E, Ryan CG, Jackson SE, Griffin WL (2001) Data reduction software for LA-ICP-MS, in Sylvester PJ (ed) Laser ablation-ICP-mass spectrometry in the earth sciences: Principles and applications: miner Assoc Canada, short course series, 29, pp. 239–243
van Hinsberg VJ, Henry DJ, Marschall HR (2011) Tourmaline: an ideal indicator of its environment. Can Mineral 49:1–16
Vanhanen E (1990) Sulfidimalmi- ja kultatutkimukset Kuusamon ja Sallan kuntien alueilla vuosina 1983–1988 kohteissa Vilkaslampi, Painanteenniitty, Maitokoski, Perttuma-aapa, Juhonlampi, Pullealampi, Manalanniemi. Geol Survey Finland, Unpub Rep M19/4524/−90/2/10, 39 p
Vanhanen E (2001) Geology, mineralogy and geochemistry of the Fe-Co-Au-(U) deposits in the Paleoproterozoic Kuusamo schist belt, northeastern Finland. Geol Survey Finland Bull 399:229 p
Warren I, Simmons SF, Mauk JL (2007) Whole-rock geochemical techniques for evaluating hydrothermal alteration, mass changes, and compositional gradients associated with epithermal au-Ag mineralization. Econ Geol 102:923–948
Winchester JA, Floyd PA (1977) Geochemical discrimination of different magma series and their differentiation products using immobile elements. Chem Geol 20:325–343
Witt WK, Hagemann SG, Roberts M, Davies A (2020) Cobalt enrichment at the Juomasuo and Hangaslampi polymetallic deposits, Kuusamo schist belt, Finland: a role for an orogenic gold fluid? Mineral Deposita 55:381–388
Zhao HX, Frimmel HE, Jiang S-Y, Dai BZ (2011) LA-ICP-MS trace element analysis of pyrite from the Xiaoqinling gold district, China: implications for ore genesis. Ore Geol Rev 43:142–153
Acknowledgments
We would like to thank John Slack, Dan Kontak, and Pasi Eilu for their constructive comments that helped improve the quality of the text. The Ion Probe Nancy Team is warmly acknowledged for their help with the SIMS analyses at the CRPG laboratory.
Code availability
Not applicable
Funding
Open Access funding provided by University of Oulu including Oulu University Hospital. This work was financially supported by grants from the Vilho, Yrjö, and Kalle Väisälä Foundation; the K.H. Renlund Foundation; the Finnish Cultural Foundation; the Horizon 2020 NEXT project; and the Academy of Finland #281670–MinSysPro project.
Author information
Authors and Affiliations
Corresponding author
Ethics declarations
Conflict of interest
Not applicable
Additional information
Editorial handling: P. Eilu
Publisher’s note
Springer Nature remains neutral with regard to jurisdictional claims in published maps and institutional affiliations.
Supplementary information
Online Resource 1
(PDF 278 kb)
Online Resource 2
(PDF 430 kb)
Online Resource 3
(PDF 802 kb)
Online Resource 4
(PDF 186 kb)
Online Resource 5
(PDF 643 kb)
Online Resource 6
(PDF 1161 kb)
Rights and permissions
Open Access This article is licensed under a Creative Commons Attribution 4.0 International License, which permits use, sharing, adaptation, distribution and reproduction in any medium or format, as long as you give appropriate credit to the original author(s) and the source, provide a link to the Creative Commons licence, and indicate if changes were made. The images or other third party material in this article are included in the article's Creative Commons licence, unless indicated otherwise in a credit line to the material. If material is not included in the article's Creative Commons licence and your intended use is not permitted by statutory regulation or exceeds the permitted use, you will need to obtain permission directly from the copyright holder. To view a copy of this licence, visit http://creativecommons.org/licenses/by/4.0/.
About this article

Cite this article
Vasilopoulos, M., Molnár, F., O’Brien, H. et al. Geochemical signatures of mineralizing events in the Juomasuo Au–Co deposit, Kuusamo belt, northeastern Finland. Miner Deposita 56, 1195–1222 (2021). https://doi.org/10.1007/s00126-020-01039-8
Received:
Accepted:
Published:
Issue Date:
DOI: https://doi.org/10.1007/s00126-020-01039-8