
Abstract
The elastic—full plastic loading curve is for all materials sufficient to explain the strength of beams and beam columns loaded by bending and compression. This theory is extended for the influence of shear stress, and it is shown to be the only way to explain the combined bending-shear strength from test results. Also, the in the past derived bearing strength theory is extended here for bracing action. It will be shown for continuous beams as example, that besides moment redistribution by plastic flow in bending, a plastic shear flow mechanism exists that is also able to cause full moment redistribution. The derivations lead to requirements for the design rules and show how the shear stress may reduce the ultimate bending capacity.
Zusammenfassung
Die bi-lineare elastisch-plastische Arbeitslinie reicht bei allen Materialien aus, um die Festigkeit von Balken und Stützen unter Biege- und Druckbelastung zu beschreiben. Diese Theorie wird hier um den Einfluss der Scherspannung erweitert, und es wird gezeigt, dass nur auf diese Weise die in Versuchen ermittelte, kombinierte Biege-Scherfestigkeit bestimmt werden kann. Des Weiteren wird die herkömmliche Traglasttheorie für den Fall der Stüzenwirkung erweitert. Am Beispiel des Durchlaufträgers wird gezeigt, dass neben der Momentenumlagerung durch plastisches Fließen infolge Biegung auch ein plastisches Fließen infolge Schubs existiert, das ebenfalls zu einer vollständigen Momentenumlagerung führen kann. Aus den Herleitungen ergeben sich Anforderungen an die Bemessungsregeln, und sie zeigen, wie die Scherspannung die Biegetragfähigkeit reduzieren kann.
1 Introduction
Because of the renewed attention to the bearing and shear strength of beams, leading to new proposals for the Eurocode, that should not be based on empirical rules, a theoretical analysis, explaining the test results, is necessary as real basis for the design rules. As continuation on the theoretical explanation of the bearing strengths of locally loaded blocks in van der Put (2008) and the bracing action in van der Put (1991), the theory is extended here, based on the data of beams loaded close to the supports (Vermeijden 1968) by showing that besides the ultimate compression strength by confined dilatation, the shear strength is determining for this mechanism. Thus, by adequate dimensions of the bearing plates, the shear strength is determining.
Based on the elastic-plastic beam theory, that was extended for the influence of normal force and shear in van der Put (1991), the apparently contradictory test results by Leicester and Young (1991) of the shear- and bending strengths of beams and continuous beams could be explained. It appears that the usually applied secant modulus approach according to the theory of elasticity is not able to explain the data by Leicester and Young (1991) and Vermeijden (1968), nor to give the right stress distribution in two span beams, underestimating the bearing capacity by a factor of 2/3, in Vermeijden (1968), while the elastic-plastic beam theory according to Fig. 1 gives a very precise description of the data and the determining shear- and bending strengths. These derivations, confirmed by the tests, lead to the proper requirements for design rules for the Codes, given here in the conclusions.

Bending and shear stresses
Biege- und Scherspannungen
2 Shear and bending strengths of beams
When there is plastic flow in compression, shear only can be carried in the elastic region. It has been shown before that perfect linear elastic-plastic behavior, leading to this simple shear stress distribution, given in Fig. 1, is a good approach, according to the equilibrium method, to model plastic deformation with respect to the theoretical one given in van de Kuilen (1991), where the exact tanh-approach is used for the stresses in the compression zone.
Accordingly, Fig. 1 is for bending of a rectangular beam of width b and height h, loaded by a moment M and a shear force V:
The resultant normal force is zero, thus:
Elimination of x/h from (1) and (2) gives for σ m the quasi linear bending stress:
The total shear force V is:
or by substitution of 1−x/h from (2):
where σ c , σ t , σ′ v are the compression, tension and shear stress, respectively. The design shear stress σ v is the quasi linear elastic shear stress divided by the total height “h”, following from a linear elastic stress calculation. Thus, σ v and the design bending stress σ m follow from the secant modulus up to the ultimate load point.
At bending failure is: σ c =f c , or σ t =f t and the design σ m =f m . At shear failure is: σ′ v =f′ v and the design σ v =f v .
For failure in bending and shear, there is a critical value of the shear slenderness M u /V u h where the ultimate bending strength is reached at the same time as the ultimate shear stress. In the test of Fig. 3 is, according to (3) and (4):
The value 3 as critical value mostly applies as mean value for common dimensions and strength classes. At this critical value the strengths f m according to Fig. 2 (bending failure) and Fig. 3 (shear—bending failure at a/h=3) are equal. However, this is not the case for high grades as discussed below. The meaning of a/h is given in Fig. 2. Above the critical value of a/h, shear is not determining and there is bending failure with σ c =f c and σ t =f t . Below this value, rotation and bending strength is reduced by the high shear force reducing the thickness of the plastic zone x until x=0 (at M/Vh≈1 to 1.5, depending on the grade). Then the maximal possible shear strength is reached: V u =0.67f′ v bh=0.67f v bh, at a moment: M u =f m bh 2/6=f c bh 2/6 (f t >f c because f t is the bending tensile strength that, by the volume effect, is about 1.7 times the real tensile strength). For high grades thus a different critical a/h applies. This can be explained by the modified beam theory given here. This was shown in a review of the preliminary publication by Leicester and Young (1991) but not applied by the author in its final version. It is therefore published in van der Put (1991) of the same meeting.

Test specimen for the bending strength, L/h=18, sample size 50, f m =77.8 MPa with σ v =3.2 MPa (<f s , no shear failures)
Proben für die Biegefestigkeit, L/h=18, Probenanzahl 50, f m =77,8 MPa mit σ v =3,2 MPa (<f s , keine Scherbrüche)

Test specimen for the shear strength, L/h=6, sample size 70, σ m =64.8 MPa and f v =5.4 MPa (only shear failures)
Proben für die Scherfestigkeit, L/h=6, Probenanzahl 70, σ m =64,8 MPa und f v =5,4 MPa (nur Scherbrüche)
In Leicester and Young (1991) the following supposed contradictions were given regarding the strengths of high quality wood, LVL (laminated veneer lumber):
-
Figures 3 and 4 show a lower bending strength than Fig. 2, although the opposite is expected because of the volume effect.
Fig. 4 Abb. 4 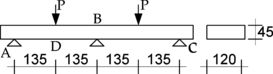
Australian test specimen for the shear strength, L/h=6, sample size 14, f m =50.0 MPa with σ v =7.6 MPa (2 specimens failed in shear)
Australische Proben für Scherfestigkeit, L/h=6, Probenanzahl 14, f m =50,0 MPa mit σ v =7,6 MPa (bei 2 Proben Brüche unter Scherlast)
-
The shear strength of 7.6 MPa of Fig. 4 is about 40% higher than the shear strength of 5.4 MPa of the standard shear test of Fig. 3, while the bending strength is lower.

To explain this, first the elastic moment distribution of the beam on 3 supports, occurring at first flow, is determined. A cut of the beam at the middle support at point B (Fig. 4) will give a rotation at B by the loading P of: φ=PL 2/16EI. Only the non-symmetrical shear strain due to M B /L will also give a rotation at B. The moment at support B to close the gap gives a contrary rotation of φ′=M B L/3EI. However, the shear deformation caused by the reaction M B /L of this moment also closes the gap by: γ=τ/G≈M B /LbhG. Thus:
With: h=45 mm; L=270 mm follows that \(M_{B}=0.9\cdot\frac{3PL}{16}\). Consequently, for σ m , 0.9⋅50=45 MPa is found.
It now appears that the field- and support moments are equal and also that σ m ≈f c ≈45 MPa. The equality of field- and support moment is verified by a finite element calculation for this case in van de Kuilen and Leijten (2001).
The shear slenderness: M/Vh of the field moment at the side of the free support is: M/Vh=L/2h=3. This is not determining because at the mid-support is: \(\frac{M_{B}}{V_{B}h}\approx\frac{L}{4h}\approx 1.5\) (=f m /4f v =45/(4⋅7.6)≈1.5).
In general, the shear slenderness M/Vh can be written according to (5) and (3), with α being the ratio between tensile stress and compression strength \(\alpha =\frac{\sigma _{t}}{f_{c}}\):

showing that there is just no plastic flow and indicating that the maximal bending stress is: σ m =f c =45 MPa and the maximal shear stress is: f v =f′ v =7.6 MPa. For Fig. 3 now applies: M/Vh=L/2h=3 and f v =5.4 MPa or:
giving a bending strength of:
in agreement with the measured value of 64.8 MPa.
The bending strength of the bending test of Fig. 2 is: f m =77.8 MPa. Thus:
as is common for high quality wood (van der Put 1991). The maximal shear stress of 7.6 MPa occurs at the neutral line at point B. For shear failure at plastic flow in compression, as in Fig. 2, the maximal shear stress is combined with a tension stress and will be, also due to the volume effect, about 0.9 times lower. Thus: f′ v =0.9⋅f v =0.9⋅7.6=6.8 MPa. This means that the real design shear strength at the maximal bending strength will be:
that will occur in the test at: a/h=(3⋅2.15−1)⋅45/(3.15⋅4⋅4.3)=4.5.
Thus for LVL the bending test can be repeated with the load at a distance of 203 mm from the support to obtain the shear strength at ultimate bending without bending strength reduction.
In this comparison of different beams and loading cases, it is assumed that corrections for volume effect for bending, as for clear wood, can be ignored for LVL. If there is any effect, it will be included in the values of α. The same is to be expected for the tropical hard woods in van de Kuilen and Leijten (2001). The measured shear strength of 9.1 N/mm2 of the web of the Spruce I-profile in van de Kuilen and Leijten (2001) is, as can be expected from (9): f v =19.20−3.03log A v , or f v =19.20−3.03log (110×20)=9.1 N/mm2, where A v is the area of the web.
Because in Fig. 4 the field and support moments are almost equal and M B is equal to the linear elastic ultimate moment due to the high shear loading, this should also be the case for the field moment and a brittle failure in bending is to be expected. This is not reported in Leicester and Young (1991), and from the tests by Vermeijden (1968) it follows that by the high shear stress, there is stress redistribution and a flow in shear, making the gap between the beams AB and CB, to be closed by M B , much smaller, reducing M B and providing compatibility for flow of the field bending moments in the ultimate state.
3 Shear strength of close to the support loaded two span beams
3.1 Test results
In Vermeijden (1968), two series of tests have been done for concrete formwork according to Figs. 5 and 6 with variable values of “a”. Here, the calculated M B /V B h values range from 0.9 to 2.6, giving an extension around the shear slenderness value of 1.5 of Fig. 4. The test-results are given in Table 1. The design stresses follow from:
For Series A, the reactions R, shear forces V and moments M are:


Series A, a=8, 12, 16 and 24 cm; L/h=11.6, sample size 4×5=20; b×h=59×78 mm2
Prüfreihe A, a=8, 12, 16 und 24 cm; L/h=11.6, Probenanzahl 4×5=20; b×h=59×78 mm2

Series B, a=8, 12, 14, 16, 24 cm; L/h=10.3, sample size 5×4=20; b×h=59×78 mm2
Prüfreihe B, a=8, 12, 14, 16, 24 cm; L/h=10.3, Probenanzahl 5×4=20; b×h=59×78 mm2
The failure modes of Series A are as follows:
-
At a=80 mm, failure occurs by compression perpendicular to the grain after a huge deformation (flow) at the loading points and in one of the 5 beams also by shear and bending failure at point B.
-
At a=120 mm, there also is a strong deformation at the loading points. Failure of 4 of the 5 beams occurs by bending in the field at knots near P and in one case also at point B. One beam failed by shear.
-
At a=160 mm, the same occurred as at a=120 mm.
-
At a=240 mm, all 5 beams failed by bending in the field and 2 beams also by failures at the middle support.
For Series B, the reactions R, shear forces V and moments M are:

The failure modes of Series B are as follows:
-
At a=80 mm, failure occurred by compression, pressing the wood fully together. Secondary bending failure also occurred in 2 beams after strong deformation and cut through of the fibers by the steel plates of the middle support, point B. At a=120 mm, there is also a strong deformation at the support and loading points. Failure occurred by shear and in one case also by secondary bending failure at B.
-
At a=140 mm, bending failure occurred at the middle support.
-
At a=160 mm, bending failure occurred at B in 3 of the 4 beams, in one case combined with shear failure. Shear failure alone occurred in 1 of the 4 beams.
-
At a=240 mm, all beams failed by bending at point B. In one beam also at point P.
3.2 Discussion of the test results
In Table 1 of Series A, at a=240 mm, all beams failed by bending in the field although the bending moment at support B is 1.6 times higher. This cannot be explained by a volume effect or a round-off of the moment-peaks by the fact that the reaction is not a point load, because then the strength should also strongly increase with smaller values of a/h, yet the contrary is occurring. According to Larsen (1975), the volume effect for bending is:
where “c” ranges from c=1.05 when L/h=35 to c=1.15 when L/h=7. Consequently:
For equal beam depths, the determining strength ratio by the volume effect thus is:
while the round-off effect of M B is of the same order: 0.9, showing the total influence of these effects to be negligible and as a result, there should be a strong moment redistribution by plasticity.
Flow in compression perpendicular to the grain in the oblique bracing direction, also causes flow in shear deformation of the beams cross section at B. This strongly reduces the moment at the support M B . This shear deformation at the B cross section also occurred at a/h=1, and for a higher value of a=160 mm, even a pure shear mechanism did occur. It can be concluded that there is clear moment redistribution, reducing M B which at the end will be equal to the field moment as shown by the failure of both moments in e.g. beam 8a and 10a. The calculation of the real failure stresses should therefore not be based on linear elastic design values, but on a mechanism according to the theory of plasticity as will be discussed later.
3.3 Explanation of the measured shear strength
The shear strength of a large number of tests can e.g. be found in Larsen (1975) and the regression line of all tests of shear in bending, shear in torsion and block shear is:
where f v is in MPa and A v is the sheared area in mm2. Omitting the block tests, the regression line is:
For the tests by Vermeijden (1968), the values of A v =b×a are: for b=58.7 mm and a=80, 120, 140, 160 and 240 mm, given in Table 2. For the median value of A v =58.7×140=8218 mm2, the reference value for the shear strength becomes:
and (8) can be written:

According to the theory of the Appendix A the power law approximation gives:
and the last equation becomes:
The other regression line (9) gives n=0.18 and f v,0=7.3 MPa. For the data by Vermeijden (1968), f v,0 is still lower, f v,0=6.8 MPa, probably because only bending with shear is involved and due to the higher moisture content and lower grade. The power law representation of the regression line gives a meaning to the data to represent the volume effect according to the Weibull weakest link theory. The variation coefficient for the occurring of failure determining disturbances is 1.2⋅0.186=0.22.
Because f v is not very sensitive for the value of “n”, a rounded value of n=0.2 can be chosen. This is the same value as given in Eurocode 5 for larger dimensions. This value leads to:
giving a precise fit in Table 2 and an explanation of the measured strength values to be governed by shear failure in probably all cases.
3.4 Determination of the bending strength
When shear is determining, the pure shear flow mechanism over length “a” of the beam requires two equal opposite ultimate shear forces V U and thus also two equal opposite end moments of V U a/2. Thus for Series B, the field moment M P is equal to M B , the moment at the support as given in Fig. 7. For Series A, this also is the case due to the bending flow mechanisms which start earlier before shear flow. It can be seen in Table 3 for Series A that σ m reaches the bending strength.

Equal field and support moments M P =M B of Series B
Gleiche Feld- und Auflagenmomente M P =M B von Prüfreihe B
According to Fig. 7 is, for equal moments:


The same applies for Series A, Fig. 8, leading for the highest shear force to:

These equations result in the strength values given in Table 3.

Equal field and support moments M P =M B of Series A
Gleiche Feld und Auflagenmomente M P =M B von Prüfreihe A
The shear strength according to (11), adapted to the strength of 6.35 MPa at a=140 mm, becomes:
and is given in Table 4.
The data of f v suggest the same cause and type of shear failure in Series A and B shown in Tables 2 and 4. The calculated mean value of the shear strength of both series appears to follow the theoretical (16) precisely.
The increase of the bending strength f m is explained by the beam theory (see Fig. 1 and (1) to (5)) showing a decrease of the ultimate shear force with the increase of M/Vh and an increase of the bending rotation with a coinciding increase of the bending moment. Series B, at a=240 mm, did show only bending failure, while for lower values of “a” combined bending and shear failures occurred. The boundary of this combined failure thus lies here at a value of a=160 mm. This means for Series B of Table 3 at a=160 mm, that α=1, and f m =f c =25.5 MPa and f v =f′ v =6.2 MPa. For a=240 mm then, the ultimate combined shear-bending strength according to (3) is:

Consequently:
which agrees with the measured value of 5.4 MPa in Table 3.
The value of α=1.34=f t /f c =1.7⋅f t,0/f c , gives f t,0/f c =1.34/1.7=0.8. Thus the tensile strength f t,0 is 0.8 times the compression strength. The factor 1.7 is due to the volume effect of the bending tensile strength f t with respect to the pure tensile strength f t,0. Below a slenderness ratio of M/Vh=1, there is no flow in bending and there is a linear elastic bending stress state: σ m <f m ; σ m,t =σ m,c , or α=1. Thus the point where f m =f c and f v =f′ v and α=1, occurs at M/Vh=1 in Series B. For Series A, this point is found by interpolation in Table 3 between a=80 mm and 120 mm, where M/Vh=0.9 to 1.2, giving f m =f c =28 MPa. With this value of f c , the values of f m /f c for other values of “a” can be calculated. According to (17), based on (3), the values of α are known and are given in Table 5.
An adaptation of f′ v,0 of (16), to give the value of 7.6 MPa at a=80 mm, is:
This adaptation of f v for the stronger Series A is, according to (4) or (7):
Based on the data base at that time, the bending strength at 20% m.c. is 35.4 MPa for ungraded wood at commercial sizes applying for beams of at least twice the height of the test specimens. Thus, including the volume effect, the bending strength here is: (2)0.11⋅35.4=1.08⋅35.4=38.2 MPa. According to Table 5, the maximal bending strength is thus reached at a=240 mm, at M/Vh=2.
4 Bracing behavior for small values of a/h
Generally, the shear strength in combination with the volume effect determines the load carrying capacity for beams loaded close to the support. However, this bearing capacity may be reduced further when the compression strength perpendicular to the grain is made determining as well. As mentioned in Table 1, at a=80 mm, failure by compression perpendicular to the grain starts to be determining for the strength at the chosen dimensions of the bearing plate at the support. Compression perpendicular to the grain shows no volume effect. The by the volume effect increasing shearing strength is cut-off for values of “a” smaller than 80 mm. This cut-off also applies for bearing by one or two dowel joints. It is shown for many cases, for instance in van der Put and Leijten (2000) that the spreading model also applies for a load on a beam by a dowel. The compression strength of the inclined bracing of Fig. 9 follows from the bearing strength, discussed in van der Put (2008). This bearing strength is:

thus it is the same as for not inclined bracing. The equality: σ s,φ /σ c,φ =f s /f c,90 follows from the maximum stress criterion perpendicular to the grain, that is a safe lower bound of the strength for not too high angles φ because it does not contain the influence of hardening. With L=60 mm and s=50 mm of the loading plates and H=80 mm, is:
Thus f c,90=7.3/2.1=3.5 MPa as mean value of Table 3 of Series A and B, at the determining value of a=80 mm. This is comparable with the f c,90 values by van der Put (2008).

Bearing or bracing mechanism
Tragfähigkeits- oder Befestigungsmechanismus
Because in this investigation the σ c,90 stresses decrease when “a” increases from a=80 to a=240 mm, exactly the same way as the shear strength f v , the shear strength is determining and not the compression strength perpendicular to the grain of the bracing action. This should be the case up to the situation of Fig. 10, because for smaller values of a<80 mm, not the whole load R/2 is transmitted by shear. Thus half the length of the central bearing plate should be: \(l=0.67\cdot\frac{f_{v}\cdot h}{f_{s}}=0.67\cdot 7.0\cdot 80/7.3=50\) mm, as is applied. Here f v =7 MPa is the shear strength at a=80 mm, the mean value at a=80 mm in Table 4. In general, for the bearing length applies: l=0.64⋅h. For a middle support two times this value it thus applies,
Because the spreading for combined shear failure is not higher than for compression failure in this case, this rule should also apply for design values of the strengths.

No overlap of bearing plates at a=80 mm
Kein Überlappen von Auflageplatten bei a=80 mm
5 Biaxial failure criterion
The design rules for bearing blocks (van der Put 2008) are based on flow and hardening in triaxial conditions by the confined dilatation. This confinement often depends on the friction between wood and the steel bearing plate and not on structural means. Maybe therefore these rules are not used for the verification of combined stresses at the supports and loading points of beams. Current failure criteria in design codes, such as Eurocode 5 for combined stresses are based on test results of biaxial and uniaxial tests. For combined stresses in beams, the tensor-polynomial failure criterion by van der Put (1993) then should be applied. It follows from van der Put (1993) that the bending compression strength along the grain increases by compression perpendicular up to a maximum and then decreases when compression perpendicular to grain is further increased. For this reason, there still is no decrease of the bending compression strength when the compression perpendicular is about half of the uniaxial compression strength f c,90/2 (in the weakest plane). As long as the multi-axial stress approach is not used, the compression stress perpendicular to the grain at a middle support should safely be limited to f c,90/2 in order to maintain the ultimate compression stress of the bending strength of the beam. For end-supports, f c,90 should apply. This leads to l/h=1.33 for end-supports and 2l/h=5.33 for the middle support, which is fully unrealistic. This means that, by applying much smaller values or l/h in practice and in the Codes, the triaxial compression strength and hardening discussed above have already been accepted.
6 Conclusion
-
The elastic-plastic beam theory is extended for the influence of shear force (Fig. 1), providing the means to give the definition of the combined bending-shear strength.
-
Based on this extended beam theory, the apparent contradictory LVL test results (Leicester and Young 1991) of the shear- and bending strengths of beams and continuous beams and tests on two span beams (Vermeijden 1968) are precisely explained.
-
It appears that the linear secant modulus theory of elasticity is not able to explain the strength data by Leicester and Young (1991) and Vermeijden (1968), nor is it able to give the correct stress distribution in two span beams. It underestimates the bearing capacity of the tested beams by Vermeijden (1968) by a factor of 2/3. The bending failure of Series “A” occurred in the field although the bending moment at the middle support is 1.6 times higher than the field moment, according to the theory of elasticity. Thus it is shown that there is a moment redistribution by plastic flow by a strong visible shear flow between loading point and middle support.
-
Flow in compression perpendicular to the grain in the oblique bracing direction, at low values of M/Vh, also causes flow in shear deformation at the middle support. The shear angle strongly reduces the rotation angle by bending. This strongly reduces the moment at this support and causes failure to start in the field, although according to the theory of elasticity the field moment is lower by a factor of 1.6 than the moment at the middle support (see Table 1).
-
Thus the ultimate moment distribution of continuous beams does not follow the theory of elasticity, but the theory of plasticity showing equal field and support moments. For low values of M/Vh this is due to a shear flow mechanism over the length of the beam, by equal opposite shear forces and moments at the ends.
-
The shear strength can be explained from the regression line of many tests of shear in bending, shear in torsion and block shear. This regression line can be transformed to a power law form, representing the volume effect according to the Weibull weakest link theory. It gives a precise fit of the available data showing the load carrying capacity to be determined by the shear strength in all cases (of M/Vh<.3).
-
According to the extended beam theory, there is a critical value of the shear slenderness M/Vh (the relative moment-shear force ratio), where the maximal ultimate moment is reached, and at the same time as the ultimate shear force is determining. Above this critical value, bending alone is determining with the same maximal ultimate moment. Below this critical value, the rotation capacity, and thus also the ultimate bending moment, is reduced by the shear force, which is then decisive for failure (see Fig. 1).
-
This critical value for the shear slenderness ratio is about M/Vh=3 to 4.5, depending on the wood quality. This follows from the data by Leicester and Young (1991) while the data by Vermeijden (1968) suggest the possibility of an even lower critical value of M/Vh≈2 for lower quality grades.
-
For values of M/Vh≤1, there is a linear bending stress distribution over the depth of the beam and no plastic flow in bending: σ m <f m ; σ m,t =σ m,c , or α=1. The point where f m =f c and f v =f′ v and α=1 occurs at M/Vh=1 in the series by Vermeijden (1968) and is 1.5 for the high quality laminated veneer lumber by Leicester and Young (1991).
-
As continuation on the theoretical explanation of the bearing strengths of locally loaded blocks (van der Put 2008), the bracing model of beams loaded close to the supports (van der Put 1991) is extended and verified by tests by Vermeijden (1968).
-
Because the shear strength should be determining and not the compression strength perpendicular to the grain by the bracing action, the cut-off of the shear strength should not be earlier than in the situation of Fig. 10, when the entire load is transmitted by shear. Therefore, the length of the bearing plate should be: l=0.64⋅h at end supports and l=1.27⋅h at central supports. This prescription is a simple rule for a design standard.
-
For combined stresses, the failure criterion used in the Codes, is based on biaxial and uniaxial tests. It follows from van der Put (1993) that there is then no decrease of the bending compression strength when the compression perpendicular is about half of the uniaxial compression strength f c,90/2 (in the weakest plane). This is not followed by the empirical rules of the Codes meaning that the triaxial compression strength is already accepted and the local compression strength perpendicular to the grain can be based on (20).
References
Kuilen JWG, van de (1991) Theoretical and experimental research on glass fiber reinforced laminated timber beams. In: Proc of the international timber engineering conference, Vol 3 pp 3.226–3.233
Kuilen JWG, van de, Leijten AJM (2001) Determination of shear strength of seven wood species for application in timber bridges. Stevin report 2001-4/HE-43 (in Dutch)
Larsen HJ (1975) The design of timber beams. CIB-W18/5-10-1, Karlsruhe
Leicester RH, Young EG (1991) Shear strength of continuous beams. CIB-W18/24-10-1, Oxford
Vermeijden P (1968) Shearing strength of close to the support loaded beams on 3 supports. Report 4-68-13/HE-2, TU-Delft (in Dutch)
Put TACM, van der (1991) Discussion of the failure criterion for combined bending and compression. CIB-W18/24-6-1, Oxford
Put TACM, van der (1993) Discussion and proposal of a general failure criterion for wood. The tensor-polynomial failure criterion for wood polymers. CIB-W18/26-6-1. Athens
Put TACM, van der (2008) Derivation of the bearing strength perpendicular to the grain of locally loaded timber blocks. Holz Roh- Werkst 66:409–417
Put TACM, van der, Leijten AJM (2000) Evaluation of perpendicular to the grain failure of beams caused by concentrated loads of joints. CIB-W18/33-7-7, Delft
Open Access
This article is distributed under the terms of the Creative Commons Attribution Noncommercial License which permits any noncommercial use, distribution, and reproduction in any medium, provided the original author(s) and source are credited.
Author information
Authors and Affiliations
Corresponding author
Appendix A: Derivation of the power law
Appendix A: Derivation of the power law
Any function f(x) can always be written in a reduced variable x/x 0 f(x)=f 1(x/x 0) and can be given in the power of a function: f(x)=f 1(x/x 0)=[{f 1(x/x 0)}1/n]n and expanded into the row:
giving:

when: \((f_{1}(1))^{1/n}=(f_{1}(1))^{1/n-1}\cdot f_{1}'(1)/n\), or: \(n= f_{1}'(1)/f_{1}(1)\), where: \(f_{1}'(1)=[\partial f_{1}(x/x_{0})/\partial(x/x_{0})]\) for x=x 0 and f 1(1)=f(x 0). Thus:
It can be seen from this derivation of the power law (A.1), using only the first two expanded terms, that the equation only applies in a limited range of x around x 0.
Rights and permissions
Open Access This is an open access article distributed under the terms of the Creative Commons Attribution Noncommercial License (https://creativecommons.org/licenses/by-nc/2.0), which permits any noncommercial use, distribution, and reproduction in any medium, provided the original author(s) and source are credited.
About this article
Cite this article
van der Put, T.A.C.M., van de Kuilen, J.W.G. Derivation of the shear strength of continuous beams. Eur. J. Wood Prod. 69, 421–430 (2011). https://doi.org/10.1007/s00107-010-0473-3
Received:
Published:
Issue Date:
DOI: https://doi.org/10.1007/s00107-010-0473-3