
Abstract
Measuring, analyzing, and evaluating social, environmental, and economic impact is crucial to aligning the sustainable development strategies of international organizations, governments, and businesses. In this sense, society has been a determining factor exerting pressure for urgent solutions. The main objective of this paper is to provide an exhaustive analysis of the literature about the tools for measuring social impact and their evolution over the last 50 years. The search was conducted in the main academic databases (Scopus and Web of Science), where 924 articles were found from 1969 to 2020 related to the topic. The results of the quantitative analysis show that 71% of the publications were in the last ten years and the most productive countries were the USA and the United Kingdom. The relational analysis identifies 4 large clusters that fragment the literature into different subfields. The most used keywords are linked to the term "Social" in measurement methods, new concepts, and participants. This article contributes to the literature by giving the researcher an insight into the current state of art, trends, categories within the field, and future lines of research.
1 Introduction
Measuring and evaluating social aspects has been gaining importance over the years. There has been a growing interest in knowing the impact that an action, activity, or decision has on society and the environment. The work of Finsterbusch and Wolf (1981) comments that social impacts are dynamic processes or non-static conditions and therefore must be constantly measured. Becker (2001) defined social impact as the process of identifying the future consequences of current or proposed action, which are related to individuals, organizations, and social macrosystems. Private organizations seek to ensure that their mission and the impact they generate are consistent (Ormiston et al., 2011), and the public sector knows that they are necessary to guide new policies (Reeves, 2016). These tools are better known as Social impact assessment (SIA) and play a key role in this environment. A U.S. study presented by the Department of Health, Education, and Welfare (Cohen, 1969) showed the shortcomings and lack of methodology for measuring social issues. Later, development economists called for more accurate social indicators to measure the quality and well-being of their citizens' lives (Hicks and Streeten, 1979), the gross national product (GNP) was no longer enough as a measure of growth.
Every day, society demands clear answers from world leaders on social, environmental, and equality issues. This pressure is important and is reflected in the increase in sustainability reports (Cubilla-Montilla et al., 2019). The need for more precise indicators adapted to the sector will be reflected in better, more accurate, and reliable results (Hutchins et al., 2018). In 1976, with the growth of impact measurement issues, a U.S. study sought to classify them by social impact areas (social security, health, labor) (Fry, 2006). After 50 years, other methods of measuring social impact have been introduced, proposed mainly by academics and in some cases by international organizations and governments. Public institutions and organizations worldwide have begun to listen to society. It has been reflected in agreements and regulations for SIA as a basis for monitoring their impact. For example, the United States Environmental Protection Agency (2017) indicates that sustainable manufacturing is based on at least two of these three elements: economic, social, or environmental. Moreover, the European Commission (2014) proposes methods and defines the benefits of measuring social impact. In this sense, the Horizon 2020 program seeks to meet social challenges, health and welfare, sustainable energy, and other issues related to generating a positive social and environmental impact. Moreover, the 17 sustainable development goals proposed by the ONU (2015) seek to address different resources involving all sectors to be part of it. Finally, impact measurement is crucial for achieving these goals and creating better methods, information processing, presentation of results, and analyze how they influence decision-making.
This paper is constructed as follows. In section two, we review the theory and previously published reviews on the subject. In section three, we describe the methodology used and the steps to reach the sample to be analyzed. In section four, we will make a descriptive analysis of the collected material and an assessment of the databases used applying quantitative methods. Section five will analyze the relationship between keywords and their behavior over time using the Vosviewer tool (van Eck and Waltman, 2010). And finally, by identifying gaps and future lines of research, we hope to encourage other researchers to continue their research in the field of social sustainability.
2 Literature Review
In the '60s Social Indicators (SI) were positioned as tools to measure social impact and gain more prominence to economic indicators (Bauer, 1966). The SIA, first through the SI make their appearance (Olson, 1969). For a correct and precise interpretation of these actions, several studies arise initially linked to the social welfare of employees and society (Drewnowski, 1972). Besides, the focus and relationship with sustainability issues grow (Psacharopoulos and Patrinos, 1994). Table 1 identifies some of the main tools of measuring social impact and its main objective.
Over time, its application has been multiple and has gradually become relevant in economic, commercial, and comparative aspects between nations (Thorelli, 1983), in national policy planning (Krendel, 1971; Press, 2008), the impact of tourism (Perdue et al., 1999) or to evaluate the management of companies concerning social issues (Gallego, 2006).
In the mid-1970s, research specialized and sought more precise information from those involved who were directly affected by their impact. These first questions arose about the SI since there was no confidence in the veracity of their results (Krieger, 1972). For this reason, a methodology was created to evaluate the quality of the indicators (Malizia, 1972). Over the years, studies were published to continue correcting and improving these methodologies (Drewnowski, 1972), to better understand social welfare and thus help formulate policies that favor the social sector through laws and proper planning (Owens, 1976).
Previous studies have examined issues related to measuring social impact, the first compiling the theory generated in those years (Fox, 1986). They discussed how these tools are a basic necessity to help measure the development of society (Diener and Suh, 1997; Hicks and Streeten, 1979) and how they can contribute to reporting (Adams and Frost, 2008). Other authors have studied the areas where these measurement tools can contribute, both in the Political, Economic, Society, and Ecological (Brouwer and Van Ek, 2004). Others examine in-depth how specific organizations behave in the face of a social evaluation (Arvidson and Lyon, 2014). They also investigated the implementation of tools for measuring social impact (Umair et al., 2015).
Besides, other authors focused their research on creating new methods and tools to measure social impact (Becker and Sanders, 2006). Finally, some research was conducted reviewing and evaluating previous developed tools (Malizia, 1972; Sieber, 1979), warning about their difficulty measuring them and the data quality used in evaluation (Strauss and Thomas, 1996).
As shown in Table 2, the most extensive review is Josa and Aguado, which ends in 2019. We cover a more extended period from 1960 to 2020. We intend to reach a more global view with our review since most of these previous reviews have a more specific focus on a measurement tool. By doing so, we want to discover new growth sectors in social measurement, such as reporting tools.
3 Methodology
To provide guidance and direction for future research on the topic of SIA, the study followed the PRISMA methodology (Moher et al., 2009). PRISMA means Preferred Reporting Items for Systematic reviews and Meta-Analyses. It is a methodology that acts as a guard against arbitrary decision-making during review conduct. It serves as a guideline to improve the transparency, accuracy, completeness, and frequency of documented systematic review and meta-analysis protocols (Shamseer et al., 2015). This type of analysis allows qualitative and quantitative evaluation for research on a specific topic (Brewerton and Millward, 2001). Moreover, it is a clear and transparent process to achieve our objectives, making them reproducible for other researchers (Kitchenham and Charters, 2007). This same methodology has recently been used in publications related to sustainability issues (Ferreira Gregorio et al., 2018; Merli et al., 2018; Niñerola et al., 2020) and social indicators (Kühnen and Hahn, 2018).
The next section details the steps followed in this review. How the data sources, were chosen, the filtering (Table 3), the screening process, and how the final sample was reached (Fig. 1).
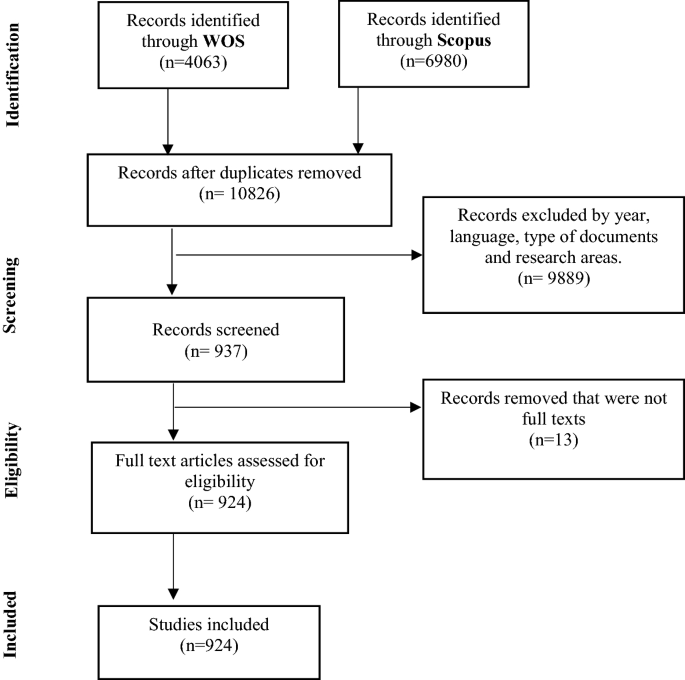
PRISMA workflow
3.1 3.1 Data Sources and Search Strategy
The main sources of information to carry out the review were the Web of Science (WoS) and the Scopus database. They were chosen due to the extension and impact of their publications in different scientific fields (Falagas et al., 2008).
Following previous works (Merli et al., 2018), the article search engine was made up of the following keywords: “Impact Measurement” OR “Social Impact Assessment” OR “Social Indicators” OR “Social Return on Investment”.
The initial search was done on title, abstract, author keywords, and keyword plus in WoS. And in title, abstract, and keywords concerning Scopus. The first results in Scopus were 6,980 documents and, in WoS 4,063 documents (last search 20/06/2021). Later, four filters were set: period, language, document type, and research domain. Only academic peer review papers were considered until 2020, written in English and Spanish. Moreover, they should be included in one of the following research areas: Business, Management and Accounting, and Economics, Econometrics and Finance, in Scopus. In WoS, the areas were: Economics, Management, Business, and Business Finance (Table 3).
In addition, the PRISMA workflow (Moher et al., 2009) is presented in Fig. 1 showing the searching process agglutinating both databases.
3.2 3.2 Databases’ Comprehensiveness for SIA
The final result of each database reflects that Scopus has 600 unique records in their 817 documents. On the other hand, WoS, on its 324 papers, only accounts for 107 unique records. 217 duplicated documents were found comparing both databases. So, the final sample for analyzing was 924 records (Fig. 2).

Material collection process
With the information obtained, both databases are analyzed quantitatively and not by the quality or impact of the documents to see the similarity of the two chosen databases. Three analyses were done: (1) the Meyer Index of Uniqueness (Meyer et al., 1983), (2) Traditional Overlap, and (3) Overlap.
3.2.1 Meyer's Index
The result obtained through the Meyer Index, according to Pulgarín and Escalona (2007) will serve us to evaluate the coverage of a database on a given topic. In Meyer's index, the result is valued over 1, and each database is given a weight of 0.5 for the duplication that may exist (Meyer et al., 1983; Sánchez et al., 2017). The results of this indicator will show us how unique and singular the documents are.
In formula 2, relative to Scopus, the results indicate that this database has a uniqueness of 77%. On the other hand, in WoS, only 23% of its documents will be only found there (Formula 3).
3.2.2 Traditional Overlap
On the other hand, the Traditional Overlap indicates that the higher the percentage, the grter the similarity between the documents published in both databases (Pulgarín and Escalona, 2007). This measure is interesting because it justifies using two databases together by getting a complete picture of the field of study.
The result of formula 5 indicates that 23.48% of the total articles identified for this study are in both databases, which does not show excessive overlap and reaffirms the decision to use both Scopus and WoS to conduct the review.
3.2.3 Overlap
Finally, to show the percentage of participation or coverage that one database has over the other, formula 6 proposed by Bearman and Kunberger (1977) was applied.
The results indicate that Scopus covers a broad extension of the document source, including 66.98% of WoS publications (Formula 8). This value represents only 26,56% in WoS (Formula 7).
4 Descriptive Analysis
The following sections will develop our analysis to visualize who, where, and when has written about the topic of study.
4.1 Evolution of the Publications
The first record found is from 1969. From that point on, its growth has gradually increased in the first 40 years. During the last decade, the research topic takes more importance in the academic world, almost 71% of the total publications occur during this period. Besides, the year 2019 marks a peak of more than 93 publications which means 10%. Figure 3 illustrates the trend that the social impact metrics literature has had throughout its 50 years.

Distribution of the literature over time
4.2 4.2 Main Authors
The study identifies more than 2040 authors who have published documents on SIA. However, 1919 authors only have published a single document which not making this field their main field of expertise.
As can be seen in Table 4, only 4 authors have published 5 or more documents. In terms of productivity, the main author is George Serafiem, with seven publications directly related to the topics analyzed. His work is related to the measurement, management, and communication of corporate sustainability performance, environmental, social, and governance. The seconds, Sanjeev Gupta and Frank Vanclay, each with six publications. Most of Gupta's studies analyze public spending related to education, health, and poverty, areas where social indicators try to measure impact. Frank Vanclay has maintained his research on measuring the effect that the creation and implementation of large projects have on society, e.g. mining.
On the other hand, Table 5 shows the most cited authors noting that they are not the most prolific, except for Serafeim. Serafiem G., Ioannou I., and Cheng B. are the co-authors of the most cited paper in our sample (Cheng et al., 2014). It is about the importance of demonstrating that improving stakeholder engagement and transparency of CSR outcomes are essential for reducing capital constraints and improving finance access.
Baker F. and Intagliata J. work, aimed at improving the quality of life of chronic patients, has more than 276 citations. On it, they evaluate the effectiveness of the Community Support System (CSS) program by showing society's concern and the government in making decisions regarding social issues.
4.3 4.3 Geographical Distribution
The diversity found in the authors' affiliation is shown in Fig. 4. 80 countries have contributed to this topic in these 50 years.

Geographical origin of literature according to the affiliation of the authors (number of articles)
The United States, being the pioneer in the subject, has maintained its interest and its publications reach 237 documents, representing more than 25% of the sample. Obviously, they are placed at the top of the list. The UK and Australia follow them with 106 and 84 documents, respectively.
By geographical area, Brazil is the leading South American country with 26 documents. On the Asian side, China with 17, India with 42, and Russia with 17 are the countries that have contributed most to the study of SIA. Focusing on Europe, it could be said that the countries of the old continent have had more interest in these topics. They have published almost half of the articles.
Finally, it should be noted that the group of emerging economies that make up the so-called BRICs have shown great interest in researching social impact metrics, with a total of 113 publications.
4.4 4.4 Main Sources
Three journals have made the majority of publications. They have as their primary research topics sustainability, environment, and society issues. They seek to promote solutions to current problems through their publications.
The Journal Cleaner Production occupies the first position with 5.63% of the published articles. The Evaluation and Program Planning journal is second with 2.9% of the papers, and the World Development with 2.16% is third. These journals represent 11% of the total of 924 published documents.
As a great variety of authors were found in the previous section, the study also identifies 470 sources that have published at least one article related to the topic.
On the other hand, looking at the number of citations, which can be an indicator of the quality of the publications, the first one continues to be The Journal of Cleaner Production with 960, followed by Evaluation and Program Planning and World Development with 784 and 690 citations respectively (Table 6). These three journals have become the main and most important source of information about SIA for researchers. In addition, information on the current situation, ranking, quartile, and impact factor is included. The International Journal of Social Economics is new in the Category of Economics in the JCR. Therefore some information is not available.
5 Relational Analysis
Vosviewer software is a tool that allows us to build and visualize bibliometric maps (van Eck & Waltman, 2010). It has become the most widely used and fastest-spreading tool in the scientific world (Pan et al., 2018). This section will identify the most used keywords, their level of relationship, the proximity between them, and trends over time. Finally, new participants in the SIA environment and their growth in recent years were discovered, resulting in the creation of other categories.
5.1 5.1 Keywords Analysis
Authors use keywords to identify their work. These keywords give us an idea of the content, topic, or methodology of the article. The study identifies 1,593 different keywords. In Table 7, the ten most used were detailed. As expected, SI and SIA appeared at the top of the list. Among the main measurement tools, only Social Return on Investment is highly used as a keyword.
A threshold of 10 occurrences and a minimum of 10 connections were established in the study to visualize more clearly the relationships between these main keywords. These values led to the identification of 51 keywords.
The node size shows the number of repetitions (occurrences) of each keyword (Fig. 5). On the other hand, the lines represent the number of times the keywords appear together. Moreover, the thickness of this line represents the intensity of this relationship, thicker lines more times appearing together.

Keyword network visualization.
One of the biggest nodes is "social indicators", which occupied first place in Table 7. It should be emphasized that the word "sustainability" appears very close to "Social Indicators", but that is also related to all the most repeated keywords. Moreover, “sustainability” is next to "corporate social responsibility" which contains terms related to the company and its activities. Another important remark is that "social return on investment" (SROI) appears together in the same cluster that "impact measurement" and they are the ones that have more distance to the "social indicators" keyword.
The software groups the items by color. Each color is a cluster, and each keyword can only belong to one. Keywords in the same cluster indicate that they are strongly related to each other. The clusters found are compiled in Table 8.
Cluster #1 in red has 16 elements, being the largest group. They can relate to economic, development, and social policy issues, highlighting sustainability issues and methods to measure them. Cluster #2, in green with 13 items, with more generic keywords and related to social and economic indicators that sought to know aspects of the welfare of society.
On the other hand, cluster #3 in blue highlights the terms of measurement and social evaluation, several nodes have a considerable thickness and are very close, both companies, investments, ventures, and entrepreneurs, involved with social terms. Finally, cluster #4 in yellow is located in the middle due to the close relationship with all the clusters. Its primary node "social impact assessment" interacts with various sectors such as business, social, and projects that have a great environmental impact. This node is located in this position, showing us that the interest in knowing the social impact has been the subject of research by various sectors, government, environment, and companies.
On the other hand, to see the evolution of these keywords over time is an interesting second analysis of our sample. Through the VOSviewer, it is possible to see if the keywords appearing in older papers or, on the contrary, their use is more recent with a color scale. Figure 6 shows this information.

Keyword trend visualization
The term "social indicator" mainly was employed in the early decades because it is in dark blue. "Social Indicators" was one of the first keyword used since the 60s and has been gaining interest until the 90s. It had great prominence, especially in publications related to politics and the welfare of society. Related keywords were appearing such as "quality life", "poverty" and "public issues" during the first period.
Following the chronological axis from 2011, in green appear themes related to the environment, new terms to measure the impact, such as "social impact assessment". The private sector is included in this topic by the researchers since their activities are the ones that generate more impact, and they seek to evaluate it through their studies of corporate social responsibility. Another major field of research is sustainability in terms of development, reporting, and evaluation.
Currently, as shown in yellow the keywords associated with "social" dominate the graphic. They seek to evaluate businesses and all the agents involved, the investment, its source, or how it is used. On the other hand, also recognize the entrepreneur and social innovations and the social value that this can generate. So, in the end, two terms stand out, which in turn are the tools that seek to measure the current impact in various sectors, both public and private and with particular emphasis on the social. The first is "social life cycle assessment," whose main objective is to provide information on the life cycle activity of your product that can have a social effect on people (Dreyer et al., 2006). The second is "social return on investment," which seeks to understand how the value of an investment can generate a social benefit (Nicholls et al., 2012).
5.2 5.2 Categorization by Researched Topics
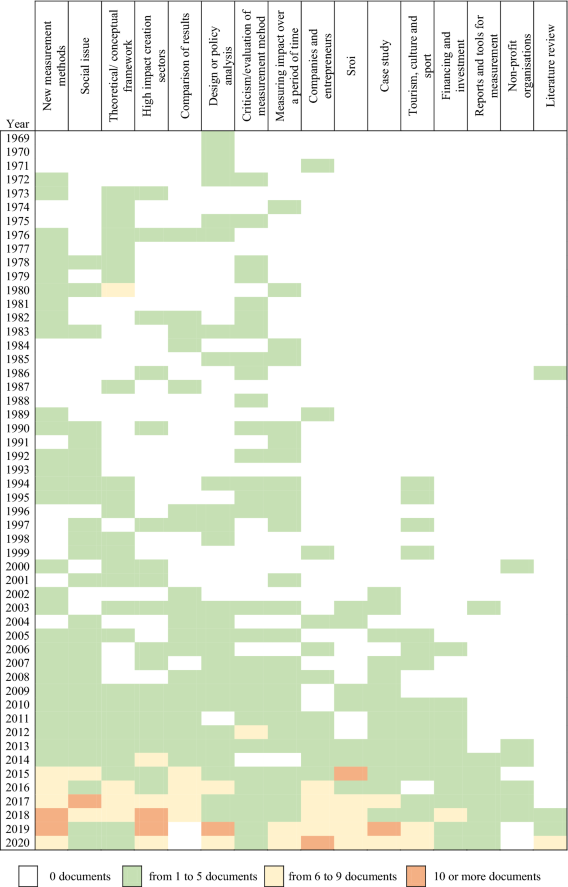
The study identified the main categories that could cover the most relevant and important trends in the publications and know the behavior of each topic in these 50 years. Sixteen categories were established (Table 9) and, through an analysis of the content of the publications, each paper was assigned to one category.
According to the results (Table 10), the first three categories agglutinate 31% of the publications. They are the most important and related to creating new methodologies and their application in social issues. It is worth noting that the first six categories represent more than 57%. On the other hand, the last five categories do not represent even 20% of the total, but most of them have been published in the last two decades, so a potential growth may be expected.
5.3 5.3 Trends in Publication
The histogram shown in Fig. 7 (see appendix for more detail) shows the evolution of the main categories in the last decade. This analysis includes the first four categories in Table 10 as the most important because of the number of publications. However, SROI's category was added because 92% of its publications appear in the last eight years, being larger than those published by the 3rd and 4th categories in the same period.

Evolution of main categories.
5.3.1 New Measurement Methods
The first paper contributing to this category was published in 1972. The interest and importance of finding new measurement methods are reflected in the number of publications. It indicates that organizations find tools helpful for better strategic planning (Alireza et al., 2017). Other studies have considered sustainability, environmental, economic, and social indicators for product redesign (Lacasa et al., 2016). During the first years, it was already considered a complement to better measure the quality of life. In this sense, social and human indicators were taken into account (Hicks and Streeten, 1979). The study of Wachs and Kumagai (1973) regarding accessibility indicators helps to elaborate more coherent policies.
5.3.2 Social Issues
The impact created in society has also brought the attention of researchers, with a total of 87 publications. Almost 58% of them were in the last ten years, reaching the maximum in 2017. Papers in this category are focused on knowing how more specific groups are affected by different situations: racial, labor discrimination (Fryer, 2011), regional or world poverty (Aturupane et al., 1994; Hall & Patrinos, 2006), as well as studies oriented to human and social welfare, mental health (Graham and Nikolova, 2015) and how an economic crisis can seriously affect it (Mohseni-Cheraghlou, 2016). It is vital to measure the impact of those situations for a guarantee that the most vulnerable groups were not the most affected.
5.3.3 Theoretical
Publications aimed at defining, creating concepts, describing, classifying, or applying and interpreting them are included in this category (Becker, 2001). It had its most significant contribution in the first 27 years. Until 1999, it was the category that more public had 46% of its production in the last seven years. In 1973 a study highlighted the importance of social policies and programs and their complexity (Moser, 1973). Fedderke and Klitgaard (1998) show a relationship with economic growth. They said that the private sector could also benefit from applying a measurement method and presenting its impact (Doane, 2005). Therefore, it was important to provide a theoretical framework for companies (Costa and Pesci, 2016).
5.3.4 High Impact sector
There were not many papers in this category in the first years. In fact, until 1999 only 10% of the paper in this category were published. On the other hand, in the last ten years, this score grows to 72%. 2018 was the year with the highest number of papers focused on this subtopic, 11 articles. Australia, in particular, has focused several studies on marine protected areas (McNeill et al., 2018; Voyer et al., 2014), considered a high impact sector. Papers regarding the fisheries sector have also been a research area included in this category (Bradshaw et al., 2001; Brooks, 2010). The mining sector and its influence on social and economic development ((Lagos and Blanco Edgar, 2010) or the oil sector (Jacob et al., 2013) are other examples of industries where the social impact has incidence.
5.3.5 SROI
SROI's category has become important in the last seven years of the study. These years include 82% of the articles. 2015 was the most productive year with 12 publications. If only the last 20 years of the study were taken into account, SROI's category would be one of the first five primary categories, given the high volume of participation. From the beginning, some authors comment that social impact assessment can generate financial and social benefits to the company (Lingane and Olsen, 2004). Despite its popularity and acceptance in several sectors as a measurement tool, there are barriers and obstacles in the interpretation and lack of training (Millar and Hall, 2013). Other aspects such as financial accounting can provide valuable information that, together with social tools, can generate future change in public policy (Nicholls, 2017).
6 Discussion
Measuring social impact has been mostly related to issues of politics, welfare, quality of life, and tourism in the first 20 years. There was a need for studies that, through social indicators, sought to measure the influence of business practices in society (Baker and Intagliata, 1982; Hicks and Streeten, 1979).
In 2000, 8-millennium goals were launched, and several resources were allocated for their achievement. Environmental issues, social development, and the private sector take centre stage in the publications (Gupta et al., 2002). Management and policies were further evaluated (Brouwer and Van Ek, 2004). Besides, more initiatives have been added, such as the Sustainable Development Goals, which now aim to achieve 17 goals by 2030 (ONU, 2015). These objectives increase research, publications, and their variety. The last five years have been a reflection of this effort to improve sustainable practices. At least 7 of the SDG goals are related to the research topic since they claim tools to measure and evaluate them (Schönherr et al., 2017).
The international organizations propose that everyone must necessarily participate in achieving the goals. They design several manuals and guides, all to stimulate collaboration and information flow. Therefore, methodologies and models have been developed to help in this regard (Mota et al., 2015). The debate is oriented towards exposing the advantages of measuring social impact (Gibbon and Dey, 2011) and formulating a criticism or recommendation to improve the methodology.
Previous studies have already shown that companies with better social performance and better stakeholder engagement are essential for reducing capital constraints (Cheng et al., 2014). As well as the use of relevant indicators and appropriate language can improve reporting and increase stakeholder interest (Moore et al., 2003). The category of companies and enterprises highlights the importance of company objectives and strategies being aligned with social impact measurement (Ormiston et al., 2011). Among the categories, it was also possible to detect that some studied established relationships between countries, or in turn regions or cities by their social indicators (Hashimoto et al., 2009), either to measure growth or decline between two or more places.
The work of Rawhouser et al. (2019) also remarked a recent academic interest in focusing on small companies and entrepreneurs. Despite the review of Kühnen and Hahn (2018), our results indicate that the three leading journals were related to sustainability, environmental, and societal issues. The same happened in the identification of the study subtopics in the field observed through the cluster analysis. Although the search keywords used were exclusively oriented towards social impact, the other dimensions of sustainability appeared (the triple bottom line). It may suggest that many articles do not address social sustainability isolated or authors use very generic keywords to increase their scope.
Finally, another factor to be highlighted is the tremendous growth of the literature reviews over the last two years. 60% of the documents of this category were published since 2018. The increase shows the importance of analyze previous literature for identifying new fields of research or gaps to cover.
7 Conclusion, Limitations, and Future Research Lines
People often work independently, but today's reality depends on being efficient not only at the individual or business level but on a broader scale. Useful tools when measuring social impact in academia and practice may help to improve the whole environment. In this sense, SIA has become a key tool for many governments and public organizations that must obtain precise results for decision-making and create policies that can benefit their population. They are crucial for maintaining and evaluating whether the progress or measures taken are optimal or should be reformulated.
Some of these measurement tools have become a part of operating or even creating new projects and businesses as new funding sources increasingly require a positive social impact. Many non-profit organizations are choosing to provide loans that help develop the social environment. Little by little, public and private sector, even banks are giving more value on the social impact, although there is still a long way to work on. The pressure from society is reflected in global objectives and commitments that nations are willing to achieve in the short term.
Our objective was to show an overview of the content published in the last 50 years on metrics for measuring social impact. The study shows that these metrics produce a bulk of literature not exclusively focused on social practices or implications. The authors chose very generic keywords, which difficult to identify the important documents in the field. This represents a limitation of conducting a study based on keywords searched. Moreover, the categorization has been conducted, giving priority to the main objectives of the article. Some papers could be included in other categories, but the most relevant was chosen by reading the introduction and conclusions.
It should be highlighted that despite "Financing and Investment" and "Reports and tools for measurement" categories do not represent a significant number of our sample papers, they are growing in the last few years. There is an active participation of academics and practitioners in projects considering the objectives included in those categories. Therefore, it is expected that they will continue capturing the attention of researchers as it is essential to disseminate results that include social metrics and to attract financing.
References
Adams, C. A., & Frost, G. R. (2008). Integrating sustainability reporting into management practices. Accounting Forum, 32(4), 288–302. https://doi.org/10.1016/j.accfor.2008.05.002
Alireza, A. F. F., Rashidi, T. H., Akbarnezhad, A., & Waller, S. T. (2017). BIM-enabled sustainability assessment of material supply decisions. Engineering Construction and Architectural Management, 24(4), 668–695. https://doi.org/10.1108/ECAM-12-2015-0193
Arvidson, M., & Lyon, F. (2014). Social Impact measurement and non-profit organisations: compliance, resistance, and promotion. Voluntas, 25(4), 869–886. https://doi.org/10.1007/s11266-013-9373-6
Aturupane, H., Glewwe, P., & Isenman, P. (1994). Poverty, human development, and growth: an emerging consensus? American Economic Review, 84(2), 244–249.
Baker, F., & Intagliata, J. (1982). Quality of life in the evaluation of community support systems. Evaluation and Program Planning, 5(1), 69–79. https://doi.org/10.1016/0149-7189(82)90059-3
Bauer, R. A. (1966). Social indicators. M.I.T. Press.
Bearman, T. C., & Kunberger, W. A. (1977). A study of coverage overlap among fourteen major science and technology abstracting and indexing services. Philadelphia: National Federation of Abstracting and Indexing Services.
Becker, H. A. (2001). Social impact assessment. European Journal of Operational Research, 128(2), 311–321. https://doi.org/10.1016/S0377-2217(00)00074-6
Becker, H. A., & Sanders, K. (2006). Innovations in meta-analysis and social impact analysis relevant for tech mining. Technological Forecasting and Social Change, 73(8), 966–980. https://doi.org/10.1016/j.techfore.2006.01.008
Bradshaw, M., Wood, L., & Williamson, S. (2001). Applying qualitive and quantitive research: A social impact assessment of a fishery. Applied Geography, 21(1), 69–85. https://doi.org/10.1016/S0143-6228(00)00021-7
Brewerton, P., & Millward, L. (2001). Organizational research methods: A guide for students and researchers. Sage.
Brooks, K. (2010). Sustainable development: Social outcomes of structural adjustments in a South Australian fishery. Marine Policy, 34(3), 671–678. https://doi.org/10.1016/j.marpol.2009.12.008
Brouwer, R., & Van Ek, R. (2004). Integrated ecological, economic and social impact assessment of alternative flood control policies in the Netherlands. Ecological Economics, 50(1–2), 1–21. https://doi.org/10.1016/j.ecolecon.2004.01.020
Cheng, B., Ioannou, I., & Serafeim, G. (2014). Corporate social responsibility and access to finance. Strategic Management Journal, 35(1), 1–23. https://doi.org/10.1002/SMJ.2131
Cohen, W. J. (1969). Toward a Social Report.
Costa, E., & Pesci, C. (2016). Social impact measurement: why do stakeholders matter? Sustainability Accounting Management and Policy Journal, 7(1), 99–124. https://doi.org/10.1108/SAMPJ-12-2014-0092
Cubilla-Montilla, M., Nieto-Librero, A.-B., Galindo-Villardón, M. P., Vicente Galindo, M. P., & Garcia-Sanchez, I.-M. (2019). Are cultural values sufficient to improve stakeholder engagement human and labour rights issues? Corporate Social Responsibility and Environmental Management, 26(4), 938–955. https://doi.org/10.1002/csr.1733
Diener, E., & Suh, E. (1997). Measuring quality of life: Economic, social, and subjective indicators. Social Indicators Research, 40(1–2), 189–216. https://doi.org/10.1023/A:1006859511756
Doane, D. (2005). Beyond corporate social responsibility: Minnows, mammoths and markets. Futures, 37(2–3), 215–229. https://doi.org/10.1016/j.futures.2004.03.028
Drewnowski, J. (1972). Social indicators and welfare measurement: remarks on methodology. The Journal of Development Studies, 8(3), 77–90. https://doi.org/10.1080/00220387208421413
Dreyer, L. C., Hauschild, M. Z., & Schierbeck, J. (2006). A framework for social life cycle impact assessment. International Journal of Life Cycle Assessment, 11(2), 88–97. https://doi.org/10.1065/lca2005.08.223
Falagas, M. E., Pitsouni, E. I., Malietzis, G. A., & Pappas, G. (2008). Comparison of pubmed, scopus, web of science, and google scholar: strengths and weaknesses. The FASEB Journal, 22(2), 338–342. https://doi.org/10.1096/fj.07-9492lsf
Fedderke, J., & Klitgaard, R. (1998). Economic growth and social indicators: an exploratory analysis. Economic Development and Cultural Change, 46(3), 455–489. https://doi.org/10.1086/452354.
Ferreira Gregorio, V., Pié, L., & Terceño, A. (2018). A systematic literature review of bio, green and circular economy trends in publications in the field of economics and business management. Sustainability (Switzerland). https://doi.org/10.3390/su10114232
Finsterbusch, K., & Wolf, C. P. (1981). Methodology of social impact assessment. Stroudsburg, PA: Hutchinson Ross.
Fox, K. A. (1986). The present status of objective social indicators: a review of theory and measurement. American Journal of Agricultural Economics, 68(5), 1113–1120. https://doi.org/10.2307/1241860
Fry, B. (2006). Stable isotope ecology. Springer New York.
Fryer, R. G. (2011). Racial inequality in the 21st century: The declining significance of discrimination. In Handbook of Labor Economics (Vol. 4, pp 855–971).
Gallego, I. (2006). The use of economic, social and environmental indicators as a measure of sustainable development in Spain. Corporate Social Responsibility and Environmental Management, 13(2), 78–97. https://doi.org/10.1002/csr.94
Gibbon, J., & Dey, C. (2011). Developments in social impact measurement in the third sector: Scaling up or dumbing down? Social and Environmental Accountability Journal, 31(1), 63–72. https://doi.org/10.1080/0969160X.2011.556399
Graham, C., & Nikolova, M. (2015). Bentham or aristotle in the development process? an empirical investigation of capabilities and subjective well-being. World Development, 68(1), 163–179. https://doi.org/10.1016/j.worlddev.2014.11.018
Gunningham, N., Kagan, R. A., & Thornton, D. (2004). Social license and environmental protection: why businesses go beyond compliance. Law and Social Inquiry, 29(2), 307–341. https://doi.org/10.1111/j.1747-4469.2004.tb00338.x
Gupta, S., Verhoeven, M., & Tiongson, E. R. (2002). The effectiveness of government spending on education and health care in developing and transition economies. European Journal of Political Economy, 18(4), 717–737. https://doi.org/10.1016/S0176-2680(02)00116-7
Hall, G., & Patrinos, H. A. (2006). Indigenous peoples poverty and human development in Latin America. Palgrave Macmillan.
Hashimoto, A., Sugita, T., & Haneda, S. (2009). Evaluating shifts in Japan’s quality-of-life. Socio-Economic Planning Sciences, 43(4), 263–273. https://doi.org/10.1016/j.seps.2009.01.001
Hicks, N., & Streeten, P. (1979). Indicators of development: The search for a basic needs yardstick. World Development, 7(6), 567–580. https://doi.org/10.1016/0305-750X(79)90093-7
Hutchins, M. J., Richter, J. S., Henry, M. L., & Sutherland, J. W. (2018). Development of indicators for the social dimension of sustainability in a U.S. business context. Journal of Cleaner Production, 212, 687–697. https://doi.org/10.1016/j.jclepro.2018.11.199
Jacob, S., Weeks, P., Blount, B., & Jepson, M. (2013). Development and evaluation of social indicators of vulnerability and resiliency for fishing communities in the Gulf of Mexico. Marine Policy, 37(1), 86–95. https://doi.org/10.1016/j.marpol.2012.04.014
Josa, I., & Aguado, A. (2019). Infrastructures and society: from a literature review to a conceptual framework. Journal of Cleaner Production. https://doi.org/10.1016/j.jclepro.2019.117741
Kah, S., & Akenroye, T. (2020). Evaluation of social impact measurement tools and techniques: a systematic review of the literature. Social Enterprise Journal, 16(4), 381–402. https://doi.org/10.1108/SEJ-05-2020-0027
Kitchenham, B., Charters, S. (2007). Guidelines for performing systematic literature reviews in software engineering Version 2.3. In EBSE Technical Report. https://doi.org/10.1145/1134285.1134500
Krendel, E. S. (1971). Social systems dynamics *. Socio-Economic Planning Sciences, 5, 387–393.
Krieger, M. H. (1972). Social indicators and the life cycle. Socio-Economic Planning Sciences, 6(3), 305–317. https://doi.org/10.1016/0038-0121(72)90035-3
Kühnen, M., & Hahn, R. (2018). Systemic social performance measurement: Systematic literature review and explanations on the academic status quo from a product life-cycle perspective. Journal of Cleaner Production, 205, 690–705. https://doi.org/10.1016/j.jclepro.2018.08.201
Lacasa, E., Santolaya, J. L., & Biedermann, A. (2016). Obtaining sustainable production from the product design analysis. Journal of Cleaner Production, 139, 706–716. https://doi.org/10.1016/j.jclepro.2016.08.078
Lagos, G., & Blanco Edgar, E. (2010). Mining and development in the region of Antofagasta. Resources Policy, 35(4), 265–275. https://doi.org/10.1016/j.resourpol.2010.07.006
Lingane, A., and Olsen, S. (2004). Guidelines for social return on investment. In California management review (Vol. 46, Issue 3, pp. 116–135). University of California Press. https://doi.org/10.2307/41166224
Malizia, E. E. (1972). Measurement tests for evaluation of social indicators. Socio-Economic Planning Sciences, 6(4), 421–429. https://doi.org/10.1016/0038-0121(72)90015-8
Mancini, L., & Sala, S. (2018). Social impact assessment in the mining sector: Review and comparison of indicators frameworks. Resources Policy, 57, 98–111. https://doi.org/10.1016/j.resourpol.2018.02.002
McNeill, A., Clifton, J., & Harvey, E. S. (2018). Attitudes to a marine protected area are associated with perceived social impacts. Marine Policy, 94, 106–118. https://doi.org/10.1016/j.marpol.2018.04.020
Merli, R., Preziosi, M., & Acampora, A. (2018). How do scholars approach the circular economy? A systematic literature review. Journal of Cleaner Production, 178, 703–722. https://doi.org/10.1016/j.jclepro.2017.12.112
Meyer, D., Mehlman, D., Reeves, E., Origoni, R., Delores, E., & Sellers, D. (1983). Comparison study of overlap among 21 scientific databases in searching pesticide information. Online Review, 7(1), 33–43. https://doi.org/10.1108/eb024120
Millar, R., & Hall, K. (2013). Social return on investment (SROI) and performance measurement: the opportunities and barriers for social enterprises in health and social care. Public Management Review, 15(6), 923–941. https://doi.org/10.1080/14719037.2012.698857
Moher, D., Liberati, A., Tetzlaff, J., Altman, D. G., and Group, T. P. (2009). Preferred reporting items for systematic reviews and meta-analyses: The PRISMA statement. PLOS Medicine, 6(7), e1000097
Mohseni-Cheraghlou, A. (2016). The Aftermath of financial crises: A look on human and social wellbeing. World Development, 87, 88–106. https://doi.org/10.1016/j.worlddev.2016.06.001
Moore, S. A., Smith, A. J., & Newsome, D. N. (2003). Environmental performance reporting for natural area tourism: Contributions by visitor impact management frameworks and their indicators. Journal of Sustainable Tourism, 11(4), 348–375. https://doi.org/10.1080/09669580308667211
Moser, S. C. (1973). Social indicators —systems, methods and problems. Review of Income and Wealth, 19(2), 133–141. https://doi.org/10.1111/j.1475-4991.1973.tb00878.x
Mota, B., Gomes, M. I., Carvalho, A., & Barbosa-Povoa, A. P. (2015). Towards supply chain sustainability: Economic, environmental and social design and planning. Journal of Cleaner Production, 105, 14–27. https://doi.org/10.1016/j.jclepro.2014.07.052
Nicholls, J., Lawlor, E., Neitzert, E., Goodspeed, T., Cupitt, S., Durie, S., Inglis, J., Leathem, K., Lumley, T., & Piper, R. (2012). A guide to Social Return on Investment. The SROI Network. Accounting for Value; Office of the Third Sector: London.
Nicholls, J. (2017). Social return on investment—Development and convergence. Evaluation and Program Planning, 64, 127–135. https://doi.org/10.1016/j.evalprogplan.2016.11.011
Niñerola, A., Ferrer-Rullan, R., & Vidal-Suñé, A. (2020). Climate change mitigation: Application of management production philosophies for energy saving in industrial processes. Sustainability (Switzerland). https://doi.org/10.3390/su12020717
Norman, W., & MacDonald, C. (2004). Getting to the bottom of “Triple Bottom Line.” Business Ethics Quarterly, 14(2), 243–262.
Olson, M. (1969). Social indicators and social accounts. Socio-Economic Planning Sciences, 2(2–4), 335–346. https://doi.org/10.1016/0038-0121(69)90028-7
ONU. (2015). UN sustainable development goals. Agenda 2030. (Vol. 16301).
Ormiston, J., Seymour, R., Ormiston, J., & Seymour, R. (2011). Understanding value creation in social entrepreneurship : The importance of aligning mission, strategy and impact measurement. Journal of Social Entrepreneurship. https://doi.org/10.1080/19420676.2011.606331
Owens, H. (1976). Social indicators. Australian Economic Review, 9(2), 25–34. https://doi.org/10.1111/j.1467-8462.1976.tb00978.x
Pan, X., Yan, E., Cui, M., & Hua, W. (2018). Examining the usage, citation, and diffusion patterns of bibliometric mapping software: A comparative study of three tools. Journal of Informetrics, 12(2), 481–493. https://doi.org/10.1016/j.joi.2018.03.005
Perdue, R. R., Long, P. T., & Kang, Y. S. (1999). Boomtown tourism and resident quality of life. Journal of Business Research, 44(3), 165–177. https://doi.org/10.1016/S0148-2963(97)00198-7
Perrini, F., Costanzo, L. A., & Karatas-Ozkan, M. (2021). Measuring impact and creating change: a comparison of the main methods for social enterprises. Corporate Governance: The International Journal of Business in Society, 21(2), 237–251. https://doi.org/10.1108/CG-02-2020-0062
Press, L. J. (2008). Social indicators in perspective. Socio-Economic Planning Sciences, 4, 207–216. https://doi.org/10.1016/j.optm.2008.09.004
European Commission. (2014). Proposed approaches to social impact measurement. https://doi.org/10.2767/28877
Psacharopoulos, G., & Patrinos, H. A. (1994). Indigenous people and poverty in Latin America: an empirical analysis. Indigenous People and Poverty in Latin America: An Empirical Analysis. https://doi.org/10.5860/choice.32-4566
Pulgarín, A., & Escalona, M. F. (2007). Measurement of the ovelapping in three data bases with information on engineering. Anales de Documentación: Revista de Biblioteconomía y Documentación, 10(10), 335–344. https://doi.org/10.6018/analesdoc.10.0.1231
Rawhouser, H., Cummings, M., & Newbert, S. L. (2019). Social impact measurement: current approaches and future directions for social entrepreneurship research. Entrepreneurship Theory and Practice, 43(1), 82–115. https://doi.org/10.1177/1042258717727718
Reeves, R. V. (2016). How will we know? The case for opportunity indicators. In H. Braun & I. Kirsch (Eds.), The dynamics of opportunity in america evidence and perspectives (pp. 443–464). Springer. https://doi.org/10.1007/978-3-319-25991-8_13
Sánchez, A. D., Del Río, M. D. L. C., & García, J. Á. (2017). Bibliometric analysis of publications on wine tourism in the databases Scopus and WoS. European Research on Management and Business Economics, 23(1), 8–15. https://doi.org/10.1016/j.iedeen.2016.02.001
Schönherr, N., Findler, F., and Martinuzzi, A. (2017). Exploring the interface of CSR and the sustainable development goals. In Transnational Corporations (Vol. 24, Issue 3, pp. 33–47). UNCTAD United Nations Conference on Trade and Development.
Shamseer, L., Moher, D., Clarke, M., Ghersi, D., Liberati, A., Petticrew, M., Shekelle, P., Stewart, L. A., Altman, D. G., Booth, A., Chan, A. W., Chang, S., Clifford, T., Dickersin, K., Egger, M., Gøtzsche, P. C., Grimshaw, J. M., Groves, T., Helfand, M., & Whitlock, E. (2015). Preferred reporting items for systematic review and meta-analysis protocols (prisma-p) 2015: Elaboration and explanation. BMJ (Online), 349(January), 1–25. https://doi.org/10.1136/bmj.g7647
Sieber, J. E. (1979). Critical appraisal of social indicators. Evaluation and Program Planning, 2(1), 13–16. https://doi.org/10.1016/0149-7189(79)90041-7
Strauss, J., & Thomas, D. (1996). Measurement and mismeasurement of social indicators. American Economic Review, 86(2), 30–34. https://doi.org/10.2307/2118091
Thorelli, H. (1983). Management audit and social-indicators - Mnc through glasses of LDC. International Accounting and Transnational Decisions, pp 293–311.
Umair, S., Björklund, A., & Petersen, E. E. (2015). Social impact assessment of informal recycling of electronic ICT waste in Pakistan using UNEP SETAC guidelines. Resources, Conservation and Recycling, 95, 46–57. https://doi.org/10.1016/j.resconrec.2014.11.008
United States Environmental Protection Agency. (2017). Sustainable Manufacturing.
van Eck, N. J., & Waltman, L. (2010). Software survey: VOSviewer, a computer program for bibliometric mapping. Scientometrics, 84(2), 523–538. https://doi.org/10.1007/s11192-009-0146-3
Visentin, C., da Trentin Silva, A. W., Braun, A. B., & Thomé, A. (2020). Life cycle sustainability assessment: A systematic literature review through the application perspective, indicators, and methodologies. Journal of Cleaner Production. https://doi.org/10.1016/j.jclepro.2020.122509
Voyer, M., Gladstone, W., & Goodall, H. (2014). Obtaining a social licence for MPAs—influences on social acceptability. Marine Policy, 51, 260–266. https://doi.org/10.1016/j.marpol.2014.09.004
Wachs, M., & Kumagai, T. G. (1973). Physical accessibility as a social indicator. Socio-Economic Planning Sciences, 7(5), 437–456. https://doi.org/10.1016/0038-0121(73)90041-4
Funding
Open Access funding provided thanks to the CRUE-CSIC agreement with Springer Nature.
Author information
Authors and Affiliations
Corresponding author
Additional information
Publisher's Note
Springer Nature remains neutral with regard to jurisdictional claims in published maps and institutional affiliations.
Appendix
Appendix
Rights and permissions
Open Access This article is licensed under a Creative Commons Attribution 4.0 International License, which permits use, sharing, adaptation, distribution and reproduction in any medium or format, as long as you give appropriate credit to the original author(s) and the source, provide a link to the Creative Commons licence, and indicate if changes were made. The images or other third party material in this article are included in the article's Creative Commons licence, unless indicated otherwise in a credit line to the material. If material is not included in the article's Creative Commons licence and your intended use is not permitted by statutory regulation or exceeds the permitted use, you will need to obtain permission directly from the copyright holder. To view a copy of this licence, visit http://creativecommons.org/licenses/by/4.0/.
About this article

Cite this article
Alomoto, W., Niñerola, A. & Pié, L. Social Impact Assessment: A Systematic Review of Literature. Soc Indic Res 161, 225–250 (2022). https://doi.org/10.1007/s11205-021-02809-1
Accepted:
Published:
Issue Date:
DOI: https://doi.org/10.1007/s11205-021-02809-1